Soluble receptors for tumor necrosis factor-
a
(TNF-R p55 and
TNF-R p75) in familial combined hyperlipidemia
Marleen M.J. van Greevenbroek
a,*, Carla J.H. van der Kallen
a, Jan M.W. Geurts
a,
Rob G.J.H. Janssen
a, Wim A. Buurman
b, Tjerk W.A. de Bruin
aaLaboratory for Molecular Metabolism and Endocrinology/UNS50,Department of Internal Medicine,
Cardio6ascular Research Institute Maastricht(CARIM),Maastricht Uni6ersity,PO Box616,6200Maastricht MD,The Netherlands bDepartment of Surgery,Maastricht Uni6ersity,Maastricht,The Netherlands
Received 24 May 1999; received in revised form 18 November 1999; accepted 5 January 2000
Abstract
We investigated the potential role of the 75 kD receptor for tumor necrosis factor-a (TNF-a) (TNFRSF1B, located on chromosome 1 band p36.2) as a modifier gene in familial combined hyperlipidemia (FCH), based on previous linkage and association data. Age-corrected values for the soluble (s) extracellular domain of TNF-R p75 were lower in 156 well-characterized hyperlipidemic (HL) FCH relatives than in 168 normolipidemic (NL) relatives (PB0.01). Plasma concentrations of the soluble domain of the 55 kD receptor (sTNF-R p55, the other TNF-a receptor) did not differ between HL and NL relatives. In conditional logistic regression analysis, plasma sTNF-R p75 concentration was the only non-lipid variable that contributed significantly to prediction of affected FCH status (regression coefficient= −0.413, P=0.01). The present findings have potentially important diagnostic and therapeutic implications in FCH. © 2000 Elsevier Science Ireland Ltd. All rights reserved.
Keywords:Insulin resistance; Tnf-sr55; Tnf-sr75;TNFRSF1B; Disorders; Genetic; Regression analysis
1. Introduction
Familial combined hyperlipidemia (FCH) is a com-mon genetic dyslipidemia, with major and modifier genes. FCH is characterized by premature coronary heart disease (CHD) and different plasma lipid pheno-types among first degree relatives. The prevalence of FCH in the general population is 1 – 2% and FCH is estimated to cause 10 – 20% of premature CHD [1]. Metabolic disturbances in FCH include overproduction of very low density lipoproteins (VLDL), increased free fatty acid (FFA) fluxes, and insulin resistance (reviewed in [2]). The current concept is that FCH is a complex genetic disorder. In addition to already published ge-netic linkage found in FCH kindred [3,4], we observed suggestive linkage of FCH (presence of disease) with a polymorphic marker (D1S1597) on chromosome 1
(LOD=1.0, [3]). This chromosomal region, 1p36.2, is different from the previously reported locus 1q21-23 [4]. In this region, TNFRSF1B (tumor necrosis factor su-perfamily member 1B) is an important positional candi-date gene for FCH taking into account the role of TNF-a and the TNF-receptors in lipoprotein metabolism and insulin resistance. Moreover, no other plausible candidate genes are present in this region.
Since FCH is a genetic lipid disorder with insulin resistance [3,5,6] and visceral obesity [7], we have fo-cused on the TNF-a/TNF-receptor pathway to test the biological relevance of TNFRSF1B as a potential modifier gene in FCH. Indeed, marker D1S1597 showed significant linkage in sib-pair analysis with plasma concentrations of the soluble product of
TNFRFS1B (i.e. sTNF-R p75), but not sTNF-R p55. Moreover, further analysis revealed significant linkage of FCH with a polymorphic CA repeat in intron 4 of the TNFRSF1Bgene as well [8].
The physiological roles of both receptors for TNF-a, i.e. TNF-R p55 and TNF-R p75, are not yet fully understood. The ligand-binding, extracellular portions
* Corresponding author. Tel.: +31-433-882137; fax: + 31-433-670916.
E-mail address: [email protected] (M.M.J. van Greevenbroek).
of these two receptors are quite similar. The intracellu-lar domains, however, activate different pathways for intracellular signal transduction. It is therefore plausi-ble that the two TNF-receptors have different physio-logical functions in vivo (reviewed in [9]). TNF-R p55 (55 kD, the soluble product ofTNFRSF1A, also known as TNF-R type 1, and located on chromosome 12 band p13) is involved in processes such as inflammation and apoptosis [10]. The in vivo functions of the TNF-R p75 (75 kD, also known as TNF-R type 2, and located on chromosome 1 band p36.2) are less well-defined but include local inflammatory responses [11].
Upon expression on the cell surface, both TNF-re-ceptors can be shed by action of a metalloproteinase resulting in the release of soluble portions of the ligand-binding domains into the circulation [12]. Shedding of TNF-receptors appears to be a relatively specific pro-cess that can be regulated independently for TNF-R p55 or TNF-R p75 [13]. Circulating soluble TNF-recep-tors may have various functions. They may be involved in inactivation of TNF-a, but may also play a role in stabilization of TNF-a. Increased shedding of TNF-R p75 and sTNF-R p55, probably as a response to neu-tralize increasing concentrations of TNF-a, has been associated with a large variety of inflammatory diseases.
Relations between TNF-a and insulin resistance, or between TNF-a and lipoprotein metabolism, are of particular interest in FCH. Obese subjects have elevated plasma levels of sTNF-R and in adipocytes of obese individuals, elevated production of TNF-a has been documented [14]. Also, TNF-a reduces cellular insulin sensitivity [15,16] and a polymorphism in the promoter of the TNF-a gene (-308 G to A) which leads to increased gene transcription and thus to higher TNF-a levels, has been associated with insulin resistance as well [17]. FCH has been associated with insulin resis-tance [5,6] and multiple events in lipoprotein produc-tion and metabolism are under control of insulin. An important characteristic of FCH is overproduction of hepatic apoB containing lipoproteins (VLDL). Insulin is involved in the intracellular assembly of VLDL [18] and also affects the supply of substrate for VLDL synthesis, via regulation of the FFA flux from adipose tissue to the liver [19]. In adipocytes, insulin resistance leads to increased activity of hormone sensitive lipase (HSL) and thus to the higher concentrations of FFA in the circulation [20]. Direct effects of TNF-a on several metabolic processes involved in lipoprotein metabolism have been documented as well. It reduces the amount of lipoprotein lipase (LPL) on the endothelial wall [21] and induces de novo fatty acid synthesis in both adipocytes and hepatocytes [22,23]. TNF-aalso induces manganese super oxide dismutase (MnSOD) [24] and reduces lecitin cholesterol acyl transferase (LCAT) [25], genes located on the chromosomal loci that show
link-age with FCH in our study population [26]. The general thought in the current literature is that increased activ-ity of the TNF-a/TNF-receptor axis leads to insulin resistance and, as a consequence, possibly to lipid ab-normalities. It is the TNF-R p75, rather than TNF-R p55, which is frequently implicated in development of insulin resistance in obesity in man [27,28]. It is not clear whether these effects are caused by paracrine TNF-a effects or may be related to genetic susceptibil-ity, for instance in TNFRSF1B.
Based upon these data, and the linkage of FCH with markers in and nearby theTNFRSF1Bgene, we investi-gated the potential role of TNF-R p75 as a modifier gene contributing to expression of FCH.
2. Methods
2.1. Study population
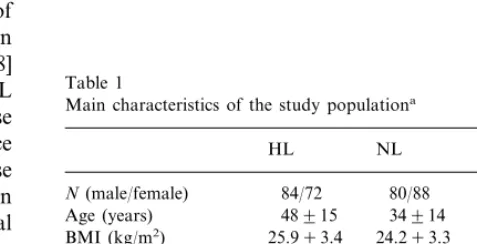
In 462 members of FCH families who had been studied in the framework of genetic studies on hyper-lipidemia [7,29], we have determined plasma concentra-tions of the two soluble receptors for TNF-a, soluble (s)TNF-R p55 and sTNF-R p75. The subjects de-scended from 32 kindred and included hyperlipidemic (HL; n=159) and normolipidemic (NL; n=168) rela-tives as well as their spouses (n=135). The group of HL FCH relatives consisted of the index patients as well as their HL relatives. Characteristics of the present study groups are given in Table 1. Phenotypes mea-sured included fasting plasma concentrations of apolipoprotein (apo) A-I, apo B, apo C-III, cholesterol, low density lipoprotein (LDL)-cholesterol, high density lipoprotein (HDL)-cholesterol, triglycerides (TG), HDL-TG, glucose, free (non-esterified) fatty acids (FFA), glycerol, insulin, as well as waist-to-hip ratio (WHR) and body mass index (BMI) [29].
Table 1
Main characteristics of the study populationa
HL NL Spouse HDL-cholesterol 1.1390.33 1.2590.29
(mmol/l)
0.2790.07
HDL-TG (mmol/l) 0.3390.09 0.3090.08
2.2. Plasma concentrations of sTNF-R p55, sTNF-R p75, and TNF-a
Plasma concentrations of sTNF-R p55 and sTNF-R p75 were determined using sandwich ELISA procedures exactly as published [30]. Soluble receptor concentra-tions may reflect plasma concentraconcentra-tions of TNF-a. We therefore measured plasma TNF-aconcentrations in 80 individuals, i.e. the ten individuals with the highest and with the lowest values of sTNF-R p75, as well as in ten randomly selected individuals from the male and female HL relatives, NL relatives and spouse groups. These preliminary determinations of TNF-aconcentrations in this study group, using an ELISA for TNF-a as de-scribed in [31], did not reveal any difference between sub-populations. Plasma TNF-aconcentrations were in the normal range: the values varied between unde-tectable (n=44, B5 pg/ml) and 50 pg/ml. Two individ-uals had very high TNF-a concentrations (ng/ml range). There were no indications that very high or very low sTNF-Rp75 concentrations coincided with high and low TNF-a concentrations, respectively (data not shown).
2.3. Data analyses
All statistical analyses were performed using the SPSS package version 7.0 (SPSS, Chicago, IL, USA).
2.3.1. Linear regression
We performed backward linear regression for ance in sTNF-R p55 and sTNF-R p75. Plasma vari-ables added in the equation as independent varivari-ables were, apoA-I; apoC-III; glucose; HDL-cholesterol; HDL-TG; log insulin; FFA; glycerol; and sTNF-R p55 or sTNF-R p75 (depending on which of both was the dependent variable). Non-plasma trait variables added were, age; BMI; gender; waist; and WHR. We con-trolled for disease (FCH) status (HL relative, NL rela-tive, or spouse) by including dummy variables in the analyses. We have chosen not to include apoB, choles-terol and TG in the independent variable list since these data are used to define the variable ‘FCH status’. The best equation was selected by using backward elimina-tion analysis (dummy variables were kept in the equa-tion regardless of the significance of theirb).
2.3.2. Conditional logistic regression
A standard logistic regression procedure for FCH could not be used in the analysis of our data, because family relations exist between the subjects in our study population. A conditional logistic regression (Cox’s regression survival analysis) was therefore used to ana-lyze the data. These analyses are non-parametric with respect to time of survival but parametric in terms of the covariates. Cases were stratified for family
descen-Table 2
Uncorrected plasma concentrations of the sTNF-R p55 and sTNF-R p75 (ng/ml) and their ratio in the study populationa
sTNF-R p75 Ratio P75/P55 sTNF-R p55
1.6490.42 1.5690.41b HL relatives 1.0890.31
(n=156)
NL relatives 1.0690.28 1.6890.44 1.6690.51 (n=168)
Spouse 1.0990.41 1.7890.55 1.7890.79 (n=135)
aData are expressed as mean9S.D. bPB0.01 versus spouse group.
dence (family number), survival was 1 for HL relatives (=FCH patients) and 2 for NL relatives and spouses. We have performed conditional logistic regression with HL relatives versus either NL relatives or spouses. Variables that had a significance level B0.2 in univari-ate analyses were entered into a saturunivari-ated model and sequentially eliminated until all remaining variables had a significance level PB0.05.
3. Results
3.1. Study population
In Table 1 the main phenotypic characteristics of the study population are summarized. As expected, TG, apoB and cholesterol were higher, and HDL-cholesterol was lower in HL relatives than in NL relatives and spouses. BMI of HL relatives was slightly higher than that of NL relatives and spouses. The NL group was younger than the HL relatives and spouses.
3.2. STNF-receptors in FCH
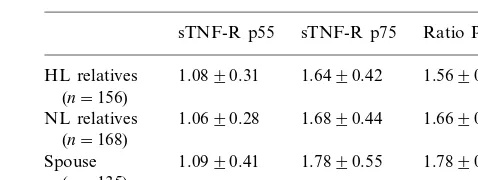
Unadjusted plasma sTNF-R p55 concentrations and sTNF-R p75 concentrations, as well as their ratios are given in Table 2. The ratio of sTNF-R p75/sTNF-R p55 was higher in spouses than in HL relatives (PB
3.3. Contribution of lipid6ariables to6ariation in
plasma concentrations of the sTNF-R
To identify parameters in our set of data that con-tribute to variation in plasma concentrations of sTNF-R p55 and sTNF-sTNF-R p75, linear regression analysis was used. Concentrations of both types of soluble TNF-re-ceptors were positively correlated in plasma (Pearsons correlation coefficient (R)=0.50 in HL relatives, PB
0.001; R=0.40 in NL relatives, PB0.001; and R= 0.63 in spouses,PB0.001). This strong association was
also reflected by the large contribution of these vari-ables to each other in the regression models (Table 3A and B). However, several differences were of interest.
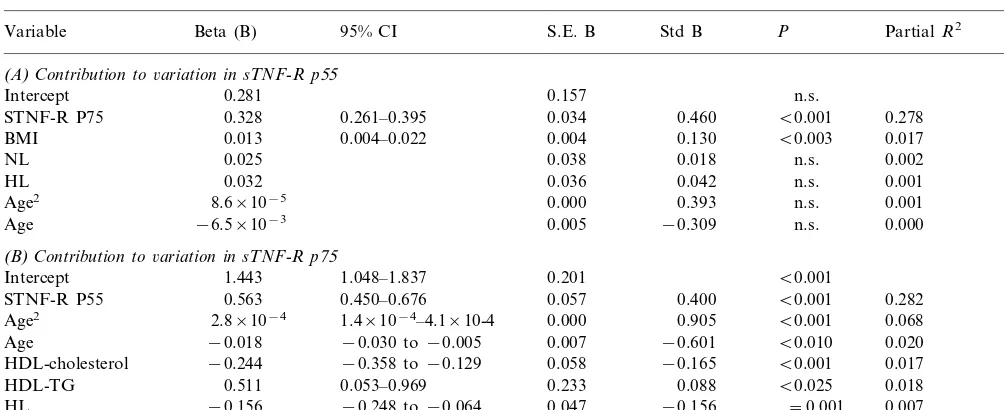
Soluble TNF-R p55 (Table 3A): Of all plasma and non-plasma variables tested, the single additional vari-able (besides the before-mentioned sTNF-R p75) that had a significant contribution to sTNF-R p55 was BMI. The affected FCH status (HL or NL) of the individuals did not contribute to variance of sTNF-R p55.
Soluble TNF-R p75 (Table 3B): Although sTNF-R p55 was indeed the most important contributor to sTNF-R p75, a substantial part (10%) of TNF-R p75 variance was also accounted for by FCH-related vari-ables. Age was a significant positive contributor to variance in sTNF-R p75, as was TG. HDL-cholesterol and HL status on the other hand were significant negative contributors.
3.4. Plasma concentration of sTNF-R p75 as predictors of HL FCH status
With conditional logistic regression analysis we have identified factors that contribute to the hyperlipidemia in our FCH families. We have corrected for the effect of family relations by stratifying the individuals by family identification codes. We have compared HL and NL relatives (Table 4A), as well as HL relatives and spouses (Table 4B). The negative estimated coefficient for sTNF-R p75 (Table 4B) reveals that the risk of being a HL subject increased significantly with decreas-ing sTNF-R p75 levels (P=0.01). The odds ratio of 0.66 for sTNF-R p75 means that a 1 ng/ml lower plasma concentration of sTNF-R p75 gives a 1.54 times higher risk of being HL FCH relative. Conversely, a higher sTNF-R p75 confers a lower risk on expressing FCH. Log TG, non-HDL-cholesterol and sTNF-R p75 plasma concentrations were the independent variables that predicted the FCH affected status versus spouses. Notably, log TG was the most powerful discriminating variable, followed by non-HDL-cholesterol, to identify affected FCH individuals relative to their unaffected relatives (odds ratio=4.3, Table 4A), or spouses (odds ratio=3.3, Table 4B).
4. Discussion
In the present study, we have focused on the poten-tial role ofTNFRSF1Bin the development of hyperlipi-demia in FCH. Our data show that HL FCH relatives had lower plasma sTNF-R p75 concentrations than NL relatives and spouses. Moreover, the conditional logis-tic regression analysis confirmed that a low plasma sTNF-R p75 level increased the risk of expressing FCH. When the FCH diagnostic variables
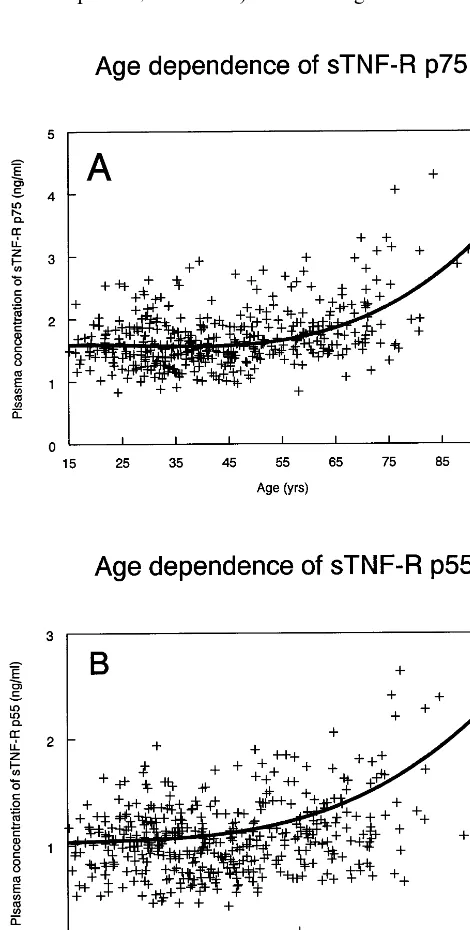
(non-HDL-Fig. 1. Age dependency of plasma sTNF-R p75 concentrations in the whole study group was best fitted with the cubic model f(x)=
1.476+0.0149X−6×10−4X2+7.1×10−6X3 (PB0.0001, panel A). Age dependency of plasma sTNF-R p55 concentrations in the whole study group was best fitted by the cubic modelf(x)=0.9833+
Table 3
Contributors to variations in plasma concentrations of sTNF-R p55 and sTNF-R p75a
Variable Beta (B) 95% CI S.E. B Std B P PartialR2 R2
(A)Contribution to6ariation in sTNF-R p55
Intercept 0.281 0.157 n.s. 0.299
0.261–0.395 0.034 0.460
0.328 B0.001
STNF-R P75 0.278
0.013
BMI 0.004–0.022 0.004 0.130 B0.003 0.017
0.038 0.018 n.s. 0.002
STNF-R P55 0.563 B0.001 0.282
1.4×10⁻⁴–4.1×10⁻⁴ 0.000 0.905
HDL-TG 0.511 B0.025 0.018
−0.248 to−0.064 0.047 −0.156
−0.156 =0.001
HL 0.007
2.7×10⁻²
NL 0.050 0.540 n.s. 0.000
aResults of a backward stepwise regression analysis with sTNF-R p55 (panel A) or sTNF-R p75 (panel B) as dependent variables. Variables included in the saturated model were, apoA-I, apoC-III, glucose, HDL-cholesterol, HDL-TG, log insulin, FFA, glycerol, and sTNF-R p55 or sTNF-R p75 (depending on which was the dependent variable), age, BMI, gender, waist, and WHR. Affected FCH status (HL relative, NL relative, or spouse) was included as dummy variable. Dummy variables and age were kept in the equation at all times. Those variables that accounted for a significant variation in the dependent variable (italic) and the dummy variables are shown. Confidence intervals (CI) of the significant coefficients (PB0.05) are indicated. B, unstandardized regression coefficient (b); S.E. B, standard error of B; std B, standardized B; n.s., not significant; 95% CI, 95% confidence interval.
cholesterol, log TG and apoB) were included in the list of variables, sTNF-R p75 concentration was the only additional variable (i.e. additional to non-HDL-choles-terol and log TG) that significantly contributed to accurate prediction.
In linear regression analysis, HDL-cholesterol was negatively associated with sTNF-R p75 (Table 3B). This result was unexpected, since low concentrations of HDL-cholesterol are a common characteristic of FCH and, therefore, one may expect the relation between sTNF-R p75 and HDL-cholesterol to be positive rather than negative. However, separate analysis of the three groups (NL, HL, spouse) revealed that sTNF-R p75 is significantly with correlated with HDL-cholesterol in the control group (spouses,r= −0.340PB0.0001) but not in HL and NL. Our data probably reflect the fact thatTNFRSF1B is a minor gene in FCH and will play a role in only part of the FCH population. In those individuals in whichTNFRSF1Bis involved, the sTNF-R p75 concentrations will be low, and the correlation between HDL-cholesterol and sTNF-R p75 can very well be absent or even positive. This effect may be masked in the regression analysis by the negative corre-lation in the rest of the subjects. Additionally, our finding that HDL-cholesterol was negatively, whereas HDL-TG was positively associated with sTNF-R p75, suggests that not only the concentration, but also the composition of HDL particles may contribute to varia-tion in the plasma sTNF-R p75 concentravaria-tions. One
mechanism controlling these HDL parameters may be hypertriglyceridemia. Other mechanisms may be associ-ated with the insulin resistant state.
The present consensus on the role of TNF-a in insulin sensitivity and vascular disease is that an in-creased activity of the TNF-a/TNF-R pathway, either via increased availability of biologically active TNF-a or via increased receptor activity, leads to accelerated development of insulin resistance by a paracrine mecha-nism [32] and progression of atherosclerotic lesions. The two different statistical approaches that we used to analyze our present data (i.e. linear regression analysis and conditional logistic analysis) indicate that expres-sion of disease in FCH is associated with lower plasma levels of sTNF-R p75. This association of FCH with low plasma sTNF-R p75 concentrations was initially a surprising finding. The rationale behind the present study, however, was suggestive linkage between FCH and the gene for TNFRSF1B. The present approach therefore focused on responsiveness of FCH patients to TNF-a through its receptor (TNF-R p75), and not on production of this cytokine.
Soluble receptors may function as scavengers for free TNF-a in plasma or, alternatively, may be involved in maintaining a plasma pool of TNF-afor rapid TNF-a response following a trigger. Pellegrini et al. [33] have shown that decreased shedding of TNF-R p75 may be more related to the development of disease than ele-vated secretion of TNF-a. Shedding of the receptor correlated in their study with disease severity, implying that the response of cells to TNF-a was regulated by the number of remaining functional receptors on the cell surface; this number will be greater if shedding is reduced.
It is likely that efficiency of receptor shedding can be affected by intrinsic properties of the receptor. For instance, functional DNA polymorphisms leading to changes in the cleavage site of a TNF-areceptor could result in biologic variation in receptor shedding. Re-duced shedding can affect (e.g. increase) the actual number of functional receptors that will remain on the cell surface, and thus affect the response of the cell to TNF-a. Physiological consequences of reduced shed-ding are relatively low plasma concentrations of sTNF-R p75, as seen in FCH relatives, with on the other hand relatively high levels of unshed, functionally intact TNF-R p75 remaining on the cell surface, providing a potentially greater responsiveness to TNF-a at physio-logical levels. Hypersensivity to TNF-a could lead to reduced insulin sensitivity [15,27,28,34], increased lipol-ysis in adipocytes [20] and increased FFA levels [20]. Such a mechanism provides a good explanation for the present data.
Alternatively, low plasma concentrations of sTNF-R p75 in FCH can be explained by mutations in the intracellular part of the receptor that cause moderate increases in signaling activity of the receptor. Cells would then be hyperresponsive to circulating TNF-a, even at physiological levels. Hypersensitivity can be counteracted by the cells via down-regulation of
TNFRSF1Bexpression. If such a regulatory mechanism would be inadequate than the result would include a lower than normal expression of TNF-R p75 on the cell surface and therefore lower levels of shed sTNF-R p75, but still a higher than normal responsiveness of the cells to circulating TNF-a, through the hyperactive TNF-R p75 on the cells.
One ‘genetic mechanism’ that can lead to reduced shedding of TNF-R p75 is a mutation in or nearby the site of the receptor where cleavage by the metallo-protease occurs. This possibility is currently under in-vestigation in our laboratory. We have started these investigations with a mutation screening of exon 6
TNFRSF1B in a subgroup of our original study popu-lation (n=131). Exon 6 contains (part of) the receptor protein domain that is cleaved by the metalloprotease, yielding soluble TNF-R p75 [35]. Two polymorphisms were identified in TNFRSF1B exon 6. One common polymorphism (T to G; Met196 to Asp) is present in 45% of all analyzed subjects. This polymorphism ap-parently underlies the conflicting data on the published
TNFRSF1Bsequence [36,37]. One novel, rare polymor-phism was also identified (G to A; Glu232 to Lys, present in 5% of all subjects). Preliminary analyses did not reveal differences in frequency distribution of the mutated alleles between HL relatives, NL relatives, and spouses in this sub-population. These preliminary data on variations in exon 6 of TNFRSF1B do not directly support the possibility that receptor shedding is the predominant mechanism in FCH. However, to fully understand the contribution of TNFRSF1B to the ex-pression of FCH, we need to complete the mutation screening of this gene and also perform association analyses. These approaches are currently undertaken in our laboratory.
In summary, we propose thatTNFRSF1Bis actively involved in expression of FCH as a modifier gene. The underlying mechanism that is involved has not yet been
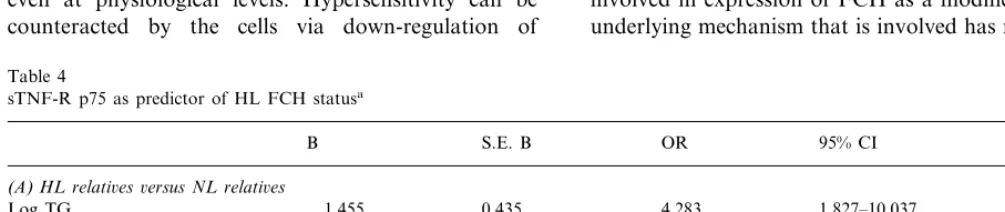
Table 4
sTNF-R p75 as predictor of HL FCH statusa
95% CI
B S.E. B OR P
(A)HL relati6es6ersus NL relati6es
Log TG 1.455 0.435 4.283 1.827–10.037 B0.001
0.072
0.297 1.346 1.170–1.549 B0.001
Non-HDL-cholesterol
(B)HL relati6es6ersus spouses
1.210
Log TG 0.416 3.352 1.483–7.579 B0.005
1.204
Non-HDL-cholesterol 0.186 0.068 1.053–1.377 B0.01
−0.413
sTNF-R p75 0.161 0.662 0.483–0.907 =0.01
elucidated, but it leads to a FCH phenotype with low levels of sTNF-R p75 protein and, possibly, hyperre-sponsiveness to TNF-a. We hypothesize that functional mutations in TNFRSF1B contribute to the phenotype of low plasma sTNF-R p75 concentrations and con-comitant alterations in the cell-surface concentration of this TNF-a receptor. This would result in increased sensitivity of the TNF-a/TNF-R p75 pathway and makes FCH patients hyperresponders to TNF-a in the circulation. Hyperresponsiveness to TNF-a can partly explain why FCH patients are extremely sensitive to moderate increases in their fat mass (which synthesizes TNF-a[14]) and are prone to develop insulin resistance even when only mildly obese. Implication of the TNF-a/TNF-R p75 pathway in the expression of FCH may have potential diagnostic and therapeutic implications.
Acknowledgements
The authors thank Petra Koken, statistician, for helpful advice for statistical analyses. T de B receives grant support from the Dutch Organization for Scien-tific Research (NWO 900-95-297, PIONIER grant).
References
[1] Genest JJJ, Martin MS, McNamara JR, Ordovas JM, Jenner J, Myers RH, Silberman SR, Wilson PW, Salem DN, Schaefer EJ. Familial lipoprotein disorders in patients with premature coro-nary artery disease. Circulation 1992;85:2025.
[2] de Bruin TWA. Lipid metabolism. Curr Opin Lipidol 1998;9:275.
[3] Aouizerat BE, Allayee H, Cantor RM, Davis RC, Lanning CD, Wen PZ, Dallinga TG, de BT, Rotter JI, Lusis AJ. A genome scan for familial combined hyperlipidemia reveals evidence of linkage with a locus on chromosome 11. Am J Hum Genet 1999;65:397.
[4] Pajukanta P, Terwilliger JD, Perola M, Hiekkalinna T, Nuotio I, Ellonen P, Parkkonen M, Hartiala J, Ylitalo K, Pihlajamaki J, Porkka K, Laakso M, Viikari J, Ehnholm C, Taskinen MR, Peltonen L. Genomewide scan for familial combined hyperlipi-demia genes in Finnish families, suggesting multiple susceptibil-ity loci influencing triglyceride, cholesterol, and apolipoprotein B levels. Am J Hum Genet 1999;64:1453.
[5] Castro Cabezas M, de Bruin TWA, De Valk HW, Shoulders CC, Erkelens DW. Impaired fatty acid metabolism in familial com-bined hyperlipidemia. A mechanism associating hepatic apolipo-protein B overproduction and insulin resistance. J Clin Invest 1993;92:160.
[6] Aitman TJ, Godsland IF, Farren B, Crook D, Wong HJ, Scott J. Defects of insulin action on fatty acid and carbohydrate metabolism in familial combined hyperlipidemia. Arterioscler Thromb Vasc Biol 1997;17:748.
[7] Dallinga-Thie GM, Bu XD, Trip MV, Rotter JI, Lusis AJ, de Bruin TWA. Apolipoprotein A-I/C-III/A-IV gene cluster in fa-milial combined hyperlipidemia: effects on LDL-cholesterol and apolipoproteins B and C-III. J Lipid Res 1996;37:136. [8] Geurts JMW, van der Kallen CJH, van Greevenbroek MMJ, Bu
X-D, Cantor RM, Aouizerat BE, Allayee H, Janssen RGJH,
Rotter JI, de Bruin TWA. Identification of TNFRSF1B as a novel mediator of insulin resistance traits in familial combined hyperlipidemia. Submitted for publication, 1999.
[9] Warzocha K, Salles G. The tumor necrosis factor signaling complex: choosing a path toward cell death or cell proliferation. Leuk Lymphoma 1998;29:81.
[10] Haridas V, Darnay BG, Natarajan K, Heller R, Aggarwal BB. Overexpression of the p80 TNF receptor leads to TNF-depen-dent apoptosis, nuclear factor-kB activation, and c-Jun kinase activation. J Immunol 1998;160:3152.
[11] Grell M, Douni E, Wajant H, Lohden M, Clauss M, Maxeiner B, Georgopoulos S, Lesslauer W, Kollias G, Pfizenmaier K. The transmembrane form of tumor necrosis factor is the prime activating ligand of the 80 kDa tumor necrosis factor receptor. Cell 1995;83:793.
[12] Gallea RS, Morand V, Millet S, Bruneau JM, Bhatnagar N, Chouaib S, Roman RS. A metalloproteinase inhibitor blocks the shedding of soluble cytokine receptors and processing of transmembrane cytokine precursors in human monocytic cells. Cytokine 1997;9:340.
[13] Liebmann PM, Reibnegger G, Lehofer M, Moser M, Purstner P, Mangge H, Schauenstein K. Circadian rhythm of the soluble p75 tumor necrosis factor (sTNF-R75) receptor in humans — a possible explanation for the circadian kinetics of TNR-aeffects. Int Immunol 1998;10:1393.
[14] Dandona P, Weinstock R, Thusu K, Abdel RE, Aljada A, Wadden T. Tumor necrosis factor-ain sera of obese patients: fall with weight loss. J Clin Endocrinol Metab 1998;83:2907. [15] Paz K, Hemi R, LeRoith D, Karasik A, Elhanany E, Kanety H,
Zick Y. A molecular basis for insulin resistance. Elevated serine/
threonine phosphorylation of IRS-1 and IRS-2 inhibits their binding to the juxtamembrane region of the insulin receptor and impairs their ability to undergo insulin-induced tyrosine phos-phorylation. J Biol Chem 1997;272:29911.
[16] Hotamisligil GS, Budavari A, Murray D, Spiegelman BM. Re-duced tyrosine kinase activity of the insulin receptor in obesity-diabetes. Central role of tumor necrosis factor-a. J Clin Invest 1994;94:1543.
[17] Fernandez-Real JM, Gutierrez C, Ricart W, Casamitjana R, Fernandez-Castaner M, Vendrell J, Richart C, Soler J. The TNF-a gene Nco I polymorphism influences the relationship among insulin resistance, percent body fat, and increased serum leptin levels. Diabetes 1997;46:1468.
[18] Sparks JD, Sparks CE. Insulin regulation of triacylglycerol-rich lipoprotein synthesis and secretion. Biochim Biophys Acta 1994;1215:9.
[19] Reynisdottir S, Eriksson M, Angelin B, Arner P. Impaired activation of adipocyte lipolysis in familial combined hyperlipi-demia. J Clin Invest 1995;95:2161.
[20] Sztalryd C, Kraemer FB. Regulation of hormone-sensitive lipase in streptozotocin-induced diabetic rats. Metabolism 1995;44:1391.
[21] Hauner H, Petruschke T, Russ M, Rohrig K, Eckel J. Effects of tumour necrosis factora(TNFa) on glucose transport and lipid metabolism of newly-differentiated human fat cells in cell cul-ture. Diabetologia 1995;38:764.
[22] Lopez SJ, Argiles JM, Lopez SF. Metabolic effects of tumour necrosis factor-aon rat brown adipose tissue. Mol Cell Biochem 1995;143:113.
[25] Ly H, Francone OL, Fielding CJ, Shigenaga JK, Moser AH, Grunfeld C, Feingold KR. Endotoxin and TNF lead to reduced plasma LCAT activity and decreased hepatic LCAT mRNA levels in Syrian hamsters. J Lipid Res 1995;36:1254.
[26] Aouizerat BE, Allayee H, Cantor RM, Dallinga-Thie RM, Lan-ning CD, de Bruin TWA, Lusis AJ, Rotter JI. Linkage of a candidate gene locus to familial combined hyperlipidemia – lecithin: cholesterol acyltransferase on 16q. Arterioscler Thromb Vasc Biol 1999;19:2730 – 36.
[27] Liu LS, Spelleken M, Rohrig K, Hauner H, Eckel J. Tumor necrosis factor-a acutely inhibits insulin signaling in human adipocytes: implication of the p80 tumor necrosis factor recep-tor. Diabetes 1998;47:515.
[28] Hotamisligil GS, Arner P, Atkinson RL, Spiegelman BM. Dif-ferential regulation of the p80 tumor necrosis factor receptor in human obesity and insulin resistance. Diabetes 1997;46:451. [29] Dallinga-Thie GM, Trip MV, Rotter JI, Cantor RM, Bu XD,
Lusis AJ, de Bruin TWA. Complex genetic contribution of the apo AI-CIII-AIV gene cluster to familial combined hyperlipi-demia — identification of different susceptibility haplotypes. J Clin Invest 1997;99:953.
[30] Froon AH, Bemelmans MH, Greve JW, van-der LC, Buurman WA. Increased plasma concentrations of soluble tumor necrosis factor receptors in sepsis syndrome: correlation with plasma creatinine values. Crit Care Med 1994;22:803.
[31] Engelberts I, Moller A, Schoen GJ, van-der LC, Buurman WA. Evaluation of measurement of human TNF in plasma by ELISA. Lymphokine Cytokine Res 1991;10:69.
[32] Hotamisligil GS. Mechanisms of TNF-a-induced insulin resis-tance (see comments). Exp Clin Endocrinol Diabetes 1999;107:119.
[33] Pellegrini JD, Puyana JC, Lapchak PH, Kodys K, Miller GC. A membrane TNF-a/TNFR ratio correlates to MODS score and mortality. Shock 1996;6:389.
[34] Hotamisligil GS, Budavari A, Murray D, Spiegelman BM. Re-duced tyrosine kinase activity of the insulin receptor in obesity-diabetes. Central role of tumor necrosis factor-a. J Clin Invest 1994;94:1543.
[35] Herman C, Chernajovsky Y. Mutation of proline 211 reduces shedding of the human p75 TNF receptor. J Immunol 1998;160:2478.
[36] Beltinger CP, White PS, Maris JM, Sulman EP, Jensen SJ, LePaslier D, Stallard BJ, Goeddel DV, de SF, Brodeur GM. Physical mapping and genomic structure of the human TNFR2 gene. Genomics 1996;35:94.
[37] Smith CA, Davis T, Anderson D, Solam L, Beckmann MP, Jerzy R, Dower SK, Cosman D, Goodwin RG. A receptor for tumor necrosis factor defines an unusual family of cellular and viral proteins. Science 1990;248:1019.