Fractional Vegetation Cover Estimation In Urban Environments
H. salimi kouchia, *, M. R. Sahebib, A. A. Abkarb, M. J. Valadan Zoejc
a MSc. Student of Civil-Remote Sensing, Geodesy and Geomatics Engineering of faculty, Khaje Nasir university of technology
b Assis. Prof. Group of Photogrammetry and Remote Sensing, Geodesy and Geomatics Engineering of faculty, Khaje Nasir university of technology
c Assoc. Prof. Group of Photogrammetry and Remote Sensing, Geodesy and Geomatics Engineering of faculty, Khaje Nasir university of technology
KEY WORDS: vegetation cover, vegetation indices, urban environment, regression, neural network
ABSTRACT:
Quality of life in urban environments is closely related to vegetation cover. The Urban growth and its related environmental problems, planners are forced to implement policies to improve the quality of urban environment. Thus, vegetation mapping for planning and managing urban is critical.Given the spectral complexity of the urban environment and the sparse vegetation in these areas, to generate a reliable map of coverage Vegetation in these areas requires the use of high spatial resolution images. But given the size of cities and the rapid changes in vegetation status, Mapping of vegetation using these images will have cost much. In this study, using a moderate spatial resolution image with the help of a small part of high spatial resolution image vegetation cover in a Metropolitan area is obtained. We make use of Ikonos image to get Fractional vegetation cover (FVC) and used as a vicarious validation of FVC. Then using linear and nonlinear regression and neural network between the FVC derived from the Ikonos image and vegetation indices on Landsat image, the relationship was established. A number of pixels were randomly selected from the images for the model validation. The results show that the neural network, nonlinear regression and linear regression models are more accurate for the estimation of FVC respectively.
1. INTRODUCTION
FVC is generally defined as the ratio of the vertical projection area of vegetation (including leaves, stalks, and branches) on the ground to the total vegetation area. FVC is an important biophysical parameter for simulating the exchange between the land surface and the atmospheric boundary level using the soil-vegetation-atmosphere transfer model (Liang et al., 2012). Field measurement and remote sensing retrieval are two approaches used to obtain FVC accurate values. Field measurement, as a traditional method of vegetation fraction, can be divided into three kinds of methods according to principles: field sample method, instrument method and visual estimation method (Liang et al., 2008).
Traditional field measurement method to get the big area vegetation fraction is very difficult due to the costs, labor and time involved. Furthermore, the reliability of some field measurement methods for the vegetation fractional coverage is questionable (Curran and Williamson, 1986). Thus, traditional method is not feasible in big area estimation of FVC. In order to get regional-scale estimation of vegetation fraction, we can utilize remote sensing data. Satellite data provides a spatially and periodic, comprehensive view of land vegetation cover (Chen et al., 2001). However, most remote sensing data are too coarse for the direct measurement of FVC (Xiao and Moody, 2005).
Traditional land-use/land-cover (LULC) classification, which assigns each pixel to one and only one LULC type, assumes that the spatial extent of LULC components must be larger than the pixel size. Due to the complexity of urban landscape structure,
the assumption that each pixel is composed of one and only one LULC type is often not valid for most remotely sensed data. (Song, 2005). But despite the clear advantages of contemporary high resolution images, the benefits ofmedium resolution data should not be discarded (Voorde, 2008).
But given the size of cities and the rapid changes in vegetation status, Mapping of vegetation using high resolution images will have cost much.
The commonly used remote-sensing methods of FVC retrieval are mainly divided into two categories: Regression model methods and pixel decomposition model methods. Regression models are constructed through the regression of remote sensing data collected using a specific wave band, several wave bands, or remotely sensed vegetation index (VI) to measure FVC. The unmixing model is based on the principle that each pixel in an image is composed of several components, and each pixel contributes separately to the information observed by remote sensors (Liang et al., 2012).
Xiao and Moody, through the linear regression of 60 points selected from a Landsat ETM NDVI image and FVC (considered as the actual surface FVC), extracted a high-resolution (0.3 m) true-color orthoimage and found a strong linear relationshipbetween NDVI and FVC.They then applied this formula to estimate the FVC of all of the pixels in the Landsat ETM image (Xiao and Moody, 2005).
Choudhury et al. found that FVC wasrelated to scaled NDVI in a quadratic manner.Based on this finding, the authors estimated theFVC of a coniferous forest in the U.S. Pacific Northwest. The results indicated that althoughNDVI is the most commonly applied method,it did not have the strongest correlation with the FVC of trees (Choudhury et al., 1994).
International Archives of the Photogrammetry, Remote Sensing and Spatial Information Sciences, Volume XL-1/W3, 2013 SMPR 2013, 5 – 8 October 2013, Tehran, Iran
Figure 1. Images. (a) Ikonos image (R/G/B)=(1/2/3); (b) Landsat image (R/G/B)=(3/2/1).
2. MATERIALS
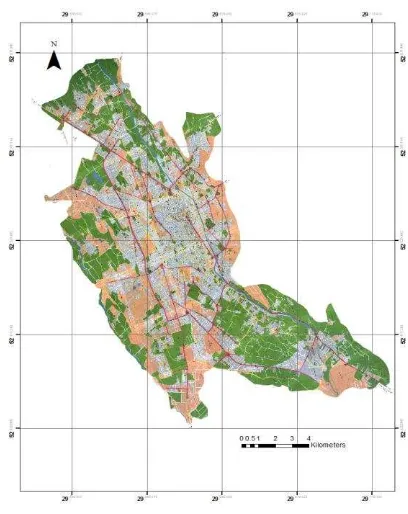
2.1 STUDY AREA
The focus of our study was the Shiraz city, located in Iran. Capita green space in Shiraz on 2008 Has been 12/7 m2for per person. The map of Shiraz city illustrated in Figure 1.
Figure 2. Study area
2.2 Data
In this study we derive moderate resolution estimates of aggregate vegetation fraction from Landsat imagery and quantify the correspondence between these estimates and integrated vegetation fraction measurements derived from high resolution Ikonos imagery (Figure 1.).
cloud-free Landsat ETM+ image (Path 163, Row 39) acquired on January 19, 2001 and a Ikonos image of the area with a bit of time difference it was prepared. Ikonos image was acquired on February 12, 2002.
3. MODEL
Among the various linear unmixing models, the simplest assumes that each pixel is composed of only two components, that is, vegetation and nonvegetation, and that the spectral information results from linear mixing of the two components. The proportional area of each component in the pixel is the weight of each component (Liang et al., 2012). The proportional area of vegetation is the FVC of the pixel, as mathematically expressed using Formulas (1) and (2):
NDVIs FVC)
-(1 + NDVIv FVC
=
NDVI (1)
NDVIs)
-(NDVIv
NDVIs)
-(NDVI
FVC
(2)NDVI is the NDVI of the mixed pixel, NDVIv is the NDVI of the vegetation and NDVIs is the NDVI of bare soil. To obtain the FVC of mixed pixels, the NDVIs of vegetation and of bare soil should be determined. This model known as the pixel dichotomy model.
However, the determination of NDVIv and NDVIs is affected by many factors, such as soil, vegetation type, and chlorophyll content. Nevertheless, these parameters can be determined through statistical analysis of spatial and temporal NDVI data (Liang et al., 2012). Time-series NDVI data are analyzed statistically, and the maximum time-series NDVI is used as the NDVI of vegetation, whereas the minimum time-series NDVI is used as the NDVI of bare soil (Zeng et al., 2000). Some researchers directly select the maximum and minimum NDVIs of the research area as the NDVI values for vegetation and bare soil, respectively (Xiao and Moody, 2005). As the model requires pixels representing pure vegetation and bare soil, low-resolution remote-sensing data are not applicable. For many regions, pixels representing pure vegetation are difficult to obtain in low-resolution data (Liang et al., 2012).
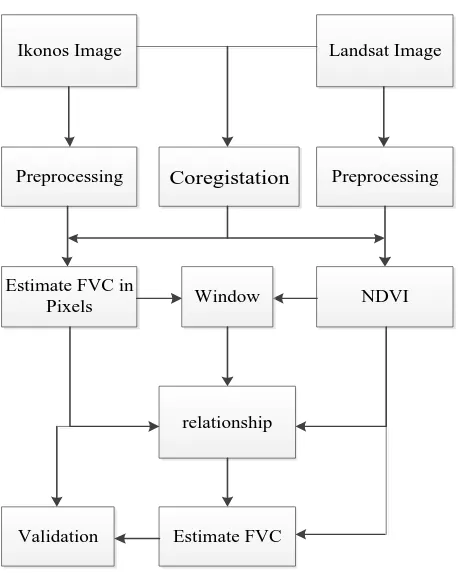
4. METHODOLOGY
The flowchart for the vegetation fraction is illustrated in Figure 3.
a b
International Archives of the Photogrammetry, Remote Sensing and Spatial Information Sciences, Volume XL-1/W3, 2013 SMPR 2013, 5 – 8 October 2013, Tehran, Iran
4.1 Data processing
Raw images record the Digital number (DN). In order to get accurate normalized difference vegetation index (NDVI), we should transform DN value to reflectivity. So the spectral measurements of Ikonos and landsat are converted to at-satellite reflectance.
Ikonos image was georeferenced beforehand. The Landsat ETM+ image was coregistred with Ikonos image using Twenty-four control points. The geometric correction was performed using a two-order transformation and a root-mean-squared error (RMSE) for six checkpoints is 0.29 landsat pixel.
4.2 vegetation fraction estimation from Ikonos
As it was said pixel dichotomy model need to pixels representing pure vegetation and difficult to obtain this pixels in low-resolution data so in this study this model applied to FVC estimation for Ikonos image and select the maximum and minimum NDVIs of the study area as the NDVI values for vegetation and bare soil, respectively.
we using this model to estimate the FVC of number of the pixels in the Ikonos image. The estimated FVC at this stage used as vicarious validation of the truth.
4.3 window
NDVI value for each window obtained from the mean values of NDVI for four pixels Landsat image and FVC value for
each window obtained from the mean values of FVC for 225 pixels Ikonos image.
4.4 realationship
4.4.1 regression
Several regression methods can be used to determine the relationship between the FVC and the NDVI value. The simplest approach is to use linear and nonlinear models and a leastsquares fitting algorithm (Jiapaer et al., 2011).
we used polynomial regression to model the relationship between the actual FVC and the NDVI for the sampled pixels. The model was then used to estimate vegetation fractions for all pixels across the image. The general form of the linear and second-order polynomial regression used is as follows:
A neural network is an intelligent computer based technology that imitates the learning process of human brains and serves as a general computing tool in solving complex problems. A neural network is composed of a series of simple processing units connected by weighting coefficients determined by specific mechanisms. A neural network can be used to retrieve various features of vegetation from remote-sensing data. In this study also used neural network to establish relation between NDVI and FVC.
4.5 Estimate FVC
the next step using relationship established between the FVC and NDVI for training window with used regression model and neural network, FVC values for validation sample estimated. In this study For training model used 500 samples and 450 samples were randomly selected from the images for model validation. These samples were spatially independent from those samples used as the training data for the development of relationship.
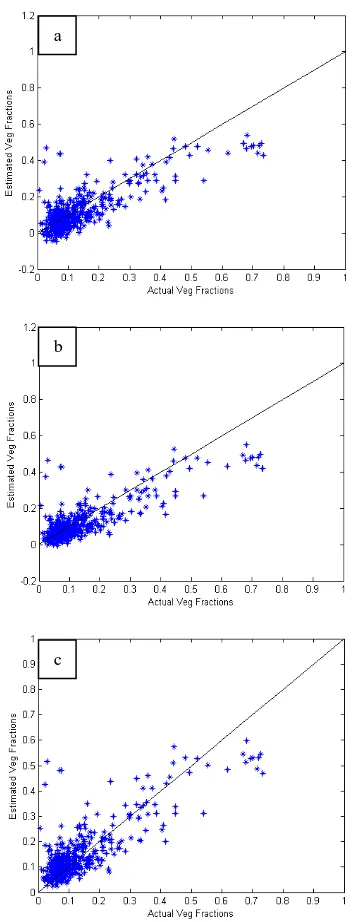
5. RESULTS AND DISCUSSION
Scattering plot between actual FVC and predicted FVC using the models used in this paper are showed (Figure 4.). Coefficients of determination (R2) and overall RMSE were both used to assess the accuracy of each method. The result of accuracy analysis is listed in Table 1.
Table 1. R2 and RMSE values between actual vegetation fraction and vegetation fraction predicted from each method
Reg 1 Reg 2 NN
Figure 3. Flowchart for vegetation fraction estimation
International Archives of the Photogrammetry, Remote Sensing and Spatial Information Sciences, Volume XL-1/W3, 2013 SMPR 2013, 5 – 8 October 2013, Tehran, Iran
Figure 4. Relationship between actual and estimated fractional vegetation cover ( FVC): (a) linear regression; (b)
second-order polynomial regression; (c) neural network
The results show that neural network and second-order polynomial regression results are close together. But the results of this two methods is better than linear regression. As is clear from the (Figure 4.) both regression methods for some samples has been estimated negative FVC values but using neural network the problem is not there.
6. CONCLUSION
In this study we use a moderate spatial resolution image with the help of a small part of high spatial resolution image FVC in urban area estimated. Using this method can estimate FVC for a large area with low cost. Because need to use the Small part of the high resolution image for urban areas and most moderate resolution images is free discretion users. The
results show that neural networks can help in the estimation of FVC.
7. REFERENCES
Chen, J., Chen, Y.-h., He, C.-y., Shi, P.-j., 2001. Sub-pixel model for vegetation fraction estimation based on land cover classification. JOURNAL OF REMOTE SENSING-BEIJING- 5, 422-426.
Choudhury, B.J., Ahmed, N.U., Idso, S.B., Reginato, R.J., Daughtry, C.S.T., 1994. Relations between evaporation coefficients and vegetation indices studied by model simulations. Remote Sensing of Environment 50, 1-17. Curran, P., Williamson, H., 1986. Sample size for ground and remotely sensed data. Remote Sensing of Environment 20, 31-41.
Jiapaer, G., Chen, X., Bao, A., 2011. A comparison of methods for estimating fractional vegetation cover in arid regions. Agricultural and Forest Meteorology 151, 1698-1710.
Liang, S., Li, X., Wang, J., 2012. Advanced remote sensing: terrestrial information extraction and applications. Academic Press.
Liang, Z., Bing-fang, W., Yue-min, Z., Ji-hua, M., Ning, Z., 2008. A study of fast estimation of vegetation fraction in Three Gorges emigration area by using SPOT5 imagery. The International Archives of the Photogrammetry, Remote Sensing and Spatial Information Sciences 37, 987-992. Song, C., 2005. Spectral mixture analysis for subpixel vegetation fractions in the urban environment: How to incorporate endmember variability? Remote Sensing of Environment 95, 248-263.
Voorde, T.V.D., Vlaeminck, J., & Canters, F., 2008. Comparing different approaches for mapping urbanvegetation cover from Landsat ETM þ Data: A Case Study on Brussels. Sensors 8, 3880- 3902.
Xiao, J., Moody, A., 2005. A comparison of methods for estimating fractional green vegetation cover within a desert-to-upland transition zone in central New Mexico, USA. Remote Sensing of Environment 98, 237-250.
Zeng, X., Dickinson, R.E., Walker, A., Shaikh, M., DeFries, R.S., Qi, J., 2000. Derivation and evaluation of global 1-km fractional vegetation cover data for land modeling. Journal of Applied Meteorology 39, 826-839.
a
b
c
International Archives of the Photogrammetry, Remote Sensing and Spatial Information Sciences, Volume XL-1/W3, 2013 SMPR 2013, 5 – 8 October 2013, Tehran, Iran