CLASSIFIER FUSION OF HYPERSPECTRAL AND LIDAR REMOTE SENSING DATA
FOR IMPROVEMENT OF LAND COVER CLASSIFCATION
B. Bigdeli a, *, F. Samadzadegan a, P. Reinartz b
a Dept. of Photogrammetry, Faculty of Engineering, University of Tehran, North Kargar Street, Tehran, Iran- (bigdeli, [email protected])
b Dept. of Photogrammetry and Image Analysis, Remote Sensing Technology Institute, German Aerospace Centre (DLR), Oberpfaffenhofen P.O Box 1116, D-82230 Weßling, Germany- [email protected] ,
KEY WORDS: Hyperspectral data, LIDAR data, Classification, Classifier fusion
ABSTRACT:
The interest in the joint use of remote sensing data from multiple sensors has been remarkably increased for classification applications. This is because a combined use is supposed to improve the results of classification tasks compared to single-data use. This paper addressed using of combination of hyperspectral and Light Detection And Ranging (LIDAR) data in classification field. This paper presents a new method based on the definition of a Multiple Classifier System on Hyperspectral and LIDAR data. In the first step, the proposed method applied some feature extraction strategies on LIDAR data to produce more information in this data set. After that in second step, Support Vector Machine (SVM) applied as a supervised classification strategy on LIDAR data and hyperspectal data separately. In third and final step of proposed method, a classifier fusion method used to fuse the classification results on hypersepctral and LIDAR data. For comparative purposes, results of classifier fusion compared to the results of single SVM classifiers on Hyperspectral and LIDAR data. Finally, the results obtained by the proposed classifier fusion system approach leads to higher classification accuracies compared to the single classifiers on hyperspectral and LIDAR data.
* Corresponding author
1. INTRODUCTION
Data and sensor fusion methods emerged as a powerful methodology for improving the classification performance. Based on the existing different airborne and spaceborne remote sensing sensors, a wide spectrum of data can be available for the same observed site. For many applications the information provided by individual sensors are incomplete, inconsistent, or imprecise. Multiple sensors may provide complementary data, and fusion of information of different sensors can produce a better understanding of the observed site, which is not possible with single sensor (Simone et al, 2002; Pohl et al, 1998, Du et al, 2013).
Fusion on remote sensing data can be performed at the signal, pixel, feature and decision level. In signal level fusion, signals from different sensors are combined to create a new signal with a better signal-to-noise ratio than the original signals. Pixel level fusion consists of merging information from different images on a pixel-by-pixel basis to improve the performance of image processing tasks such as segmentation. Feature level fusion consists of merging features extracted from different images. In feature level fusion, features are extracted from multiple sensor observations, then combined into a concatenated feature vector and classified using a standard classifier. Decision level fusion consists of merging information at a higher level of abstraction. Based on the data from each single sensor, a preliminary classification is performed. Fusion then consists of combining the outputs from the preliminary
classifications. The common aim of all fusion strategies is achieving greater accuracy (Du et al. 2013; Dong et al, 2009; Yun, 2004).
During the last decade and the near future the number of sensors and satellites has been growing steadily, and the coverage of the Earth in space, time and the electromagnetic spectrum is increasing correspondingly fast. Because of these advances in remote sensing sensors and different abilities of each sensor, sensor fusion become a research hotspot in remote sensing and has been extensively studied and applied to many areas since it usually outperforms a single classifier.
Airborne Light Detection and Ranging (LIDAR) provides accurate height information for objects on the earth, which makes LIDAR become more and more popular in terrain and land surveying. On the other hand hyperspectral imaging is a relatively new technique in remote sensing that acquires hundreds of images corresponding to different spectral channels. The rich spectral information of hyperspectral images increases the capability to distinguish different physical materials, leading to the potential of a more accurate image classification. As hyperspectral and LIDAR data provide complementary information (spectral reflectance, and vertical structure, respectively), a promising and challenging approach is to fuse these data in the information extraction procedure (Dalponte et al. 2008; Swatantran et al, 2011).
Delpante et al (2008) investigate the potentialities of the joint use of hyperspectral and LIDAR data, combined with advanced classification techniques based on Support Vector Machines, for forest classification. They applied a feature selection International Archives of the Photogrammetry, Remote Sensing and Spatial Information Sciences, Volume XL-1/W3, 2013
strategy to automatically select the most effective features subset of hyperspectral data. Then LIDAR data were directly added to the selected hyperspectral bands for the classification. This paper presents a classifier fusion system based on SVM classifier for fusion of LIDAR and hyperspectral data. In the first phase, the proposed method applied some feature extraction strategies on two data sets to produce more information. In the second phase, Support Vector Machine (SVM) applied as a supervised classification strategy on LIDAR data and hyperspectral data. Finally, a classifier fusion method applied to fuse decisions of classifiers of LIDAR and Hyperspectral data. Proposed strategy compared with common classification methods of hypersepectral and LIDAR data.
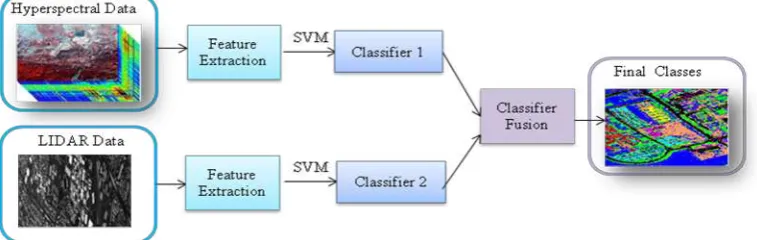
2. PROPOSED CLASSIFIER FUSION METHOD A SVM based classifier fusion system for fusion of hyperspectral and LIDAR data is introduced in this paper. Figure 1 shows the general structure of the proposed methodology.
First, feature extraction phase is applied on two data sets to produce more information. Second, the proposed methodology applies multi-class SVM for classification of each data set. Finally, a classifier fusion method used to fuse the SVM classification results which are applied in previous step on hypersepctral and LIDAR data. In classifier fusion system a set of classifiers is first produced and then combined by a specific fusion method. The resulting classifier is generally more accurate than any of the individual classifiers that make up the ensemble of classifiers
2.1 Feature Extraction on LIDAR and Hyperspectral The main step of classification process on LIDAR and hyperspectral data is extraction of proper features from data set. These features must contain useful information to discriminate between different regions of the surface. On LIDAR data, we have used different GLCM (Gray Level Co- occurrence Matrices) on DSM of LIDAR data. All types of GLCM features on LIDAR data are introduced in Table 1.
Grey Level Co-occurrence Matrices are one of the earliest techniques used for image texture analysis. Let I be a given grey scale image. Let N be the total number of grey levels in the image. The Grey Level Co-occurrence Matrix defined by Haralick is a square matrix G of order N, where the (i, j)th entry of G represents the number of occasions a pixel with intensity i is adjacent to a pixel with intensity j. The normalized co-occurrence matrix is obtained by dividing each element of G by the total number of co-occurrence pairs in G.
The adjacency can be defined to take place in each of the four directions (horizontal, vertical, left and right diagonal). The Haralick texture features are calculated for each of these directions of adjacency (Haralick et al, 1973).
)
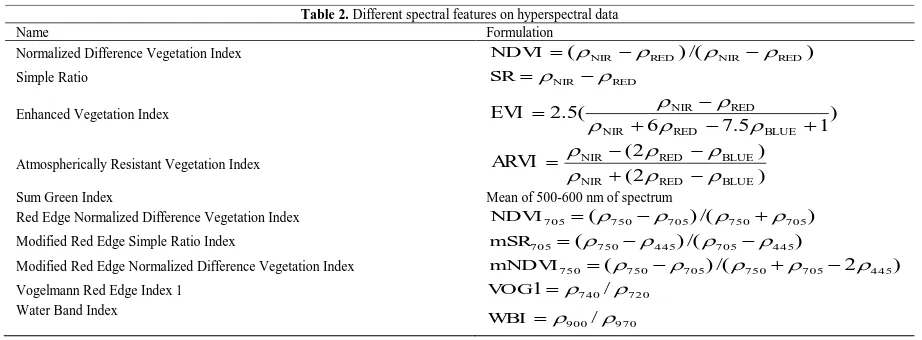
Spectral features on hyperspectral data presented in table 2.
Table 1. Different features that used on LIDAR data
Name Formulation
2.2 Support Vector Machine Classification
SVMs separate two classes by fitting an optimal linear separating hyper plane to the training samples of the two classes in a multidimensional feature space. The optimization problem being solved is based on structural risk minimization and aims to maximize the margins between the optimal separating hyper plane and the closest training samples also called support
the distance between the hyper plane and the origin, b x w x
f( ) . (1)
For linearly not separable cases, the input data are mapped into a high-dimensional space in which the new distribution of the samples enables the fitting of a linear hyper plane. The computationally extensive mapping in a high dimensional space is reduced by using a positive definite kernel k, which meets Mercers conditions (Scholkopf and Smola, 2002).
) function can be defined as:
are Lagrange multipliers.
Recently, SVMs have attracted increasing attention in remote-sensed hyperspectral data classification tasks and an extensive literature is available. Melgani and Bruzzone (2004) applied SVM for classification of hyperspectral data. They obtained better classification results compared to other common classification algorithms. In Watanachaturaporn and Arora (2004) study the aim is to investigate the effect of some factors on the accuracy of SVM classification. The factors considered are selection of multiclass method, choice of the optimizer and the type of kernel function.
Tarabalka (2010) present a novel method for accurate spectral-spatial classification of hyperspectral images using support vector machines. Their proposed method, improved classification accuracies in comparison to other classification approaches.
2.3 Classifier Fusion
Combining classifiers to achieve higher accuracy is an important research topic with different names such as combination of multiple classifiers, Multiple Classifier System (MCS), classifier ensembles and classifier fusion. In such systems a set of classifiers is first produced and then combined by a specific fusion method. The resulting classifier is generally more accurate than any of the individual classifiers that make up the ensemble (Kuncheva, 2004; Kuncheva and Whitaker, 2003). The possible ways of combining the outputs of the L classifiers in a MCS depend on what information can be obtained from the individual members. Kuncheva (2004) distinguishes between two types of classifier outputs which can be used in classifier combination methods. The first types are classifiers that produce crisp outputs. In this category each classifier only outputs a unique class and finally a vector of classes is produced for each sample. The second type of classifier produces fuzzy output which means that in this case the classifier associates a confidence measurement for each class and finally produces a vector for every classifier and a matrix for ensemble of classifier.
Naive Bayes is a statistical classifier fusion method that can be used for fusing the outputs of individual classifiers. The essence of NB is based on the Bayesian theory (Kuncheva, 2004).
s denote the output labels vector of the ensemble for unknown sample x. Also,
k,
(
k
1
,...,
c
)
denote the class labels and c is the number of classes.Then the posterior probability needed to label x is
c
Table 2. Different spectral features on hyperspectral data
Name Formulation
Normalized Difference Vegetation Index NDVI (NIRRED)/(NIRRED)
Simple Ratio SRNIRRED
Enhanced Vegetation Index )
1
Atmospherically Resistant Vegetation Index
)
Sum Green Index Mean of 500-600 nm of spectrum
Red Edge Normalized Difference Vegetation Index NDVI705(750705)/(750705)
The practical implementation of the Naive Bayes (NB) method on a data set with cardinality N is explained below. For each classifier, a
c
c
Confusion Matrixi
CM is calculated by testing
data set (Kuncheva, 2004). The (g, h)th entry of this matrix,
cm
ki,h is the number of elements of the data set whosetrue class label was
k and were assigned by the classifier toclass
h. ByN
hwe denote the total number of elements ofdata set from class
h. Takingcm
ikhN
ki
/
, as an estimate of the posterior probability, and Nk/Nas an estimate of the prior probability, the final support of class
kfor unknown sample x is
Li i
h k L
k
k
cm
iN
x
1 , 1
1
)
(
(7)The maximum membership rule will label x in
kclass.The Bayes classifier has been found to be surprisingly accurate and efficient in many experimental studies. Kuncheva applied NB combination method on artificial data as classifier fusion strategy (Kuncheva, 2004). The NB classifiers have been successfully applied in text classification for example: Xu (1992) applied NB as classifier fusion method in applications to handwriting recognition. These researches have indicated the considerable potential of Naive Bayes approach for the supervised classification of various types of data.
3. EXPERIMENTAL RESULTS
3.1 Data Set
Two datasets, a hyperspectral image and a LIDAR derived Digital Surface Model (DSM), both at the same spatial resolution (2.5m) are applied in this paper. The hyperspectral imagery has 144 spectral bands in the 380 nm to 1050 nm region. The dataset was acquired over the University of Houston campus and the neighbouring urban area. Two data sets were acquired on June 22, 2012. From the 15 different land
cover classes available in the original ground truth; two were discarded; since only few training samples were available for them. Also, some of these classes merged (Residential and Commercial classes merged to produce Building class; Road, Highway and Railroad merged to produce Road class and Parking lot1 and Parking lot2 merged to produce Parking class). Available nine land cover classes were used to generate a set of training data and a set of testing data (Table 3).
Table 3. Houston University lands cover classes and
available reference samples
ID Class Name Reference number
1 Grass-Healthy 198
2 Grass-Stressed 190
3 Grass-Synthetic 192
4 Tree 188
5 Soil 186
6 Water 182
7 Building 387
8 Road 565
9 Parking 376
3.2 Experimental Results
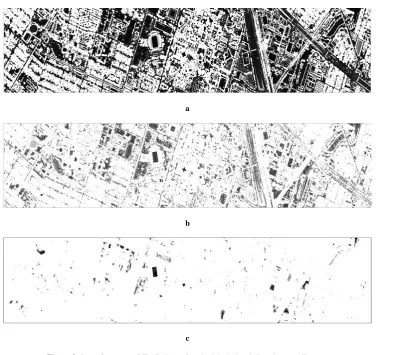
On the LIDAR data set, the feature space was produced based on the definition of features on this data. Figure 3 shows some of these features.
After feature extraction, for the task of data classification, one-against-one SVM is applied on hyperspectral and LIDAR data. Proposed strategy applies grid search as the model selection of SVM classifier. The search range for C is [2-2, 210], and [2-10, 22] for. After classification of LIDAR and hyperspectral data,
Naive Bayes (NB) is applied as classifier fusion approaches on the outputs of classifiers
.
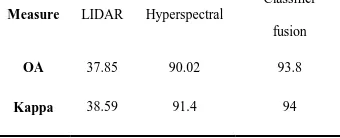
Table 4. Results of different classification strategies
Measure LIDAR Hyperspectral
Classifier
fusion
OA 37.85 90.02 93.8
Kappa 38.59 91.4 94
a
b
Figure 2. Data sets a)LIDAR derived DSM and b) hyperspectral data over Houston campus
20
30
40
50
60
70
80
90
100
Figure 4. Comparison of classification results
In order to show the merits of the proposed methodology, this paper implements a SVM on hyperspectral and LIDAR data separately.
Table 4 and Figure 4 represent the overall accuracy of different classification strategies. Based on these results, proposed classifier fusion on hyperspectral and LIDAR data improves the results of independent classifiers on each data set.
Figure 5 demonstrates the accuracies of different classification strategies for all nine classes of data set. The analysis of figure 5 shows that for some classes such as class 4 (e.g. Tree) and class 7 (e.g. Building) LIDAR data perform better than 50% in terms of classification accuracy.
Figure 5. Comparison of class accuracies between different classification
strategies
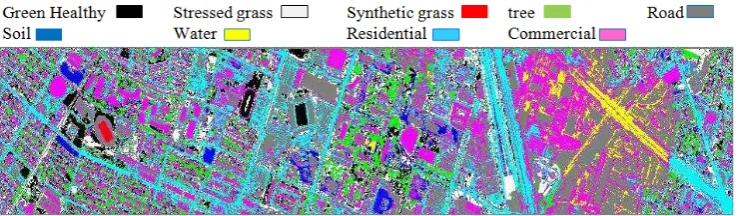
The reasonable cause of these results is that Tree and Building are 3D class that height information of LIDAR data could highlight them in classification. In the same time, LIDAR independently could not detect Grass classes, soil and water because these classes need spectral information. Finally, figure 6 demonstrates the classification map of classifier fusion strategy on hyperspectral and LIDAR data
.
a
b
c
Figure 3. Some features on LIDAR data a)Standard deviation, b)Roughness, c)Entropy
4. CONCLOSION
In this paper, the performance of a classifier fusion system for classification of hyperspectral and LIDAR imageries is assessed. The proposed approach compares proposed classifier fusion system on hypersepctral and LIDAR data with classifiers that are applied independently on each data set and with a simple integration of these two data sets. Hyperspectral images provide a detailed description of the spectral signatures of classes, whereas LIDAR data give detailed information about the height but no information on the spectral signatures. Consequently, fusions of these two data sets provide more information and improve classification result.
Acknowledgment
The authors would like to thank the Hyperspectral Image Analysis group and the NSF Funded Center for Airborne Laser Mapping (NCALM) at the University of Houston for providing the data sets used in this study, and the IEEE GRSS Data Fusion Technical Committee for organizing the 2013Data Fusion Contest
References
Simone, G., Farina, A., Morabito, F., Serpico, S., Bruzzone, L. 2002. Image fusion techniques for remote sensing applications, Information Fusion, 3(1), pp.3–15.
Pohl, C., Van genderen, J.L. 1998. Multisensor image fusion in remote sensing: concepts, methods, and applications, International Journal of Remote Sensing, 19 (5), pp. 823–854.
Du, P., Liu, S., Xia, J., Zhao, Y. 2013. Information fusion techniques for change detection from multi-temporal remote sensing images, Information Fusion, 14(1), pp. 19-27.
J., Zhuang, D., Huang, Y., Fu, J. 2009. Advances in Multi-Sensor Data Fusion: Algorithms and Applications, Journal of Sensors, 9(10), pp.7771-7784
Yun, Z. 2004. Understanding image fusion. Photogrammetry Engineering & Remote Sensing, 6(1), pp. 657–661.
Dalponte, M., Bruzzone, L., Gianelle, D. 2008. Fusion of Hyperspectral and LIDAR Remote Sensing Data for Classification of Complex Forest Areas. IEEE Transactions on Geoscience and Remote Sensing, 46(5), pp. 1416 – 1427.
Swatantran, A., Dubayah, R., Roberts, D., Hofton, M., Blair, B., 2011. Mapping biomass and stress in the Sierra Nevada using lidar and hyperspectral data fusion, Remote Sensing of Environment, 115(1), pp.2917–2930.
Haralick, R., Shanmugam,K., Dinstein, I. 1973. Textural Features for Image Classification”, IEEE Trans. on Systems, Man and Cybernetics, SMC–3(6), pp.610–621
Kuncheva, L, 2004. Combining Pattern Classifiers methods and algorithms. A john Wiley&sons, INC. publication, Hoboken, New jersey. Canada.
Schölkopf, B. And Smola, A, 2002. Learning With Kernels. Cambridge, MA: MIT Press.
Melgani, F., Bruzzone, L, 2004. Classification of Hyperspectral Remote Sensing Images With Support Vector Machines, IEEE Transaction on Geosciences and Remote Sensing, 42(8), pp.1778–1790.
Xu, L., Krzyzak, A., Suen, C.Y, 1992. Methods of combining multiple classifiers and their applications to handwriting recognition, IEEE Transactions on Systems Man and Cybernetics, 22(3), pp.418-435.
Watanachaturaporn, P., Arora, M. K., and Varshney, P. K, 2005. Hyperspectral image classification using support vector machines: A comparison with decision tree and neural network. in Proc. ASPRS Annual Conf.
Weston, J., and Watkins, C., 2002. Multi-class support vector machines, Technical report CSD-TR-98-04.
Tarabalka, Y., Fauvel, M., Chanussot, J., and Benediktsson, J., 2010. SVM- and MRF-Based Method for Accurate Classification of Hyperspectral Images. IEEE Geosciences and Remote Sensing letters, 7(4), pp. 736–740
Figure 6. Classification map of proposed SVM based classifier fusion on hyperspectral and LIDAR data