3D NEAREST NEIGHBOUR SEARCH USING A CLUSTERED HIERARCHICAL TREE
STRUCTURE
A. Suhaibaha*, U. Uznira, F. Antonb, D. Miocb and A. A. Rahmana
a
Geospatial Information Infrastructure (GeoI2) Research Lab., Faculty of Geoinformation and Real Estate,
Universiti Teknologi Malaysia, 81310 Skudai, Johor, Malaysia
[email protected], [email protected], [email protected]
b
Dept. of Geodesy, National Space Institute, Technical University of Denmark, Elektrovej 328, 2800 Kgs. Lyngby, Denmark
[email protected], [email protected]
Commission II, WG II/2.
KEY WORDS: : Nearest Neighbour, 3D Data Clustering, 3D Spatial Database, 3D GIS, Data Management, Information Retrieval
ABSTRACT:
Locating and analysing the location of new stores or outlets is one of the common issues facing retailers and franchisers. This is due to assure that new opening stores are at their strategic location to attract the highest possible number of customers. Spatial information is used to manage, maintain and analyse these store locations. However, since the business of franchising and chain stores in urban areas runs within high rise multi-level buildings, a three-dimensional (3D) method is prominently required in order to locate and identify the surrounding information such as at which level of the franchise unit will be located or is the franchise unit located is at the best level for visibility purposes. One of the common used analyses used for retrieving the surrounding information is Nearest Neighbour (NN) analysis. It uses a point location and identifies the surrounding neighbours. However, with the immense number of urban datasets, the retrieval and analysis of nearest neighbour information and their efficiency will become more complex and crucial. In this paper, we present a technique to retrieve nearest neighbour information in 3D space using a clustered hierarchical tree structure. Based on our findings, the proposed approach substantially showed an improvement of response time analysis compared to existing approaches of spatial access methods in databases. The query performance was tested using a dataset consisting of 500,000 point locations building and franchising unit. The results are presented in this paper. Another advantage of this structure is that it also offers a minimal overlap and coverage among nodes which can reduce repetitive data entry.
1. INTRODUCTION
Franchising-based businesses are the retail outlets that share a brand and central management. This kind of business usually has standardized business methods and practices. According to (Hill, 2008), franchising businesses have dominating the market in many parts of the world. One of the common issues faced by franchisers is locating and analyzing the location of new stores. They have to make sure that the new opening stores are at their strategic locations to attract the highest possible number of customers. Surrounding information such as location of competitor’s stores, transport accessibility and other information would help the process of location analysis.
To analyze the locations of the stores, a spatial handling system is used to manage and process the data. Geospatial Information Systems (GIS) a common tool used in handling and managing spatial data. According to (Keenan, 2005; Posthumus and Bank, 2008), GIS mapping can be used to define market segments, optimize promotional programs, acquire new customers, and retain existing customers. One of the most common analyses
used in market analysis is the Nearest Neighbor (NN) analysis. It uses a point location and identifies the surrounding neighbors.
Nearest neighbor analysis has always been an interesting topic in computer science and geospatial science. The importance of nearest neighbor information could be seen in various applications such as image processing, pattern recognition and Deoxyribonucleic Acid (DNA) sequencing. Numerous models and techniques have been developed due to its popularity and potential. In spatial databases, spatial access methods are used to index and refine the search area to process nearest neighbor queries. Most of the work or research on nearest neighbor search is to focus on query point q, and retrieve k nearby objects from a set of points P with respect to the Euclidean distance or a network distance.
In order to efficiently retrieve the nearest neighbor information, we proposed a spatial access method known as clustered hierarchical structure. This structure is constructed based on group clustering and transformed into a hierarchical structure. Based on our previous work (Azri et al., 2015; Azri et al., 2014), the structure produced a minimal coverage and overlap percentage among nodes to avoid repetitive data entry. Thus, in this paper, we proposed the clustered hierarchical structure in The International Archives of the Photogrammetry, Remote Sensing and Spatial Information Sciences, Volume XLI-B2, 2016
(1) order to retrieve nearest neighbor information. The construction
of hierarchical structure has been discussed in our previous work. However, our focus in this paper is to develop a method of retrieving the nearest neighbor information and test it with the proposed structure.
This paper is organized as follows: problems and motivation regarding the nearest neighbor query information retrieval for stores locator are discussed in the next section. In Section 3, the concept of the proposed method is explained with its implementation. Section 4 presents the analysis and results of the experiment. Finally, the conclusions are presented in Section 5.
2. NEAREST NEIGHBOUR SEARCH
The significance of nearest neighbor information for the marketing and business plan has been mentioned in several researches such as (Akhbari et al., 2014; Kiekintveld et al., 2007; Rodger, 2014). From this information, a lot of analysis can be done such as identifying the best vehicle routing for products delivery, strategize the target group of nearby residential and many more. In (Bellman, 1962), nearest neighbor information is used to schedule the tour procedure for transporting the products from one center to another.
According to the first law of geography, everything is related to everything else, but near things are more related than distant things. Thus, inaccurate results will not optimize the business and marketing strategy. Considering the business of franchising and chain stores in urban areas with high rise multi-level buildings, a 3D method is prominently required in order to locate and identify the nearest neighbor information accurately. 3D information is required in the process of identification such as at which level of the franchise unit will be located or is the franchise unit located is at the best level for visibility purposes. However, with the immense number of urban datasets, the analysis and the efficiency of nearest neighbor information retrieval will become more complex and crucial.
In a database management system (DBMS) environment, several tree structures are used to constellate data and information such as R-Tree (Guttman, 1984), QuadTree, BSP -tree and kd-Tree. However, these structures are still facing the issue of overlap between nodes. For instance, Oracle Database provides a 3D R-Tree structure to deal with 3D data (Murray, 2009; Ravada et al., 2009). However, when the R-Tree is extended into 3D space, the MBV of sibling nodes tends to frequently overlap, and MBVs among nodes can even contain other MBVs. In spatial databases, overlap between nodes is the main reason for the low efficiency of queries due to multi-path queries.
Due to critical overlap of sibling nodes and uneven size of nodes in 3D R-Trees, a research was conducted in (Zhu et al., 2007) to minimize the overlap and optimize the clustering algorithm by introducing k-means clustering algorithm to put forward an improved 3D R-Tree. From this experiment, by using an improved algorithm, the overlapping of node is minimized while balancing the volume of parallelepipeds. However, using k-means would not drastically minimize the overlap among nodes. This is due to the random selection of the initial seed or cluster center which will lead to unbalance number of points in each cluster. This condition will increase
the risk of having serious overlap in the tree structure. Thus, an improved method of clustering is needed to push the limits of the 3D R-Tree structure in order to access nearest neighbor information.
3. CLUSTERED HIERARCHICAL TREE STRUCTURE
3.1 Clustering Algorithm
In this paper, we propose partition-based clustering as a clustering algorithm to group the locations of store locator in the database. Partition-based clustering is a method of clustering that requires a pre-set number of clusters from the user. The commonly used algorithm from this type of cluster is k-means algorithm. By using this algorithm, data will be partitioned into k clusters (C1, C2, …, Ck). The means for all instances in each
cluster are then calculated as cluster centres. The algorithm of k -means is described as follows.
The algorithm starts by randomly finding initial cluster centres. For each one of the iterations, an object or instance is assigned to the nearest cluster centre based on Euclidean distance. Then, cluster centres are recalculated until the coordinates are constant.
The centre of each cluster is calculated as the mean of all objects or instances belonging to that cluster:
��=�1
� ∑ �� ��
�=
where Nkis the number of instances belonging to cluster k and µk is the mean of the cluster k.
According to (Selim and Ismail, 1984), a sample size of m instances or objects does affect the complexity of T iterations of the k-means algorithm. Thus, the complexity of each characterized search by N attributes is:
O (T . k .m . N)
The linear complexity is one of the reasons of k-means popularity. Even if the size of instances is large, this algorithm is computationally attractive. Besides that, the k-means algorithm offers simplicity, speed and adaptability to sparse data (Dhillon and Modha, 2001). The k-means algorithm is sensitive to the presence of noise and outliers (Hasan et al., 2009; Kaufman and Rousseeuw, 2008). A single outlier can increase the squared error dramatically. However, this disadvantage is exceptional in our case, since data used in this research is static
Input: P(object set), k(number of cluster) Output: clusters
Step 1: Initialize k cluster centres.
Step 2: while termination condition is not satisfied do Step 3: Assign objects to the nearest cluster centre. Step 4: Update cluster centres.
Step 5: end while
and stagnant such as buildings and store locations. The only concerning issue using this method is the initial seed of the cluster centre in k-means algorithm. Besides that, one of the functions in k-means is categorized as NP (Non-deterministic Polynomial-time) hard problem. This function is inclined to focus cluster centers at one point or area. Thus, any selection is very sensitive to the group cluster and may make a difference for the end result.
Thus, we suggested to apply the k-means++ algorithm invented by (Arthur and Vassilvitskii, 2007). The k-means++ algorithm proposed a variant of k-means that chooses cluster centers by using weight. Data points are weighted by squared distance from the closest cluster centers that were initially defined. The initial seed of cluster centers were defined and combined with the k-means algorithm, the resulting algorithm is known as k -means++. The algorithm of k-means++ is described as follows.
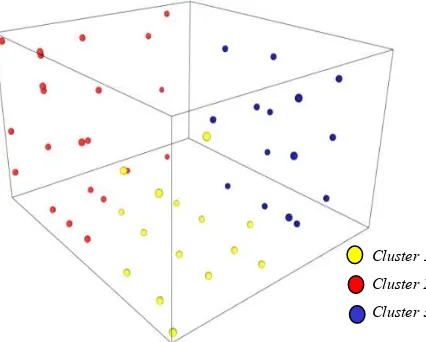
In this paper, a group of franchising-based restaurant has been clustered using k-means++. Figure 1 shows the result of k-means++ clustering algorithm. The produced clusters could be differentiated by colors.
Figure 1. Clusters with k = 3 for franchising restaurant.
3.2 Hierarchical Tree based on Partition-based Clustering
In this paper, a hierarchical tree is formed to retrieve information about competitor’s locations from point q of franchising restaurant. From the results, the franchiser will be able to analyse and decide the best location for the new opening franchise. Based on the previous section, the clustering algorithm would produce several group clusters of competitor’s locations. Then, each group will form a tree node by adjoining a parallelepiped. The minimum coordinates face of parallelepiped is formed based on the minimum value of xmin, ymin and zmin competitor’s location meanwhile the maximum edge of parallelepiped is formed based on the maximum value of xmax, ymax and zmax competitor’s location in the group clusters. The following Figure 2 shows the parallelepiped of group cluster.
Figure 2. Parallelepiped of group clusters k = 3.
From the clusters, hierarchical structure will be constructed. Each parallelepiped is assigned as a child node to the tree. The parent node is the constructed parallelepiped based on minimum value of xmin, ymin and zmin of point location for all clusters and maximum value of xmax, ymax and zmax of point location for all clusters. Parent and child nodes for clustered hierarchical structure are described in Figure 3.
Figure 3. Clustered Hierarchical Structure � �
∑�∈�� �
Input: P(object set), k(number of cluster) Output: clusters
Step 1: Initialize k cluster centres. Step 2: Choose one centre C1 Step 3: Repeat for 2 ≤ i ≤ k
Step 4: Choose Ci to be x∈X with D2weighting
Step 5: while termination condition is not satisfied do Step 6: Assign objects to the nearest cluster centre. Step 7: Update cluster centres.
Step 8: end while
Cluster 1
Cluster 2
Cluster 3
Parallelepiped ID Child Node 1
(Xmin, Ymin, Zmin), (Xmax, Ymax, Zmax)
Child Node 2 Parallelepiped ID (Xmin, Ymin, Zmin), (Xmax, Ymax, Zmax) Parent Node
Parallelepiped ID, (Xmin, Ymin, Zmin), (Xmax, Ymax, Zmax)
Child Node 3 Parallelepiped ID
(Xmin, Ymin, Zmin),
(Xmax, Ymax, Zmax) Cluster 1 Cluster 2
Cluster 3 The International Archives of the Photogrammetry, Remote Sensing and Spatial Information Sciences, Volume XLI-B2, 2016
Based on our previous work, minimum coverage and overlap percentage among nodes can be achieved from the clustered hierarchical structure. Figure 4 shows the comparison of overlap percentage between partition-based clustering hierarchical structure and 3D R-Tree structure.
Figure 4. Overlap percentage analysis for varying number of datasets (Azri et al., 2015)
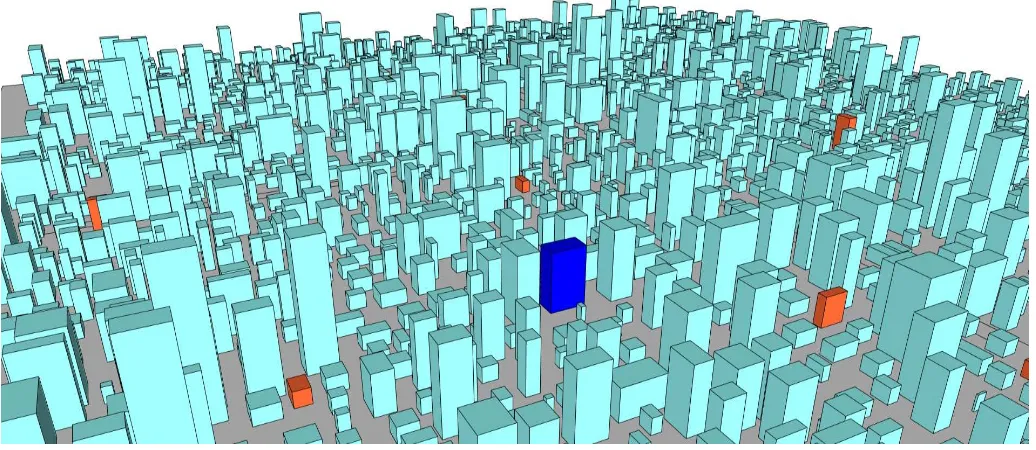
The nearest neighbour information can be retrieved by traversing the hierarchical structure from its parent node. The traversal started by identifying the location of point query q. The location of point query q will serve to identify to which cluster q lies. Other clusters will be pruned to refine the search area. The nearest object with minimum distance Dmin will be identified as a nearest object to point query q. The following workflow describes the process of nearest neighbour point identification from the clustered hierarchical tree:
Figure 5. Location of new franchise and other competitors
4. EXPERIMENT AND ANALYSIS
4.1 Nearest Neighbour Information Retrieval
The proposed structure of clustered hierarchical tree is aimed to manage spatial information in three-dimensional space. To test its ability in retrieving 3D nearest neighbour information, a set of franchising restaurants (see Figure 5) will be tested in this experiment. Franchise_ID = 5257 query point q will be the location point for the new franchise. The return result is expected to list several nearby restaurants from point q with their distances. The test is run using the following Structured Query Language (SQL) statement.
Group A (100,000)
Group B (300,000)
Group C (500,000)
68% 72% 75%
92% 95% 97%
O
v
e
rl
a
p
P
e
rc
e
n
ta
g
e
Number of Datasets, N Overlap among Nodes
Clustered Hierarchical Tree 3D R-Tree
,… ,… Input:q (query point)
Output:p (nearest point)
Step 1: find the group cluster Ci
Step 2: get the cluster_id and prune other cluster Step 3: list all point in the cluster p (p1, p2, p3,…pn) Step 4: for each p calculate distance D from q Step 5: find the minimum value of Dmin
DISTANCE <= ‘3KM’; SELECT COMPETITOR_ID, NAME, DISTANCE
FROM COMPETITOR
WHERE FRANCHISE_ID = 5257 AND DISTANCE <= ‘3KM’;
Figure 6 shows the result of nearby competitors from point q. The returned results from the database shows there are eight competitors within 3KM distance from the proposed location (see Figure 7. Thus, the proposed location should be shifted to attract customers and increase sales.
Figure 7. List of competitors within 3KM distance.
4.2 Accessed Page of Nearest Neighbour
To analyse the effect of the number of neighbours k towards the number of page accesses, we ran a test using synthetic 3D data. 25 different values of k nearest neighbour range from 1 to 150 are tested in this test. We graphed the result as k (the number of nearest neighbours) versus the number of pages in the Figure 8. From the plotted results, the number of pages grew linearly each time the number of nearest neighbours increased.
Figure 6. Location of competitors from point q within 3KM.
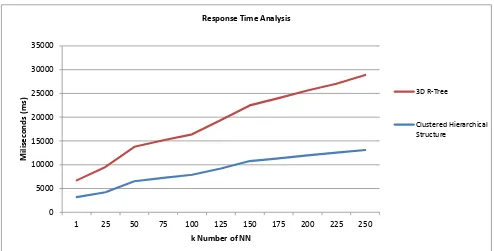
4.3 Response Time Analysis
The nearest neighbour data retrieval is also tested for the data response time analysis. Since this hierarchical structure improves the data retrieval capabilities, a group of k nearest neighbour search is performed in order to show the improvement. In this test, the search operation is performed based on cluster_id and its location. Data retrieval is measured in millisecond (ms) and it was tested in a windows operating system with single Intel Xeon running at 2.2GHz and 4GB Random Access Memory (RAM). The graph shown in Figure 9 shows a set of 500,000 franchising restaurants locations to retrieve a different k number of nearest neighbour range from 1 to 250. From the result, the proposed hierarchical tree structure offers a lower data retrieval time compared with hierarchical structure of 3D R-Tree, which is 15% to 20% faster.
5. CONCLUSIONS
This paper proposed a structure of clustered hierarchical tree to constellate 3D data in geospatial databases for efficient data retrieval and analysis. The structure is constructed based on groups of clusters. To the best of our knowledge, this is the first data constellation structure based on a clustering approach for nearest neighbour information retrieval.
0 10 20 30 40 50 60
0 20 40 60 80 100 120 150
P
a
g
e
A
cc
e
se
d
Number of k
Accessed Page of Nearest Neighbor
Group A = 1000
Group B = 5000
Group C = 10000
Group D = 25000
0 5000 10000 15000 20000 25000 30000 35000
1 25 50 75 100 125 150 175 200 225 250
M
il
is
e
co
n
d
s
(m
s)
k Number of NN
Response Time Analysis
3D R-Tree
Clustered Hierarchical Structure
Figure 7. Effect of k number of nearest neighbour to access page.
Figure 8. Response time analysis for k nearest neighbour.
The findings and applications, resulting from the comprehensive tests and analyses of the proposed structure are discussed below. First, the nearest neighbour information was identified based on cluster id and parallelepiped id. On the basis of this identification, data and information were directly retrieved from a specific group of clusters. Compared to non-constellated data, each record in the database table needed to be scanned or visited by the filtering process. Based on our previous work in (Azri et al., 2015; Azri et al., 2014) the overlap test shows the capability of the proposed structure in reducing overlap. The results show that the percentage of overlap between nodes is substantially reduced compared with the existing tree structure in the database. In the second test, the 25000 point locations were tested to analyse the effect of k, the number of nearest neighbour towards the number of accessed pages. The results show that the number of pages accessed increased linearly with the number of retrieved points. In the final test, the query response time of k nearest neighbour objects from 500000 points shows an advantage of the proposed structure in retrieving the nearest neighbour information.
ACKNOWLEDGEMENT
This work is supported by the Ministry of Education, Malaysia under the MyPhD, MyBrain15 initiatives and UTM Research University Grant, Vote J.130000.2427.02G77.
REFERENCES
Akhbari, M., Zare Mehrjerdi, Y., Khademi Zare, H., Makui, A., 2014. A Novel Continuous Knn Prediction Algorithm To Improve Manufacturing Policies In A Vmi Supply Chain. International Journal Of Engineering, Transactions B: Applications 27, 1681-1690.
Arthur, D., Vassilvitskii, S., 2007. K-Means++: The Advantages Of Careful Seeding, Proceedings Of The Eighteenth Annual Acm-Siam Symposium On Discrete Algorithms. Society For Industrial And Applied Mathematics, Pp. 1027-1035.
Azri, S., Anton, F., Ujang, U., Mioc, D., Rahman, A., 2015. Crisp Clustering Algorithm For 3d Geospatial Vector Data Quantization, In: Breunig, M., Al-Doori, M., Butwilowski, E., Kuper, P.V., Benner, J., Haefele, K.H. (Eds.), 3d Geoinformation Science. Springer International Publishing, Pp. 71-85.
Azri, S., Ujang, U., Rahman, A.A., Anton, F., Mioc, D., 2014. Spatial Access Method For Urban Geospatial Database Management: An Efficient Approach Of 3d Vector Data Clustering Technique, 2014 9th International Conference On Digital Information Management, Icdim 2014, Pp. 92-97.
Bellman, R., 1962. Dynamic Programming Treatment Of The Travelling Salesman Problem. J. Acm 9, 61-63.
Dhillon, I.S., Modha, D.S., 2001. Concept Decompositions For Large Sparse Text Data Using Clustering. Mach. Learn. 42, 143-175.
Guttman, A., 1984. R-Trees: A Dynamic Index Structure For Spatial Searching. Sigmod Rec. 14, 47-57.
Hasan, M.A., Chaoji, V., Salem, S., Zaki, M.J., 2009. Robust Partitional Clustering By Outlier And Density Insensitive Seeding. Pattern Recognition Letters 30, 994-1002.
Hill, J.S., 2008. International Business: Managing Globalization. Sage Publications, Inc.
Kaufman, L., Rousseeuw, P.J., 2008. Divisive Analysis (Program Diana), Finding Groups In Data. John Wiley & Sons, Inc., Pp. 253-279.
Keenan, P., 2005. Concepts And Theories Of Gis In Business. Geographic Information Systems In Business, 1-19.
Kiekintveld, C., Miller, J., Jordan, P.R., Wellman, M.P., 2007. Forecasting Market Prices In A Supply Chain Game, Proceedings Of The International Conference On Autonomous Agents, Pp. 1323-1330. 3d Spatial Databases: Experiences With Oracle Spatial 11g, In: Lee, J., Zlatanova, S. (Eds.), 3d Geo-Information Sciences. Springer Berlin Heidelberg, Pp. 153-173.
Rodger, J.A., 2014. A Fuzzy Nearest Neighbor Neural Network Statistical Model For Predicting Demand For Natural Gas And Energy Cost Savings In Public Buildings. Expert Syst. Appl. 41, 1813-1829.
Selim, S.Z., Ismail, M.A., 1984. K-Means-Type Algorithms: A Generalized Convergence Theorem And Characterization Of Local Optimality. Pattern Analysis And Machine Intelligence, Ieee Transactions On Pami-6, 81-87.
Zhu, Q., Gong, J., Zhang, Y., 2007. An Efficient 3d R-Tree Spatial Index Method For Virtual Geographic Environments. ISPRS Journal Of Photogrammetry And Remote Sensing 62, 217-224.