SPATIAL DATA MINING TOOLBOX FOR MAPPING SUITABILITY OF LANDFILL
SITES USING NEURAL NETWORKS
Sohaib K. M. Abujayyab a, Mohd Sanusi S. Ahamad *a, Ahmad Shukri Yahya a, Hamidi Abdul Aziz a&b
a
School of Civil Engineering, Engineering Campus, Universiti Sains Malaysia, 14300 Nibong Tebal, P. Pinang, Malaysia.
b
Solid Waste Management Cluster, Science and Engineering Research Center, Engineering Campus, Universiti Sains Malaysia, 14300 Nibong Tebal, Penang, Malaysia.
*Corresponding Author: E-mail: [email protected]
KEYWORDS: Spatial data mining, GIS, neural networks, ArcGIS toolbox, landfill suitability analysis.
ABSTRACT:
Mapping the suitability of landfill sites is a complex field and is involved with multidiscipline. The purpose of this research is to create an ArcGIS spatial data mining toolbox for mapping the suitability of landfill sites at a regional scale using neural networks. The toolbox is constructed from six sub-tools to prepare, train, and process data. The employment of the toolbox is straightforward. The multilayer perceptron (MLP) neural networks structure with a backpropagation learning algorithm is used. The dataset is mined from the north states in Malaysia. A total of 14 criteria are utilized to build the training dataset. The toolbox provides a platform for decision makers to implement neural networks for mapping the suitability of landfill sites in the ArcGIS environment. The result shows the ability of the toolbox to produce suitability maps for landfill sites.
1. INTRODUCTION 1.1 General introduction
One of the challenges in society these days is the large volumes of solid wastes. The rapid development of economies and advancement in civic living principles have sped up the municipal solid wastes production. With this growth in the municipal solid waste volume, numerous hazards have caused serious damages to the community wellbeing and inner city situation, jeopardizing the long-term sustainable advancement of the society.
Threats arise because of the modest choices during suitability mapping (Xu et al., 2013). Numerous research are being conducted to improve the techniques and methods of landfill sites suitability mapping (Gupta et al., 2015). Hence, to map the solid waste sites appropriately, a competent technique is vital to maximize the performance of the current compound methodologies. The technique must deliver satisfactory results for both natural resource development and proper solid waste management.
Suitability mapping is an approach that facilitates and helps decision makers in the suitability evaluation of new landfill sites (Malczewski, 2006). Recently, multi-criteria decision analysis (MCDA) fuzzy logic practices and approaches have been utilized in this field. In the early 90s, various multi-criteria evaluation (MCE) methods and decision rules were applied to the mapping the suitability assessment of landfill sites (Das and Bhattacharyya, 2015; de Souza et al., 2016), such as weighted linear combination (WLC) (Shahabi et al., 2014), ordered weighted average (OWA) (P. V. Gorsevski et al., 2012), and Boolean logic (Pradhan and Billa, 2013).
In addition, analytic hierarchy process (AHP) was also employed in several works (Ghobadi et al., 2013; Shahabi et al., 2014). MCDA, the current methodology used to select suitable locations for new sites, is a time-consuming and complex process (Guiqin et al., 2009). Moreover, the method does not satisfy the requirements of existing managerial regulations and does not address the need to lessen economic, environmental, health, and social costs (Nazari et al., 2012). Furthermore, the phenomenon of “not in my back yard” (Vasiljević et al., 2012) contributes to the drawbacks of this method. Thus, the availability of the prevalent collection of decision rules for MCE and their techniques make the formulation of a proper method difficult.
Considerable progress have been recently made in neural networks and spatial data mining (SDM) applications, mostly in the prediction and classification areas. Classification clusters related structures according to their characteristics. Examples of SDM include the flood simulation to evaluate the probability levels of potential flood regions (Kia et al., 2012) and landslide susceptibility mapping (Conforti et al., 2014).
In addition, classification aims to estimate the predictable consequences according to accessible experience or knowledge. Several studies revealed the superior performance of the SDM
ANNs toolbox can forecast the suitability level of different parcels according to the knowledge and features learned from current landfill locations. ANNs obtained a strong standing because of their capability for knowledge extraction and suitability modelling of new sites based on the current spatial characteristics between variables. Since the end of the 1980s, a number of ANNs models have been applied. ANNs have demonstrated their roles in several areas.
The objective of the present work is to create an ArcGIS spatial data mining toolbox for mapping the suitability of landfill sites using multi-layer perceptron (MLP) neural networks. The toolbox test and applications are based on the dataset from the northern states of Malaysia.
1.2 Toolboxdescription and processing
The toolboxdelivery platform for suitability mapping of landfill sites utilizes neural networks in the ESRI ArcGIS 10.2 environment. The toolbox is executed using the Python scripting language, which is accessible in ArcGIS 2013, and based on the distribution of existing landfill sites (absence/presence calculations). Distribution is represented through grid sample points with attribute variables (deliver predictors or explanatory variables that represent current situations and target data for the training and prediction stages). Furthermore, the toolbox tracks suitability patterns or knowledge within the distribution of existing landfill sites, then predicts potential landfill locations.
In addition, the toolbox employs the MLP neural network with regularization and learning rate decay. The MLP neural network consists of three layers: input, hidden, and output. (A) The number of neurons in the input layer matches the number of a certain input forecaster criteria. (B) In the hidden layer, a number of neurons will be able to define the requirements of the end-user. (C) The output layer only has a single neuron for approximation suitability value in any particular geographical site (a site in a grid of sample points).
The feedforward algorithm loops around all the nodes in the hidden layer and adds all the outputs from the input layer together. Their weights are the output of each node, that is, the sigmoid function of the sum of all inputs, which is then passed on to the next layer. The logistic transfer function is used for the output layer. Supervised training is accomplished through a backpropagation function. Several calculations should be performed in each stage. The learned network can be stored in a NumPy file and then imported in the prediction stages. Training and prediction are executed separately, in stages.
The toolbox follows a linear track in six sequential eminent stages: sample points preparation, dataset pre-processing, NN training, dataset processing for final prediction, prediction, and suitability mapping (see Figure 1). The purpose of dividing the toolbox into several tools is to avoid the high utilization of the cache memory of the system and to facilitate the end-user utilization of the toolbox by several processing steps. Therefore, human errors are avoided and wasted time is reduced because of the dispersion.
Figure 1. Logic and connections of the tools to each other and to the end user.
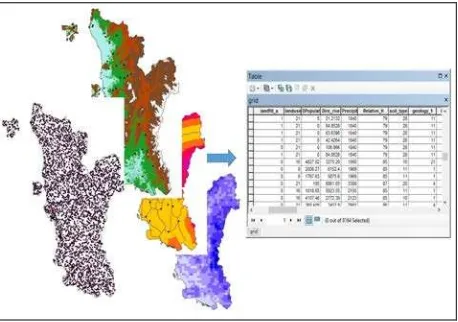
(Stage 1) The stage of preparing the sample points includes the boundary of the study area formatted as an ESRI polygon-type geodatabase feature class binding the grid points. Then, the binary target landfill map, which needs to be formatted as an ESRI polygon-type geodatabase feature class (0 = non-landfill, 1 = landfill), is developed. In addition, grid sample points are established for the landfill and non-landfill areas. Finally, attribute data are extracted from every geographical point in the grid from the raster layers of the criteria and binary target map, as reflected in Figure 2.
Figure 2. Extracting attribute data
The grid should contain only the fields of the suitability criteria (input and target) and the OBJECTID/shape fields. Coordinates correction must be performed first if necessary.
(Stage 2) This stage verifies the input variables. If an issue arises, the tool displays an instructive fault note and dismisses the processing. The pre-processing of spatial data starts with the collection of points for the geodatabase grid sample points layer. During this stage, the tool removes missing samples and outliers from the dataset. The landfill attributes are normalized for faster training. The end-user should initially select the fitting criteria to sidestep extraordinary collinearity. This stage ends with the storage of the processed dataset and its export to an excel file to allow users to migrate the data to different statistical software, select the relevant criteria, and exclude the collinearity. This process is repeated using the new criteria.
error goal and satisfy the process, generating the training pattern. Either the whole dataset of sample points or a part of it can be trained by the tool as the input dataset. The number of neurons in the hidden layer needs to be fed to the tool. This stage starts with the collection of the processed datasets and ends with the storage of the trained network.
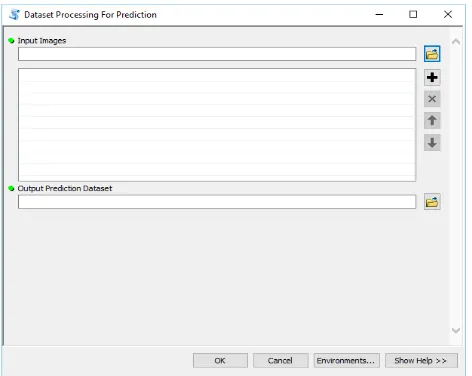
(Stage 4) The fourth stage, which is the dataset processing for final prediction, prepares the raster layers of the variables for the final prediction of the whole area. The stage starts with the addition of the input raster layers of related variables. To ensure the correctness of the prediction process of the prediction dataset, the end-user has to sort the raster layers according to the ranks of the fields in the interior of the training dataset. During the prediction stage, the tool iterates through the images to prepare the dataset. The stage ends with the storage of the multi-parts of the dataset for final prediction.
(Stage 5) The fifth stage is prediction, which starts with the collection of the trained network for the given file that was previously saved and processed. During this stage, the tool iterates through the sample rows of the prediction dataset, and the predicted Y values are stored as an array. The predicted values typically continues within the (0; 1) interval.
(Stage 6) The final stage is the suitability mapping. This stage is executed to process the output Python array from the previous stage to produce the suitability map as a raster layer. The scale interval of the output is divided into multi-categories by a manual trial-and-error specified threshold.
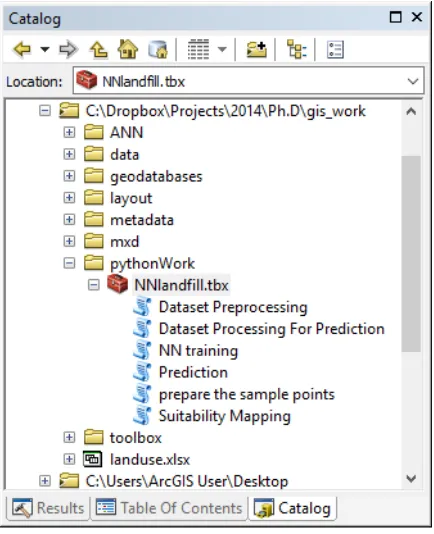
The toolbox (Figure 3) can be utilized as follows: (A) a manual tool in the ArcToolbox or by Model Builder and (B) a script in the Python commander. The ANN toolbox includes six sub-tools for the six stages, which are illustrated in Figure 4 to Figure 9, respectively.
Figure 3. Spatial data mining toolbox for landfill suitability mapping using neural networks
Figure 4. Parameterization tool to launching the first stage
Figure 5. Parameterization tool to launch the second stage
Figure 7. Parameterization to launch the fourth stage
Figure 8. Parameterization tool to launch the fifth stage
Figure 9. Parameterization tool to launch the sixth stage
2. CASE STUDY IN THE NORTH AREA OF MALAYSIA
A case study based on the distribution of landfill and non-landfill sites in the northern area of Malaysia is introduced. This study focuses on a modelling process containing the input data, the relevant criteria, and the modelling outcome. This section aims to prove the usability of the toolbox.
2.1 Area of case study
The area of the case study is located in the northwest region of Peninsular Malaysia. Spatially, the case study spans the latitude 3°40'37.87"N toward 6°43'22.61"N and longitude 100°11'20.09"E toward 101°44'41.53"E as shown in Figure 10. The study area comprises four federations, which are Perlis, Penang, Perak, and Kedah. Roughly, the total study area is 32191 km2, which covers around 9.75% of the Peninsular Malaysia area. Total residents were 2,258,428 in 2010. The climate is sunny and warm. The relative humidity regularly goes beyond 82.3% (Tukimat and Harun, 2011). The annual rainfall average reaches up to 3,218 mm/y. Furthermore, the temperature is fairly stable, which usually ranges from 23 °C to 33 °C. Almost half of the study area are mountainous terrains whose elevations vary from 1 m to 3,978 m, while the rest are plain terrains.
Figure 10. Study area (Perak, Penang, Kedah, and Perlis)
2.2 Dataset sources and collection
2.3 Application
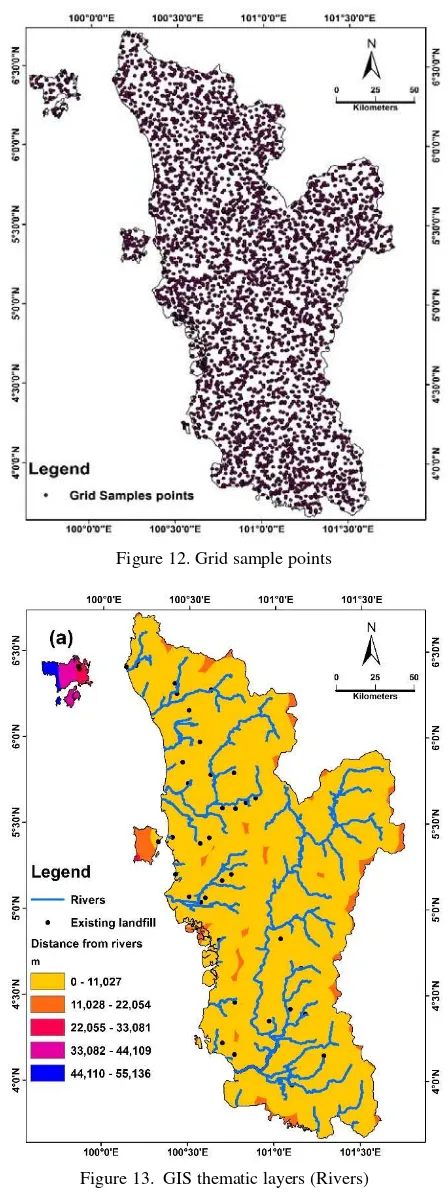
(1) The binary target maps of landfill sites and grid sample points are created using the prepared sample points tool (see Figures 11 and 12). A sample point embodies a landfill site. Grid sample points have a 30-m horizontal resolution to guarantee that the cell size will accurately exemplify the areas of landfill sites. A total of 4,082 samples are detected in the areas of landfill sites. Hence, 4,082 points are also identified for non-landfill positions. Subsequently, the dataset is derived from the target binary landfill map and 14 layers of criteria based on the sample points. The attributes are saved in a table, which is exported to an excel file.
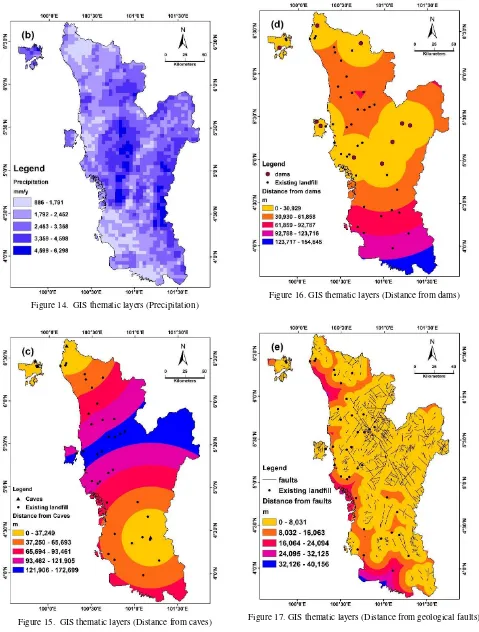
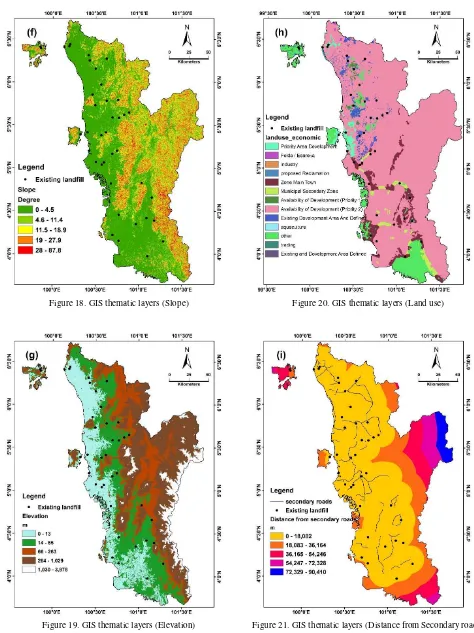
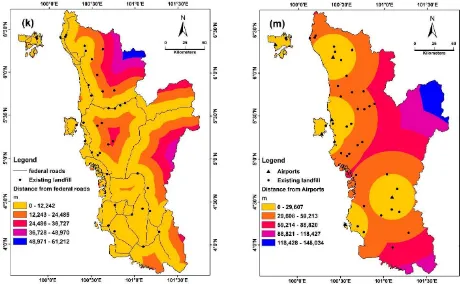
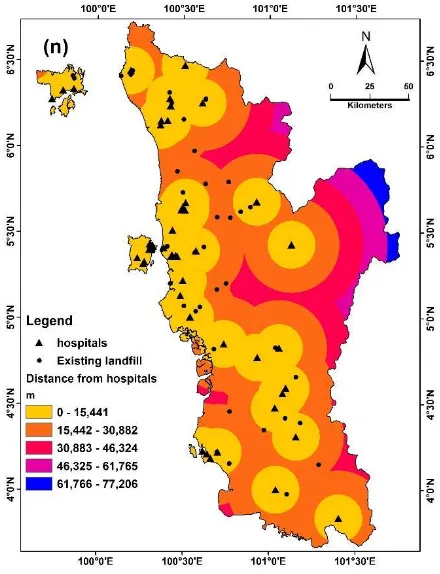
(2) The primary dataset is extracted using the dataset preprocessing tool. Based on the statistical analysis method using the Weka software, ConsistencySubsetEval test is used to select the most relevant criteria. Fourteen criteria are identified as relevant criteria that embody 14 GIS raster layers out of the 34, which are the best predictors of landfill suitability in the north of Malaysia and are used as explanatory variables. The variables, such as rivers, precipitation, caves, dams, faults, slope, elevation, land uses, secondary roads, highways, federal roads, district boundaries, airports, and hospitals, are the thematic layers, as illustrated in Figures 13 to 25.
Figure 11. GIS thematic layers (binary target map of landfill and non-landfill sites)
(3) During the training stage, network is trained using 37 neurons in the first hidden layer until the network reaches the error goal and creates a training pattern.
(4) The third stage is dataset processing for final prediction, which prepares the raster layers of the variables for the whole area for the final prediction. The stage starts with the addition of the input raster layers of related variables. During the prediction stage, the tool iterates through the images to prepare the dataset. The process ends with the saving of 10 datasets for prediction.
(5) The fifth stage is prediction, which starts with the collection of processed datasets and trained network from the given file that was previously saved. The network and dataset are used to predict the Y values of suitability and store it as an array.
(6) The sixth stage is suitability mapping. The output array from the previous stage is processed to produce the suitability map (see Figure 27).
Figure 12. Grid sample points
Figure 14. GIS thematic layers (Precipitation)
Figure 15. GIS thematic layers (Distance from caves)
Figure 16. GIS thematic layers (Distance from dams)
Figure 18. GIS thematic layers (Slope)
Figure 19. GIS thematic layers (Elevation)
Figure 20. GIS thematic layers (Land use)
Figure 22. GIS thematic layers (Distance from Highway)
Figure 23. GIS thematic layers (Distance from federal road)
Figure 24. GIS thematic layers (Distance from local boundaries)
Figure 26. GIS thematic layers (Distance from hospitals)
Figure 27. Solid waste landfill sites suitability map produced by NN toolbox
3. RESULT AND DISCUSSION
The outcomes of modeling the landfill sites are illustrated in Figure 27. The best location is found in the four states. The result displays great similarity with the existing landfill sites. The result of the confution matrix value is 98.1%. As a result, 57.84% of the study area (18,622 km2) lie in the very low suitability class. With the suitability index, 26.56% (8,551.88 km2) are located in the low suitability class, 2.89% (932.27 km2) are considered in the moderate suitability class, and 1.86% (601.41 km2) are located in the high suitability class.
A total of 10.82% (3484.04 km2) of the study area is located in the very high suitability class. The limited areas located in the very high suitability class satisfy the considerable network accuracy because they commonly appear in previous suitability mapping studies. The landfill suitability map anticipates providing substantial assistance to the planning department of solid waste. Landfill suitability map supports decision makers during the planing for future expansions. Moreover, the suitability map of landfill sites in this case study can save the environment from additional hazards.
4. CONCLUSION
The objective of this paper is to develop an ArcGIS spatial data mining toolbox for mapping the suitability of landfill sites using neural networks. The target level of this work is regional scale. The toolbox applied on the dataset was extracted from the northern states of Malaysia. MLP neural networks architecture with a backpropagation learning function was engaged. A roster of 14 criteria was used to construct the training dataset. The toolbox employed six tasks, including manipulation, processing the spatial data, processing training, and prediction datasets up to the point of producing the final suitability map.
The implemantation of the toolbox was straightforward and had several benefits because all data were processed by the toolbox itself and these data only required to be migrated to a statistical software and eventually fed into the toolbox. In addition, the toolbox provided a platform for decision making in GIS, environment, and planning communities. The toolbox simplified the application of NN suitability mapping for landfill sites without the need to comprehend the fundamental methods and criteria in the selection of the location of new landfill sites. The result of this study revealed the capability of the toolbox to produce suitability maps for landfill sites.
ACKNOWLEDGMENTS
REFERENCES
Abujayyab, S.K.M., Ahamad, M.A.S., Yahya, A.S., Saad, A.-M.H.Y., 2015. A NEW FRAMEWORK FOR GEOSPATIAL
SITE SELECTION USING ARTIFICIAL NEURAL
NETWORKS AS DECISION RULES: A CASE STUDY ON LANDFILL SITES. ISPRS Ann. Photogramm. Remote Sens. Spat. Inf. Sci. II-2/W2, 131–138. doi:10.5194/isprsannals-II-2-W2-131-2015
Conforti, M., Pascale, S., Robustelli, G., Sdao, F., 2014. Evaluation of prediction capability of the artificial neural networks for mapping landslide susceptibility in the Turbolo River catchment (northern Calabria, Italy). CATENA 113, 236– 250. doi:http://dx.doi.org/10.1016/j.catena.2013.08.006
Das, S., Bhattacharyya, B.K., 2015. Optimization of municipal solid waste collection and transportation routes. Waste Manag. 43, 9–18. doi:10.1016/j.wasman.2015.06.033
de Souza, R.G., Clímaco, J.C.N., Sant’Anna, A.P., Rocha, T.B., do Valle, R. de A.B., Quelhas, O.L.G., 2016. Sustainability assessment and prioritisation of e-waste management options in Brazil. Waste Manag. doi:10.1016/j.wasman.2016.01.034
Ghobadi, M.H., Babazadeh, R., Bagheri, V., 2013. Siting MSW landfills by combining AHP with GIS in Hamedan province, western Iran. Environ. Earth Sci. doi:10.1007/s12665-013-2271-9
Gorsevski, P. V., Donevska, K.R., Mitrovski, C.D., Frizado, J.P., 2012. Integrating multi-criteria evaluation techniques with geographic information systems for landfill site selection: A case study using ordered weighted average. Waste Manag. doi:10.1016/j.wasman.2011.09.023
Gorsevski, P. V, Donevska, K.R., Mitrovski, C.D., Frizado, J.P., 2012. Integrating multi-criteria evaluation techniques with geographic information systems for landfill site selection: a case study using ordered weighted average. Waste Manag. 32, 287– 296.
Guiqin, W., Li, Q., Lijun, C., 2009. Landfill site selection using spatial information technologies and AHP: A case study in Beijing, China. J. Environ. Manage. 90, 2414–2421. doi:http://dx.doi.org/10.1016/j.jenvman.2008.12.008
Gupta, N., Yadav, K.K., Kumar, V., 2015. A review on current status of municipal solid waste management in India. J. Environ. Sci. 37, 206–217. doi:10.1016/j.jes.2015.01.034
Kia, M., Pirasteh, S., Pradhan, B., Mahmud, A., Sulaiman, W., Moradi, A., 2012. An artificial neural network model for flood simulation using GIS: Johor River Basin, Malaysia. Environ. Earth Sci. 67, 251–264. doi:10.1007/s12665-011-1504-z
Li, D., Wang, S., Li, D., 2015. Spatial Data Mining. doi:10.1007/978-3-662-48538-5
Malczewski, J., 2006. GIS‐based multicriteria decision analysis: a survey of the literature. Int. J. Geogr. Inf. Sci. 20, 703–726.
Nazari, A., Salarirad, M.M., Bazzazi, A.A., 2012. Landfill site selection by decision-making tools based on fuzzy multi-attribute decision-making method. Environ. Earth Sci. 65, 1631–1642.
Pijanowski, B.C., Tayyebi, A., Doucette, J., Pekin, B.K., Braun, D., Plourde, J., 2014. A big data urban growth simulation at a national scale: Configuring the GIS and neural network based Land Transformation Model to run in a High Performance Computing (HPC) environment. Environ. Model. Softw. 51, 250–268. doi:http://dx.doi.org/10.1016/j.envsoft.2013.09.015
Pradhan, B., Billa, L., 2013. GIS modeling for selection of a transfer station site for residential solid waste separation and recycling. Pertanika J. Sci. Technol. 21, 477–488.
Pradhan, B., Lee, S., 2010. Landslide susceptibility assessment and factor effect analysis: backpropagation artificial neural networks and their comparison with frequency ratio and bivariate logistic regression modelling. Environ. Model. Softw. 25, 747–759. doi:http://dx.doi.org/10.1016/j.envsoft. 2009.10.016
Shahabi, H., Keihanfard, S., Ahmad, B. Bin, Amiri, M.J.T., 2014. Evaluating Boolean, AHP and WLC methods for the selection of waste landfill sites using GIS and satellite images. Environ. Earth Sci. 71, 4221–4233.
Vasiljević, T.Z., Srdjević, Z., Bajčetić, R., Miloradov, M.V.,
2012. GIS and the analytic hierarchy process for regional landfill site selection in transitional countries: a case study from Serbia. Environ. Manage. 49, 445–458.