EFFICIENT EXTRACTION METHOD OF THE CHANGE OF BUILDINGS
FOR FIXED PROPERTY INVESTIGATION
Y. Tanauchi a, *, H. Chikatsu b a
System Development and Research Center, AERO ASAHI CORPORATION, 3-1-1, Minamidai, Kawagoe, Saitama, 350-1165, Japan - [email protected]
b
Division of Architectural, Civil and Environmental Engineering, Tokyo Denki University, Ishizaka, Hatoyama, Saitama, 350-0394, Japan - [email protected]
Working Group V/1
KEY WORDS: Photomaps, Change Extraction, Building, Aerial Photograph, Automation
ABSTRACT:
In order to appraise fixed property, local governments in Japan annually investigate taxable buildings on January 1, but the efficiency of the investigation is an issue. With this context, change extraction methods of buildings have been studied using various data. However, labor and time optimization for change extraction methods remains an issue. With this in mind, the authors have concentrated on developing a change extraction method for buildings that uses only photomaps of two separate times. This paper describes the extraction method using color and texture, which can be obtained from photomaps. In order to evaluate effectiveness, the proposed method was investigated using photomaps of two separate times on various locations. It was confirmed that the proposed method extracted the changed buildings. It was also verified that the change of buildings cannot be extracted by color information only; rather, the change extraction of buildings was accomplished by using both color and texture. It should be noted that all changed buildings include extracted regions so that the change extraction of buildings is effectively performed without oversights. The proposed method could extract all changed buildings. In conclusion, the proposed method can reduce over-extraction of changed buildings by intensively visually checking extracted regions that have changes in color or texture rather than by visually checking all regions of photomaps. It is concluded that the proposed method has the ability to effectively extract changed buildings by using only photomaps.
* Corresponding author.
1. INTRODUCTION
Fixed property tax constitutes about 40% of the municipal tax revenue for local government in Japan. Local governments annually impose the fixed property tax for taxable lands, buildings, and depreciable assets (fixed property) on owners on January 1. Investigations that identify newly erected buildings, extension and reconstruction buildings, demolished buildings, and so on, are important sources of fixed property tax for buildings. However, to do this, workload such as labor, time, and so on for the investigations remain unsolved.
With this context, various methods have been attempted to reduce this workload. For example, one method visually checks aerial photographs of the investigation field taken at two separate times. In addition, some papers have reported change extraction methods for buildings using various data. These include using aerial television images captured by helicopter (Mitomi et al., 2002), using satellite synthetic aperture radar (SAR) intensity images (Matsuoka et al., 2002), using high-resolution satellite imaging (Miura et al., 2004), and so on. However, to use these methods, it is necessary to obtain data and create new data, both of which increase workload.
With this in mind, the authors have concentrated on developing a change extraction method for buildings using photomaps of two separate times (Tanauchi et al., 2011). That is to say, in order to avoid the creation of new data or the collection of existing data, we proposed a method that uses photomaps of
two separate times drawn from the aerial photographs that are constantly captured by the local governments. In addition, the proposed method involves a low risk of missing changed buildings in order to extract changes in terms of three metrics, color, shape, and texture obtained from the photomaps. However, certain shortcomings of this method, such as over-extraction of changed buildings and considering about automatic thresholding of the extraction algorithm. Therefore, in this study, we developed a change extraction method for buildings, which includes automatic thresholding and reduces over-extraction of changed buildings using only photomaps of two separate times.
The overview of this paper is as follows: Section 2 explains the proposed change extraction method for buildings. Section 3 specifies the photomap data for accurate verification of change extraction. Section 4 gives the change extraction results and their analysis. Finally, Section 5 concludes this paper.
2. CHANGE EXTRACTION METHOD
2.1 Methodology
The proposed method utilizes photomaps in order to equalize positions and inclinations of the features in photographs taken at two separate periods. The method attempts change extraction for buildings by using color and texture obtained from the photomaps. Incidentally, a previous method used not only color International Archives of the Photogrammetry, Remote Sensing and Spatial Information Sciences, Volume XXXIX-B5, 2012
and texture but also edges as shape information (Tanauchi et al., 2011). The risk of missing changed buildings was reduced by using shape information. However, over-extraction of changed buildings increases when edges are not extracted perfectly. Accordingly, in this study, in order to reduce over-extraction of changed buildings, the change extraction method for buildings limited the information to color and texture.
2.2 Color change extraction
In order to extract color changes in photomaps of two separate times, we used the hue, saturation, and intensity (HSI) color model shown in Fig.1.
Fig.1. HSI color model
Each red, green, blue (RGB) color pixel value in the photomaps of two separate times was converted to an HSI color pixel value by using equations (1) to (4). The values of R, G, B, S, and I value (dHSI) was defined by equation (5) as the distance between
Fig.1. The color changed values were calculated each same pixel coordinate on photomaps of two separate times. For example, the red arrow in Fig.1 shows dHSI when the color changes from blue to red.
2 values for the former photomap
H2, S2, and I2 are the hue, saturation, and intensity pixel values for the latter photomap
x1, y1, and z1 are the coordinates of the HSI color pixel value in the HSI color model for the former photomap
x2, y2, and z2 are the coordinates of the HSI color pixel value in the HSI color model for the latter photomap. 2.3 Texture change extraction
In order to extract pattern changes for buildings such as a change in the buildings material, we extracted texture changes calculating the standard deviation from a grayscale histogram. That is to say, the difference between two standard deviations for two different periods can be used to extract changes in building textures because this difference indicates differences in pattern fineness.
Standard deviations for the two periods were calculated next two steps. First, RGB photomaps were converted into grayscale photomaps using equation (6) that uses NTSC coefficients defined by ITU-R BT.601 (ITU, 2011). Second, the standard deviation values were calculated for each mesh (= 5 × 5 pixels) in grayscale photomaps.
The texture changed value (dT) was defined by equation (7) as a difference between the standard deviation values for the two periods. In addition, dT was calculated at the same mesh position on photomaps of two separate times.
2
where σ1 is the standard deviation for the former photomap σ2 is the standard deviation for the latter photomap. 2.4 Change extraction
To extract changed buildings with a low risk of missing changes in buildings, we perform change extraction using both color and texture changes. Fig.2 shows the change extraction concept. The numbers in Fig.2 show the changed values of color and texture. First, we temporarily set thresholds for change values for color and texture at 5, and then we execute a labeling process towards the target pixels having four neighbors and change value than the threshold. Second, we extract the region with color and texture changes in which the sum of adjacent pixels is more than 8 pixels. In Fig.2, yellow pixels show a region with color International Archives of the Photogrammetry, Remote Sensing and Spatial Information Sciences, Volume XXXIX-B5, 2012
Finally, the union of the regions having color and texture changes is the changed region in this study. These are the purple pixels in Fig.2. Incidentally, the sum of the labeled pixels falls under the area in actuality; details of thresholds decision for the changed values and area are expressed in the next subsection.
Fig.2. Change extraction concept 2.5 Thresholding
The thresholds for the changed values of the method used in the past was decided that detailed changed buildings can be able to extract. However, visually searching detailed changed buildings on photomaps before the extraction process as well as over-extraction of changed buildings have been unsolved issues. Therefore, for automatic thresholding and reduction of over-extraction of changed buildings, the thresholds for changed values in this study were divided into two categories. A region is shaded region in both time whose changes such as color or texture is subtle, another region is other regions (shaded region in old time and not shaded region in new time; not shaded region in old time and shaded region in new time; not shaded region in both time) whose changes are clear. To explain, first, we extracted a shaded region in each photomap for the two periods using Suzuki’s method (Suzuki et al., 2011) and divided the shaded region in both times and other regions. Second, we created four histograms (color changed value for shaded region in both times; color changed value for other regions; texture changed value for shaded region in both times; and texture changed value for other regions). Last, the thresholds were decided automatically by Otsu’s method (1980) from each histogram, which was segmented into two parts. For extraction of detailed changed buildings such as extended and reconstructed buildings, the threshold for the area was 10 m2.
3. TEST DATA
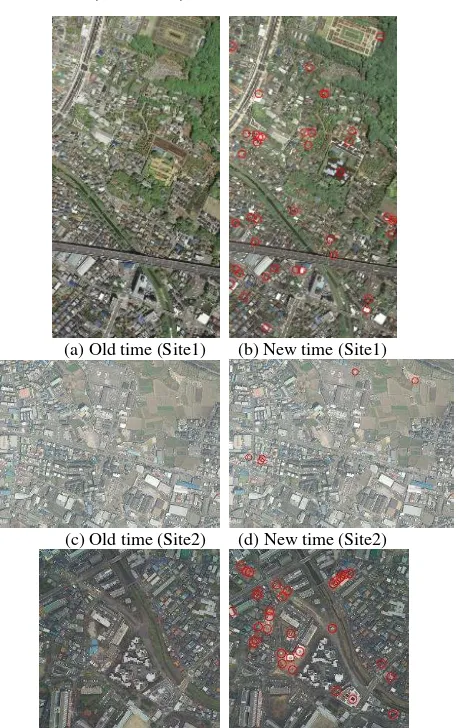
The test data are three pairs of photomaps taken at two separate times, as shown in Fig.3. Table 1 gives the information contained in photomaps. There were differences in color tone on photomaps for each site. Therefore, the photomaps were corrected by converting the color tone in the photomap in the former time to the color tone on photomap in the latter time. As a result, color tones on photomaps were similar at both sites. Changed buildings are shown by a red circle on the photomap of the former time. A visual check confirmed that there were 61 changed buildings (of 1034 buildings) in Site1; there were 5 changed buildings (of 808 buildings) in Site2; and 38 changed buildings (of 395 buildings) in Site3.
(a) Old time (Site1) (b) New time (Site1)
(c) Old time (Site2) (d) New time (Site2)
(e) Old time (Site3) (f) New time (Site3) Fig.3. Photomaps and changed buildings (red circle)
Table 1. Photomap information
Site1 Site2 Site3
Date 2009/4
2010/5
2011/1 2011/4
2010/11 2012/ 2
Scale 1/7000 1/20000 1/18000
Color depth 8bit RGB
Area [km2] 0.48 0.48 0.23
Size [m] 500 × 960 800 × 600 480 × 480
Resolution [cm] 20
4. RESULTS AND DISCUSSION
4.1 Shaded region extraction
A part of the shaded region extraction in Site1 is shown in Fig.4. Fig.4 (a) and (b) show photomaps in old and new time. Fig.4 (c) and (d) show extracted regions as shaded regions (blue). It was confirmed that the shaded region and a few black roofs were extracted. Table 2 shows the ratios of shaded region in both times and other regions compared to the whole area used in the photomaps. The area in the shaded region in both times was less than in other regions in all sites.
(a) Photomap in old time (b) Photomap in new time
(c) Shaded region in old time (d) Shaded region in new time Fig.4. Result part of shaded region extraction in Site1 Table 2. Ratios of shaded region in both times and other regions
Site1 Site2 Site3 Shaded region in both time 11.7% 12.3% 23.9%
Other regions 88.3% 87.7% 76.1%
4.2 Thresholds for changed values
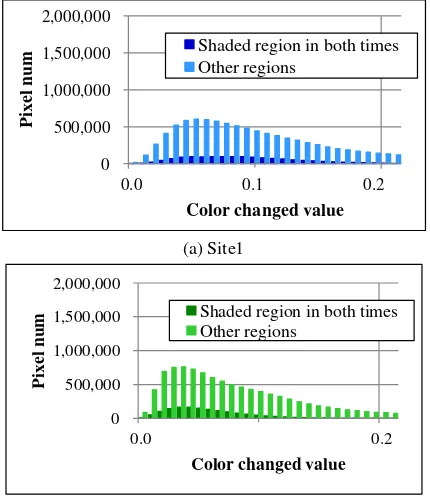
Histograms for the color changed values in each site are shown in Fig.5. Because of the areas in other regions in all sites are large and color changes are clear, the appearance pixels in other regions were larger than in shaded region in both time. Table 3 shows the thresholds for the color changed values in each site calculated from the histograms for the color changed values by Otsu’s method. Because of the histogram shape for the color changed values, the thresholds for color changed values in other regions were large in all sites.
Histograms for the texture changed value in each site are shown in Fig.6. For the same reasons as for color change, it was confirmed that the appearance pixels in the other regions was large. The thresholds for the texture changed values are shown in Table 4; the thresholds for the texture in other regions were large in all sites.
0 500,000 1,000,000 1,500,000 2,000,000
0.0 0.1 0.2
Pixe
l
num
Color changed value Shaded region in both times Other regions
(a) Site1
0 500,000 1,000,000 1,500,000 2,000,000
0.0 0.2
Pixe
l
num
Color changed value Shaded region in both times Other regions
0 500,000 1,000,000 1,500,000 2,000,000
0.0 0.2
P
ixel
n
u
m
Color changed value Shaded region in both times Other regions
(c) Site3
Fig.5. Histograms for color changed value Table 3. Thresholds for color changed value
Site1 Site2 Site3 Shaded region in both time 0.11 0.07 0.08
Other regions 0.25 0.25 0.20
0 500,000 1,000,000 1,500,000 2,000,000
0.0 12.5
Pixe
l
num
Texture changed value Shaded region in both times Other regions
(a) Site1
0 500,000 1,000,000 1,500,000 2,000,000
0.0 12.5
P
ixel
n
u
m
Texture changed value Shaded region in both times Other regions
(b) Site2
0 500,000 1,000,000 1,500,000 2,000,000
0.0 12.5
P
ixel
n
u
m
Texture changed value Shaded region in both times Other regions
(c) Site3
Fig.6. Histograms for texture changed value Table 4. Thresholds for texture changed value
Site1 Site2 Site3 Shaded region in both time 22.5 20.5 25.5
Other regions 27.5 22.5 29.5
4.3 Changed buildings extraction
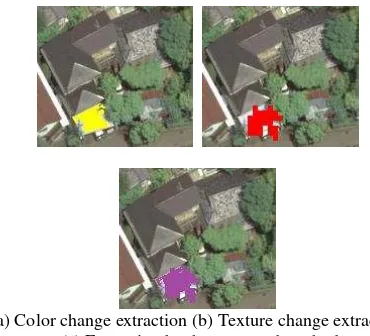
A part of the extraction region in Site1 as the extraction results of changed buildings are shown in Fig.7, which is the same location as that shown in Fig.4. It was confirmed that the changed building was extracted by each of the three change extraction methods.
(a) Color change extraction (b) Texture change extraction (c) Extraction by the proposed method
Fig.7. Result part of extraction regions in Site1 Table 5 shows the extraction results of changed buildings in Site1. The results of color change extraction only were 617 extracted regions, 60 extracted changed buildings, and 1 not extracted changed building. The result of texture change extraction only was 962 extracted regions, 56 extracted changed buildings, and 5 not extracted changed buildings. However, the results obtained by using the proposed method, which uses both color and texture, was no extracted changed buildings though 1062 extracted regions were large.
Fig.8 and Fig.9 show the changed buildings not extracted by each change extraction. The reason the method using color or texture individually could not extract all the changed buildings is that color or texture changes were subtle. For extractions of all these changed buildings, we can consider that we change the each threshold for changed value to less value. However, changing less thresholds value is not relevant because of extractions for many subtle feature changes on all regions of the photomaps. Therefore, it is possible to extract changed buildings effectively by the proposed method whose methodology is that color change extraction extracts changed buildings not extracted by texture, and texture change extraction extracts changed buildings not extracted by color.
Table 5. Extraction results of changed buildings in Site1
Color Texture Proposed method
All buildings 1034
Changed buildings 61
Regions extracted 617 962 1062
Changed Buildings
extracted (not extracted) 60 (1) 56 (5) 61 (0)
Over-extraction 557 906 1001
(a) Old time (b) New time
Fig.8. Changed buildings not extracted by color extraction
(a) Old time (b) New time
Fig.9. Changed buildings not extracted by texture extraction In order to compare the methods between the proposed method and the past method, Table 6 shows the extraction results by the past method in Site1. Compared to Table 5, the proposed method extracted all changed buildings though extracted regions were less than those extracted by the past method.
Table 6. Comparison results between the proposed method and the past method in Site1
Color Texture Proposed method
All buildings 1034
Changed buildings 61
Regions extracted 624 1673 1485
Changed Buildings
extracted (not extracted) 58 (3) 58 (3) 61 (0)
Over-extraction 566 1615 1424
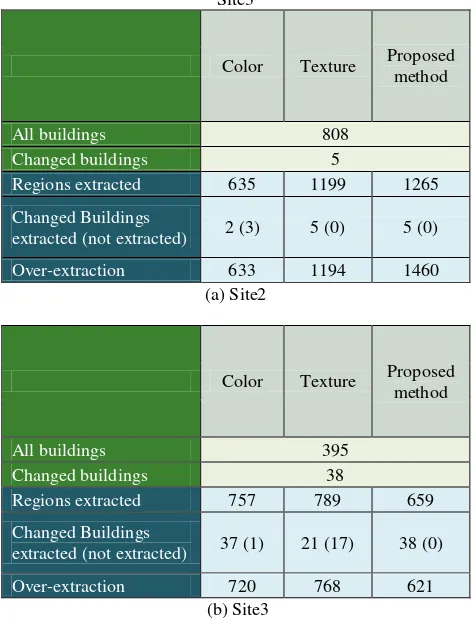
In order to appraise with the proposed method on various locations, Table 7 shows the extraction results for changed buildings in Site2 and Site3. All extracted changed buildings were extracted by the proposed method.
Table 7. Extraction results of changed buildings in Site2 and Site3
Color Texture Proposed method
All buildings 808
Changed buildings 5
Regions extracted 635 1199 1265
Changed Buildings
extracted (not extracted) 2 (3) 5 (0) 5 (0)
Over-extraction 633 1194 1460
(a) Site2
Color Texture Proposed method
All buildings 395
Changed buildings 38
Regions extracted 757 789 659
Changed Buildings
extracted (not extracted) 37 (1) 21 (17) 38 (0)
Over-extraction 720 768 621
(b) Site3
From these results, it was determined that the proposed method can extract changed buildings automatically and efficiently on various locations.
5. CONCLUSIONS
In this study, we proposed an efficient and automatic extraction method for changed buildings using only photomaps of two separate times. As a result, we reached the following two conclusions.
Although all changed buildings were not extracted by using color or texture information individually, using both color and texture information makes it possible to effectively extract changed buildings.
Considering automatic thresholding and limiting information gained from photomaps for extraction, we can extract changed buildings more efficiently than we could with previous methods.
The proposed method can reduce oversight of changed buildings by intensively visually examining extracted regions that have color or texture changes rather than visually examining all regions of photomaps. Therefore, the proposed method can contribute to making building investigations more efficient. It is necessary to consider further reduction of over-extraction of changed buildings in the future.
REFERENCES
ITU, Recommendation ITU-R BT.601-7, 2011.
http://www.itu.int/dms_pubrec/itu-r/rec/bt/R-REC-BT.601-7-201103-I!!PDF-E.pdf (accessed 16 Apr. 2012)
Matsuoka, M. and Yamazaki, F., 2002. Application of A Methodology for Detecting Building-Damage Area to Recent Earthquakes Using Satellite SAR Intensity Imageries And Its Validation. Journal of structural and construction engineering, No.558, pp.139-147.
Mitomi, H.; Matsuoka, M. and Yamazaki, F., 2002. Building Damage Detection from Aerial Television Images by Maximum Likelihood Classifier and Its Application to Early Damage Assessment. Proceedings of JSCE, No.717/I-61, pp.137-148. Miura, H.; Midorikawa, S. and Fujimoto, K., 2004. Automated Building Detection from High-Resolution Satellite Image for Updating GIS Building Inventory Data., 13th World Conference on Earthquake Engineering, Paper No. 678. Otsu, N., 1980. An Automatic Threshold Selection Method Based on Discriminant and Least Squares Criteria, The transactions of the institute of Electronics and Communication Engineers of Japan, IECE J63-D(4), pp.349-356.
Suzuki, H. and Chikatsu, H., 2011. Shadow Correction in High Dynamic Range Images for Generating Orthophotos, Proceedings of SPIE on Videometrics, Range Imaging and Applications XI, Vol.8085, pp.80850N-1-80850N-9.
Tanauchi, Y. and Chikatsu, H., 2011. Efficient Extraction for Change Detection of Building Shapes for Fixed Property Research. Journal of applied survey technology, Vol.22, pp.33-42.