COMBINED GEOMETRIC/RADIOMETRIC POINT CLOUD MATCHING
FOR SHEAR ANALYSIS
S. Gehrke
North West Geomatics Ltd., Suite 212, 5438 - 11
thStreet NE, Calgary, Alberta, T2E 7E9, Canada
–
[email protected]
Commission III, WG III/2
KEY WORDS: Geometry, Radiometry, Adjustment, Matching, Point Cloud, High Resolution, Quality
ABSTRACT:
In the recent past, dense image matching methods such as Semi-Global Matching (SGM) became popular for many applications. The SGM approach has been adapted to and implemented for Leica ADS line-scanner data by North West Geomatics (North West) in
co-operation with Leica Geosystems; it is used in North West’s production workflow. One of the advantages of ADS imagery is the
calibrated color information (RGB and near infrared), extending SGM-derived point clouds to dense “image point clouds” or, more general, information clouds (info clouds).
With the goal of automating the quality control of ADS data, info clouds are utilized for Shear Analysis: Three-dimensional offsets of adjacent ADS image strips are determined from a pattern of info cloud pairs in strip overlaps by point cloud matching. The presented approach integrates geometry (height) and radiometry (intensity) information; matching is based on local point-to-plane distances for all points in a given cloud. The offset is derived in a least squares adjustment by applying it to each individual distance computation equation. Using intensities in addition to heights greatly benefits the offset computation, because intensity gradients tend to occur more frequently than height gradients. They can provide or complement the required information for the derivation of planimetric offset components. The paper details the combined geometric/radiometric point cloud matching approach and verifies the results against manual measurements.
KURZFASSUNG:
Dichte, pixelbasierte Bildzuordnungsverfahren wie das Semi-Global Matching (SGM) gewinnen zunehmend an Bedeutung für verschiedene Anwendungsbereiche. SGM ist von North West Geomatics (North West) in Zusammenarbeit mit Leica Geosystems für den ADS Zeilenscanner implementiert worden; es wird bei North West in der Produktion eingesetzt. Ein Vorteil der ADS sind die kalibrierten Farbkanäle (RGB und nahes infrarot), welche die SGM-basierten Punktwolken zu „Informationswolken“ (Info Clouds) verallgemeinern.
Mit dem Ziel der Automatisierung der Qualitätskontrolle von ADS-Blöcken werden solche Punktwolken zur Analyse der relativen geometrischen Genauigkeit (Shear Analysis) genutzt: Dreidimensionale Differenzen zwischen benachbarten ADS-Bildstreifen werden in einem vorgegebenen Muster von paarweise abgeleiteten Punktwolken in Überlappungsbereichen bestimmt. Der vor-gestellte Ansatz integriert die geometrische Information (Punkthöhen) und die radiometrische Information (Intensitäten); die Zuordnung basiert auf Punkt-Ebene-Abständen für alle Punkte in der Wolke. Der mittlere Abstand wird in einer Kleinste-Quadrate-Ausgleichung bestimmt, wobei dieser in jeder einzelnen Abstandsberechnung als Unbekannte angesetzt wird. Die Erweiterung der zunächst geometriebasierten Zuordnung um die Intensitäten ist von entscheidendem Vorteil, da Intensitätsgradienten häufiger als Höhengradienten auftreten und damit zusätzliche Daten vor allem zur Berechnung der planimetrischen Abstandskomponenten bereitstellen können. Der Beitrag zeigt den integrierten geometrisch-radiometrischen Zuordnungsansatz und verifiziert die Ergeb-nisse im Vergleich zu manuellen Messungen.
1. INTRODUCTION
Dense image matching – such as the Semi-Global Matching (SGM) method (Hirschmüller, 2005, 2008) – is currently be-coming popular for a broad variety of applications. Highly optimized implementations enable a fast collection of point clouds in the resolution of the input imagery and, based on that, the derivation of high-resolution Digital Surface Models. More-over, a point cloud is a very useful data set in itself, especially if the geometry is combined with the color data of the underlying imagery. Hence the point cloud becomes an information cloud (info cloud) that provides high-density and high-quality geo-metric and radiogeo-metric information (Gehrke et al., 2011).
In the context of this research, we aim for utilizing info clouds to automate the quality control (QC) for Leica ADS line-scan-ner data. The current geometry QC process is two-fold: Abso-lute block accuracy is verified with ground control points and relative agreement between individual ADS flight lines (strips) is determined from stereo measurements of well-defined check points in the strip overlap areas. All such points are manually measured, and the three-dimensional point offsets in-between adjacent strips are used to derive QC parameters, e.g. root mean square (RMS) values for the block. Due to the number of strip-to-strip check points required, this is a costly process in both elapsed time and man-hours (Gehrke et al., 2012).
The automation of the relative geometric QC is based on a very large number of patches of SGM-derived info clouds rather than comparatively few individual point measurements per overlap. It makes use of the SGM implementation by Gehrke et al. (2010, 2011, 2012), which provides info clouds based on all panchromatic stereo views of the ADS. Panchromatic intensity as well as full, calibrated color information from ADS RGB and near infrared bands is assigned to each individual point. That information is used in a combined geometric/radiometric point cloud matching that provides three-dimensional offsets for a pattern of patches along overlapping ADS strips. This method
has been coined “Shear Analysis” and is now becoming a tool
for North West to automatically evaluate and verify the geo-metric quality of ADS data and products. Shear Analysis is being applied to flight recordings or image blocks before and/or after aerial triangulation.
The basic idea behind the geometric/radiometric point cloud matching is least squares (image) matching. It is, in that regard, similar to the approaches of Maas (2002) or Akca (2007), who base their matching on triangulated irregular networks (TIN) or, respectively, gridded surface representations. Here the surface is locally approximated by planes, generally based on more than the minimum of three points (as in a TIN). Point-to-plane dis-tances are used in the matching algorithm, which is described and evaluated in the remainder of this paper. Results from both the geometric and the combined geometric/radiometric ap-proach are compared with manual measurements, based on different ADS data sets from North West’s production. The use of the derived offsets in QC and interactive Shear Analysis is only indicated in this paper; for the detailed investigation of an ADS block see Gehrke et al. (2012).
2. POINT CLOUD MATCHING APPROACH
The computation of ADS strip offsets for Shear Analysis is based on the automatic definition, derivation, matching, and evaluation of info cloud pairs. Below the point cloud matching is initially explained using solely the geometry information – which is a valid method by itself – and then extended to include the radiometry that is provided in the info clouds.
2.1 Info Cloud Derivation and Properties
The collection of info clouds is based on SGM, carried out on two panchromatic stereo views available from the ADS sensor: nadir/backward and nadir/forward. It generates info clouds of very high density in the order of the ground sample distance (GSD), which allows for the application in small patches of a few hundred pixels square (Figure 1).
Figure 1. Corresponding info clouds from overlapping ADS strips, based on image patches of 512 x 512 pixels.
The ADS sensor has a high quality GPS/IMU and a well-known interior orientation. This is of advantage for the point cloud matching in two ways: First, the expected offset between corres-ponding info clouds typically lies within a few image pixels or GSD units and, second, the relative scale and rotations are negligible. The fact that corresponding patches for Shear Analy-sis are derived near the edges of ADS image at very different view angles leads to different surface representations and es-pecially to reverse gaps in case of occlusions as illustrated in Figure 1.
2.2 Geometric Point Cloud Matching
The main challenge to point cloud matching is that points are discrete samples of a continuous surface. The correspondence between individual points does generally not exist, and a means of a surface representation is required. There is a broad variety of solutions for point cloud matching or, respectively, iterative closest point algorithms for various purposes and based on different assumptions and preconditions; see overviews in Ru-sinkiewicz & Levoy (2001) or Akca (2007).
A simple yet robust method to match inherently close point clouds is based on point-to-plane distances, i.e. the local appro-ximation of the surface by planes (cp., e.g., Chen & Medioni, 1991). For all points in the reference cloud, a plane is fit to those points of the corresponding match cloud that are located in a small radius around each reference point. All valid point/ plane pairs are then combined in a least squares adjustment, in which the average three-dimensional offset is estimated.
2.2.1 Local Plane Fit: Any point location ( , , ) on a plane can be described by the Hessian Normal Form, in equation (1) based on the unit normal vector ( , , ) and the distance to the origin of the coordinate system:
(1)
With the unit normal vector’s length condition, it can be seen
that a minimum of three points is needed to define a plane – as, e.g., in a TIN surface representation as proposed by Maas (2002) or Akca (2007) for matching LiDAR point clouds. Com-pared to LiDAR, the SGM-derived info clouds typically feature much higher point density, however, along with slightly lower accuracy in height (Gehrke et al., 2010). The resulting relative noise level – especially in vegetation – as well as the afore-mentioned gaps due to occlusions (Figure 1) are addressed by fitting a plane to all points that are located in a GSD-dependent neighborhood in the match point cloud. This allows for the elimination of outliers and noise reduction; larger gaps are in-herently omitted if there are no points to compute a plane.
The plane fit to a local sub-set of an info cloud is carried out in a least squares adjustment. The observation equations are de-rived from equation (1) by division by nZ and making Z the dependent variable. This modeling corresponds to the info cloud collection by dense image matching, in which disparities and, based on that, (stochastic) heights are derived for all (fixed) image pixel locations:
(2)
Such observation equations for each point ( , , ) in the defi-ned neighborhood lead to a linear least squares adjustment with the unknown parameters , , and . The unit normal vector
( , , ) and the Euclidian distance can be derived after-wards by division by the length of ( , , ), with . International Archives of the Photogrammetry, Remote Sensing and Spatial Information Sciences, Volume XXXIX-B1, 2012
The elimination of outlier points is carried out iteratively, based on data snooping, which eventually provides reliable plane fits for the match cloud. Now let the corresponding point in the reference cloud define a local coordinate system in which the plane fit is computed. Then the resulting distance is the initial point-to-plane distance for that location. It is used to identify outliers in the reference cloud and, in combination, provide reliable point/plane pairs along with their stochastics to the sub-sequent point cloud matching.
2.2.2 Offset Derivation: Point/plane pairs from correspon-ding info clouds are used to derive their overall three-dimen-sional offset. This is computed in a least squares adjustment by introducing the unknown parameters ( , , )
into each individual plane’s Hessian Normal Form, aiming to match the individual point-to-plane distances derived above. Based on (1), the observation equations read as follows:
(3)
The selection of the distance as observable allows for weight-ing the observation equations by the quality of the plane fit in such a way that weaker planes with larger standard deviations are rewarded less influence for the offset computation than more robust plane fits. Practical tests confirm that this weight-ing is critical for a meanweight-ingful offset computation.
Even though equation (3) is linear and, accordingly, this very adjustment could be solved without iterating, the surface ap-proximation by local planes has to be refined. Therefore, the overall solution is computed iteratively, applying the resulting offset to improve local plane locations as described above. This iteration is carried out until the offset increment becomes in-significant, i.e. well below the GSD.
2.3 Combined Geometric/Radiometric Approach
For point clouds from nadir-looking sensors, geometric mat-ching alone does constrain the vertical offset component in virtually all cases. However, horizontal correlation becomes weak if the data lack significant height gradients in different directions, which is obviously the case in flat terrain but also on oriented slopes such as building roofs, especially considering the small patch size used for the purpose of Shear Analysis.
This issue has been addressed by several algorithms that utilize any available information on intensity to either assist the geo-metric matching (Weik, 1997) or extend it towards a combined solution (Maas, 2002; Akca, 2007). Intensity gradients tend to occur more frequently than height gradients; they can provide or complement the required information for the derivation of planimetric offsets. Therefore, it suggests itself to use this additional information, which is available from the info clouds, and integrate it with the geometric point cloud matching into a combined adjustment.
2.3.1 Adjustment Extension to Intensity: In analogy to the height , the intensity or, respectively, digital number is an attribute of a point’s planimetric location ( , ). Accordingly, the functional models for the integration of geometry and radiometry can be written the same way, the first using height gradients (from local , , planes), the second intensities (local , , planes); the underlying idea is the well-known least squares (image) matching. The above-described local plane fits, applied to both heights and intensities, provide a pair of obser-vation equations, (3) and (4), for each reference point for the combined geometric/radiometric least squares adjustment.
2.3.2 Histogram Adaptation: The unavoidable difference in viewing geometry as well as potential illumination or even temporal differences can result in radiometric differences in the overlapping ADS image data and, accordingly, in the corres-ponding info clouds. Those differences are compensated as part of the combined adjustment by applying brightness and contrast correction terms, and . Similar to (3), with the heights re-placed by corrected intensities, the radiometric observation equations read:
(4)
This adjustment features a total of five unknown parameters: the three-dimensional offset as well as the required contrast and brightness adaptation. It is obvious that the additional equations (4) can only provide immediate constraints on the and components. The is determined by equation (3). However, the planimetric offset is part of both (3) and (4); the latter of which therefore has some (indirect) impact on the re-sulting height offset, too.
2.3.3 Weighting between Geometry and Intensity is based upon their group variances: If balanced properly, the relation between these variance components before and after the ad-justment should be identical for height and intensity observation groups. The ratio is used to alter the weights for the intensity equations. This adaption is iterative and, theoretically, needs to be carried out for each adjustment computation. However, it seems feasible to improve weighting along with the overall iteration, considering that the main goal is to level largely dif-ferent orders of magnitude that occur depending on terrain and texture. Test runs have shown weight factors between 1 and greater than 10,000, the latter in very flat regions where the planimetric offset components are almost exclusively deter-mined by intensity.
2.4 Offset Verification
In order to provide reliable offsets for Shear Analysis input, the results of the combined geometric/radiometric matching are verified as part of the computation. First of all, the roles of corresponding info clouds are switched between reference and match cloud, thus providing two independent offset computa-tions that must agree within tight thresholds. The average offset becomes the final result, given that further indicators are mea-ningful. Those include a minimum number of point/plane pairs in a patch, reasonable radiometric corrections as well as the maximum number of iterations. Respective limits can depend on a variety of parameters, predominantly terrain and imaging configuration. Nevertheless, using rather tight general settings – a maximum in the order of 5 to 7 iterations, based on at least 25% point/plane pairs in relation to the number of input image points in a patch – might eliminate some correct results; but as long as offset are attempted to be computed in a fairly dense pattern, there will be sufficient input for the Shear Analysis. Most important is the elimination of false positives.
3. EVALUATION ON DIFFERENT DATA SETS
The combined geometric/radiometric point cloud matching ap-proach was initially verified with synthetic data – heights and intensities assigned to predefined locations – and artificially introduced offsets. Practical validation and Shear Analysis exploration was carried out for a number of ADS blocks with different characteristics. Eventually aiming for the replacement of the manual QC, a crucial part of it was the verification of International Archives of the Photogrammetry, Remote Sensing and Spatial Information Sciences, Volume XXXIX-B1, 2012
automatically derived offsets against those human measure-ments. The comparative analysis of the geometric and the com-bined matching approaches is documented below.
3.1 Data Sets
The ADS test data used here have been captured and processed by North West’s production. In the context of Shear Analysis verification, strip offsets were automatically derived from a very dense, practically continuous pattern of info cloud patches of 512 x 512 image pixels in size (Table 1 and Figure 2); a re-presentative number of manual QC measurements is available.
3.1.1 Georgian Bay: Located on the coast of Lake Huron’s Georgian Bay in Ontario, Canada, this block is dominated by forest. It is in parts dense but generally includes clearings and aisles, and features different tree species of various heights. The imagery has been captured in 2009 for the Ontario Ministry of Natural Resources (OMNR) for forest inventory; it is a typical forest data set.
3.1.2 Lansing: This block, captured in fall 2011, shows the City of Lansing, Michigan, approximately in its center. Accor-dingly, the data contains predominantly urban and suburban areas as well as some forest, fields and smaller lakes.
This block is analyzed in more detail by Gehrke et al. (2012), comparing different georeferencing and also demonstrating the possibilities of Shear Analysis. See also section 5.
3.1.3 New Mexico: This 2011 data set is part of the National Agriculture Imagery Program (NAIP). From a very large ADS block in South-Eastern New Mexico, a single strip overlap was selected for this investigation. It features mountains and flat desert areas with only little vegetation (Figure 2).
Data Set GSD
[m] Terrain Strips Patches Georgian Bay 0.30 Forest, Water 4 113 Lansing 0.30 (Sub-)Urban 14 808 New Mexico 1.00 Mountains 2 378
Table 1. ADS data sets used for verification of the point cloud matching.
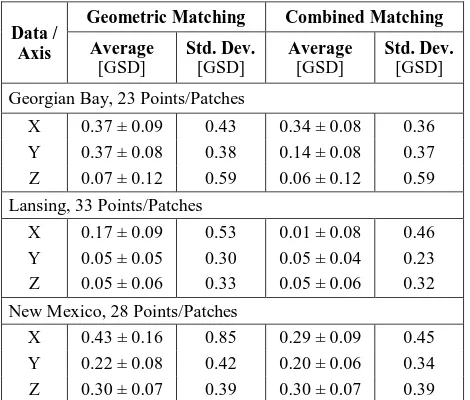
3.2 Accuracy in Comparison with Manual Measurements
One way of verifying the automatically derived ADS strip off-sets is their comparison with manual QC measurements, which are available for all ADS blocks in North West production. This comparison was carried out for all patch locations that feature corresponding measurements, provided that successful and reliable offsets from both solely geometric and combined geo-metric/radiometric point cloud matching exist. (See below for the success rates of both methods.) Resulting averages and standard deviations of the X, Y and Z differences between manually measured and automatically derived strip offsets are shown in Table 2. Note that, even though offset locations on ground are practically identical, the orientation parameters used in their computations differ: Human measurements are naturally based on a stereo pair – ADS backward and forward bands in this case –, but the SGM for the automatic method utilizes all three ADS views to increase redundancy. Especially after aerial triangulation, the impact of remaining orientation errors is ex-pected to be very small but, nevertheless, can act systematically for this comparison. tween manually measured and automatically computed ADS strip offsets.
Looking at the offset differences and standard deviations in Table 2, it can be seen that the combined geometric/radiometric point cloud matching agrees better with manual measurements than the geometric matching. As expected, the consideration of intensity improves planimetric offset components for all data sets. The majority of the average differences is not significant; however, the highest significance level occurs in the forest data set for geometric matching. This can be assigned, at least partly, to the limitations of the approach, but the above-mentioned ori-entation differences might add to that. The largest planimetric discrepancies tend to occur across flight direction. This corres-ponds with the general observation of North West’s production that, after aerial triangulation, remaining orientation inaccura-cies and, therefore, local strip offsets are largest in this direction (but well within customer specifications); see also Gehrke et al. (2012).
Table 3. Offset standard deviations throughout strip overlaps, for Lansing and Georgian Bay RMS values based on all over-laps. The number of manual measurements per overlap in Lan-sing varies between 3 and 5, which is not representative for the derivation of reliable statistics.
Standard deviations of individual offset differences are under 0.5 GSD in case of the combined matching, with the exception of the height component in Georgian Bay. These numbers re-present accumulated errors from human measurements in two overlapping data sets on one hand, and SGM and point cloud matching on the other hand. An attempt to separate these contri-butions is carried out in Table 3, which shows standard devia-tions derived from all offsets in each strip overlap, individually for each method. Such a computation assumes no offset varia-tion along an ADS strip overlap, which is not entirely correct
but, however, the impact is the same for all methods and doesn’t
prevent a comparison.
The numbers in Table 3 confirm the typical accuracy of human stereo measurements (note there are two points required to derive an offset). They also show that the combined automatic approach can achieve better quality, especially for the height component. As already found above, the largest standard devia-tions occur across flight direction. The largest overall number, the X offset standard deviation of geometric matching in the New Mexico data set, is impacted by some erroneous results, which are discussed in the next section.
3.3 Performance on Different Terrain Types
The success rate of the SGM-based info cloud collection and subsequent geometric/radiometric point cloud matching is strongly dependent on the image content – i.e., on the sensor, illumination and viewing geometry and especially terrain pro-perties and their variation within a patch. This is influenced by a multitude of factors, and the interaction of which is highly com-plex. However, image matching requires intensity gradients, and geometric point cloud matching is based on height gradients; the combined approach utilizes both types. Furthermore, the surface approximation by local planes must be valid. Based on those theoretical considerations as well as practical tests on real-world data, different types of terrain can be characterized regar-ding the success rate in proviregar-ding reliable offsets. So far, this performance was investigated on ADS data sets that predomi-nantly include mountains, urban/suburban areas and forests. For the examples discussed here, the percentages of patches that delivered reliable offsets are shown in Table 4.
Data Set Patches Geometric Matching
Combined Matching
Georgian Bay 113 58.4% 77.8%
Lansing 808 74.4% 89.4%
New Mexico 378 66.4% 97.6% Subset: Mountains 132 97.0% 100.0%
Table 4. Percentages of reliable strip offsets, based on the total number of evenly distributed patches.
Mountainous terrain inherently features significant height and intensity gradients, which leads to a high percentage of results, for even up to 100% of the patch locations. The success rate in urban areas can range widely, 60-90%. The same holds true for trees, where it is generally lower, in the order of 20-50% for dense forests, but rapidly increases with the presence of clearings and/or different tree species – i.e. intensity and height gradients –, which is the case in the Georgian Bay block. The main issue, especially in higher vegetation such as trees, is the representation by essentially arbitrarily scattered points, which impacts or even invalidates the approximation by local planes. Patches located entirely in water can be expected to fail.
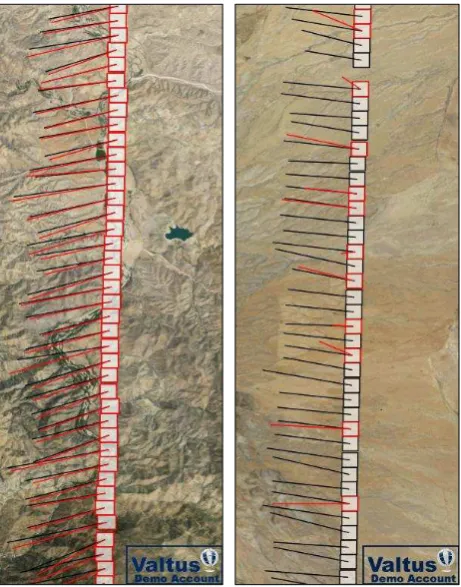
Figure 2. Patch locations and planimetric offset results for the geometric point cloud matching (red) and the combined method (black). Examples for the New Mexico strip overlap; offset vectors scaled by a factor of 1000.
The benefit from the combined point cloud matching over the geometric approach can be clearly seen in Table 4. Success rates are improved for all data sets and all types of terrain. In addition, the resulting offsets are more reliable. The benefit is minor in mountains (Figure 4, left) but immediately obvious in flat areas (Figure 4, right). While offsets from both methods agree well in the first case, the solely geometric matching de-livers a number of erroneous results in the latter example, which were not identified by the offset verification as described in section 2.2. This issue could lead to wrong conclusions in the Shear Analysis.
4. SHEAR ANALYSIS / QUALITY CONTROL
The automated Shear Analysis, based upon the combined geo-metric/radiometric matching of dense info clouds, is currently
becoming a part of North West’s production workflow. For the purpose of QC, patch locations are determined along the center of each ADS strip overlap in a spacing of 1000-5000 pixels. Automatically computed offsets and related statistics for all patches are output into a single, comprehensive report. Based on that, the user is provided excerpts of different kind, in parti-cular: detailed tabular views of all offset parameters that enable examination of the matching; comparison of reliable offsets against QC thresholds; summaries per image overlap as well as for the entire ADS block; graphical outputs of patch footprints and offset vectors with attributes assigned, which allows for an analysis using commercial mapping software such as Global Mapper or ArcGIS. This visualization is the primary tool used in the QC process and for further evaluation.
The large number of valid patches provided from the automatic computation allows for more detailed investigations, e.g. the evaluation of individual strip overlaps. This is expected to assist not only in the very QC process but also in the general analysis of image orientation parameters and aerial triangulation be-havior. These new possibilities are discussed and illustrated for the Lansing block in Gehrke et al. (2012).
5. CONCLUSION
This paper proposed and evaluated an automated approach for Shear Analysis of ADS blocks, based on dense image matching and combined geometric/radiometric point cloud matching. The utilization of the radiometric information from the info clouds was demonstrated to be crucial for the purpose of computing reliable offsets in-between overlapping ADS image strips for two reasons: First, the combined approach is more robust and delivers a larger number of offsets for various types of terrain, resulting in an approximately even coverage throughout large blocks. Second and most important, it delivers more reliable results compared to the solely geometric approach, which is prone to some errors that cannot be automatically detected.
With the goal of replacing the current manual QC measure-ments of strip-to-strip offsets it is noteworthy that the automated approach delivers very similar results with similar or better ac-curacy; it improves especially the height component.
In conclusion, it is shown that the combination of geometric and radiometric information is not only beneficial but crucial to pro-vide both sufficient and correct input for a meaningful analysis of ADS data. Looking beyond current QC requirements, the automated Shear Analysis has already shown to be a very useful tool for the evaluation of image orientation parameters and their impact on geometric product accuracy.
The combined geometric/radiometric point cloud matching and the entire Shear Analysis procedure were implemented for ADS but are not limited to it. They can be applied to any type of (stereo) imagery. The very point cloud matching should be applicable to LiDAR data as well, but this possibility would have to be explored.
6. REFERENCES
Akca, D., 2007. Least Squares 3D Surface Matching. Disser-tation, ETH Zurich, IGP Mitteilung, Vol. 92.
Chen, Y., and G. Medioni, 1991: Object Modeling by Regis-tration of Multiple Range Images. Proc. IEEE Conference on Robotics and Automation, Sacramento, CA.
Gehrke, S., M. Downey, R. Uebbing, J. Welter, and W. La Rocque, 2012: A Multi-Sensor Approach to Semi-Global Mat-ching. Int. Arch. Phot. & Rem. Sens., Melbourne, Australia, Vol. 39, this issue.
Gehrke, S., K. Morin, M. Downey, N. Boehrer, and T. Fuchs, 2010. Semi-Global Matching: An Alternative to LiDAR for DSM Generation? Int. Arch. Phot. & Rem. Sens., Calgary, AB, Vol. 38, Part B1.
Gehrke, S., R. Uebbing, and D. Cain, 2012. Automating Quality Control for Aerial Mapping Using Dense Point Clouds. Proc. ASPRS Annual Conference, Sacramento, CA.
Gehrke, S., R. Uebbing, M. Downey, and K. Morin, 2011. Creating and Using Very High Density Point Clouds Derived from ADS Imagery. Proc. ASPRS Annual Conference, Milwau-kee, WI.
Hirschmüller, H., 2005. Accurate and Efficient Stereo Proces-sing by Semi-Global Matching and Mutual Information. Proc. IEEE Conference on CVPR, New York, New York.
Hirschmüller, H., 2008. Stereo Processing by Semiglobal Matching and Mutual Information. IEEE Transactions on Pattern Analysis and Machine Intelligence, Vol. 30, No. 2.
Maas, H.-G., 2002. Methods for Measuring Height and Planimetry Discrepancies in Airborne Laserscanner Data. Photogrammetric Engineering & Remote Sensing, Vol. 68, No. 9, pp. 933-940.
Rusinkiewicz, S., and M. Levoy, 2001. Efficient Variants of the ICP Algorithm. Proc. 3rd International Conference on 3-D Digital Imaging and Modeling, Quebec City, QC, pp. 145-152.
Weik, S., 1997. Registration of 3-D partial surface models using luminance and depth information. Proc. IEEE Conference on 3DIM, Ottawa, ON, pp. 93-100.