BIDIRECTIONAL REFLECTANCE MODELING OF THE GEOSTATIONARY SENSOR
HIMAWARI-8/AHI USING A KERNEL-DRIVEN BRDF MODEL
M. Matsuoka a, *, M. Takagi b, S. Akatsuka b, R. Honda c, A. Nonomura d, H. Moriya d, H. Yoshioka e a
Faculty of Agriculture, Kochi University, Kochi, Japan - [email protected] b
School of Systems Engineering, Kochi University of Technology, Kochi, Japan c
Faculty of Science, Kochi University, Kochi, Japan d
Faculty of Engineering, Kagawa University, Kagawa, Japan e
School of Information Science and Technology, Aichi Prefectural University, Aichi, Japan
Commission VII, WG VII/1
KEY WORDS: Himawari-8/AHI, Bidirectional Reflectance, Kernel-driven BRDF Model, Geostationary Satellite, Intraday Change
ABSTRACT:
Himawari-8/AHI is a new geostationary sensor that can observe the land surface with high temporal frequency. Bidirectional reflectance derived by the Advanced Himawari Imager (AHI) includes information regarding land surface properties such as albedo, vegetation condition, and forest structure. This information can be extracted by modeling bidirectional reflectance using a bidirectional reflectance distribution function (BRDF). In this study, a kernel-driven BRDF model was applied to the red and near infrared reflectance observed over 8 hours during daytime to express intraday changes in reflectance. We compared the goodness of fit for six combinations of model kernels. The Ross-Thin and Ross-Thick kernels were selected as the best volume kernels for the red and near infrared bands, respectively. For the geometric kernel, the Li-sparse-Reciprocal and Li-Dense kernels displayed similar goodness of fit. The coefficient of determination and regression residuals showed a strong dependency on the azimuth angle of land surface slopes and the time of day that observations were made. Atmospheric correction and model adjustment of the terrain were the main issues encountered. These results will help to improve the BRDF model and to extract surface properties from bidirectional reflectance.
* Corresponding author
1. INTRODUCTION
The surface reflectance of the earth observed by a remote sensor varies depending not only on the target itself but also on the position of the sun and sensor relative to the target; hence it is called bidirectional reflectance. This sometime causes problems in remote-sensing applications for land cover classification and change detection because the same target has different reflectance values, or different land surfaces produce the same signal. On the other hand, bidirectional reflectance is a potential source of information regarding land surface conditions because it reflects the structural and optical properties of a target. The bidirectional reflectance distribution function (BRDF) model is a mathematical expression of bidirectional reflectance that computes the reflectance observed at certain sun-target-sensor geometries. BRDF is a crucial factor in the accurate derivation of land surface albedo, since it is derived by directional integration of the reflectance (Lucht et al., 2000, Pokrovsky et al., 2002, Pokrovsky et al., 2003). Gao et al. (2003) investigated the relations of vegetation structure, which is derived from BRDF model parameters, and land surface type. Tang et al. (2007) developed a leaf area index (LAI) retrieval method by combining the BRDF model and the normalized difference vegetation index (NDVI).
Himawari-8 is a new Japanese geostationary satellite that hosts the Advanced Himawari Imager (AHI). Although its main purpose is to provide meteorological observations for weather forecasting, AHI also has applications in disaster monitoring and land surface analyses by virtue of its improved temporal, spatial, and spectral performances. One advantage of
geostationary satellites over polar-orbiting satellites is their high frequency of observation. Observations are usually made several times per hour to capture the movements of clouds and changes in temperature, whereas polar-orbiting satellites make observations only once or twice during the daytime, which is effective for deriving bidirectional reflectance during short periods when land surface conditions are stable. The observation geometry of geostationary satellites is very different from that of polar-orbiting satellites, as the satellite position relative to the earth's surface is fixed while the solar position varies due to the intraday movement of the sun. Polar-orbiting satellites have a large variation in satellite position, but a relatively smaller change in solar position due to the sun-synchronous sub-recurrent (or recurrent) orbit. Therefore, it is important for the BRDF model to determine the goodness of fit to geostationary data, because the model has previously been applied mostly to polar-orbiting satellites. Pokrovsky et al. (2003) developed and Carrer et al. (2010) evaluated the operational method to estimate the surface albedo from the Spinning Enhanced Visible and InfraRed Imager (SEVIRI) onboard the Meteosat Second Generation (MSG), European geostationary satellite.
The aim of this study was to investigate the bidirectional reflectance of the Himawari-8/AHI geostationary sensor using a BRDF model. A kernel-driven BRDF model was applied to a time series of reflectances in the red and near infrared wave regions for an 8-hour daytime period. The goodness of fit was assessed from the viewpoint of land surface terrain and atmosphere.
2. DATA
2.1 Himawari-8/AHI
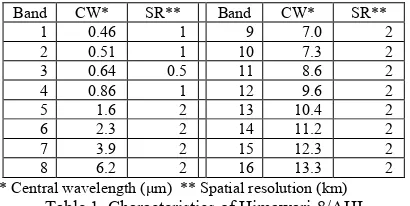
Himawari-8 was launched in October 2014, and has been in normal operation since July 7, 2015. The AHI is an optical sensor with 16 spectral bands ranging from the visible to thermal infrared wave regions. The characteristics of the AHI are shown in Table 1 (Japan Meteorological Agency, 2015). The AHI has five observation areas, i.e., Full Disk, Japan Area, Target Area, and two Landmark areas. Full Disk observes the hemisphere of the earth with a temporal frequency of 10 minutes. Japan Area focuses on Japan and the surrounding area, with 2.5-minute observing intervals. These data are distributed via the Internet from the National Institute of Information and Communications Technology (NICT) Science Cloud (2015) and other organizations.
Band CW* SR** Band CW* SR**
1 0.46 1 9 7.0 2
2 0.51 1 10 7.3 2
3 0.64 0.5 11 8.6 2
4 0.86 1 12 9.6 2
5 1.6 2 13 10.4 2
6 2.3 2 14 11.2 2
7 3.9 2 15 12.3 2
8 6.2 2 16 13.3 2
* Central wavelength (µm) ** Spatial resolution (km) Table 1. Characteristics of Himawari-8/AHI
2.2 Data and Study Area
We used Japan Area data for an 8-hour period from 08:00 to 16:00 on October 14, 2015, when there was little cloud over the study area. There was a total of 192 data points. Red and near infrared wavebands (bands 3 and 4) were used due to their importance for vegetation monitoring.
The study area was Shikoku Island, which is located in the south-western part of Japan. The area is approximately 18,800 km2, with a north to south length of 180 km and a width of 260 km in the west to east direction. The central part of Shikoku is mountainous and covered by forest. Agricultural areas and cities are distributed on the flat plains along the sea and large streams. The study area is shown in Figure 1.
Figure 1. Study area
3. METHOD
3.1 Kernel-driven BRDF Model
We used a kernel-driven BRDF model because it is flexible and requires no explicit ground information other than the observation geometry to express the directional distribution of land surface reflectance. The model is also accepted in the
Moderate Resolution Imaging Spectroradiometer (MODIS) BRDF/Albedo product (Strahler et al., 1999), which is a moderate resolution sensor comparable to the AHI. The model is expressed as the following equation (Lucht et al., 2000, Roujean et al., 1992).
(1)
where ρ = spectral reflectance θs = solar zenith angle θv= view zenith angle
= relative azimuth angle λ = spectral wavelength
kvol, kgeo = volume and geometric kernel
fiso, fvol, fgeo = kernel model parameters
The kvol and kgeo are derived from observation angles i.e., sun-target-sensor geometry, and ρ is the reflectance observed by that observation geometry. The model parameters fiso, fvol, and fgeo, can be adjusted by the number of samples observed during a certain period using multiple linear regression. Several kinds of kernel have been proposed (Pokrovsky et al., 2003). We used two types of volume kernel and three types of geometric kernel (Pokrovsky et al., 2002, Wanner et al., 1995).
For the volume kernel, Ross-Thick and Ross-Thin kernels were selected, although the Ross-Thick kernel is the most widely accepted (Pokrovsky et al., 2002, Tang et al., Strahler et al., 1999).
Ross-Thick [RTK]:
(2)
where
Ross-Thin [RTN]:
(3)
For the geometric kernel, we adopted the Li-Sparse-Reciprocal, Li-Dense, and Roujean kernels (Pokrovsky et al., 2002). In this study, h/b and b/r in the Li-Sparse-Reciprocal kernel were fixed as 2.0 and 1.0, respectively, following Wanner et al. (1995) and Strahler et al. (1999).
Li-Sparse-Reciprocal [LSR]:
(4)
where
,
Li-Dense [LDN]:
(5) Area data were geometrically ortho-rectified from a normalized geostationary projection to Japan plane rectangular projection by bilinear interpolation. We used 500 m resolution digital elevation model (DEM) that was resampled from 10 m resolution original DEM provided by Geographical Information Authority of Japan (http://www.gsi.go.jp). Because the geometric error of the AHI is approximately 1 km in the worst case, geometric correction based on ground control points (Matsuoka et al., 2015) was applied. As a result, the standard deviations of the geometric error of the data were 0.06 and 0.09 pixels in the vertical and horizontal directions, respectively.
3.2.2 Radiometric calibration: Reflectance at the top of the atmosphere was calculated from the digital number based on the Himawari Standard Data User's Guide (Japan Meteorological Agency). No atmospheric correction was applied in this study.
3.2.3 Cloud detection: Simple cloud detection based on the temporal fluctuation of a reflectance time series was applied to mask cloud pixels. Because the temporal resolution of Japan Area data is 2.5 minutes, the continuous change and movement of clouds can be observed. The reflectance time series had larger fluctuations if a pixel was contaminated by cloud. Therefore, we masked the cloudy pixels using the following method:
(1) Maximum and minimum reflectance within 1 hour was computed using 24 data points (60 minutes/2.5 minutes). (2) If the difference between the maximum and minimum
values was larger than 0.06, all of the 24 data points were masked as cloud.
(3) The pixels adjusted to cloud pixels were also masked to mask thin cloud and cloud shadow.
(4) These processes were repeated for 8 hours.
Although the cloud screening resulted in acceptable accuracy, because the cloud area was small and there were large temporal changes in reflectance in our data, this method was rather ad hoc and did not work well for heavy cloud. Cloud detection based on brightness temperature and cloud-free reflectance is preferable in terms of robustness and reliability.
3.3 BRDF Modeling
We investigated the performance of six combinations of BRDF kernels.
3.3.1 Multiple linear regression: To compute the kernel model parameters, multiple linear regression was performed on a pixel by pixel basis using the reflectance time series and kernels. There were 192 samples over the 8-hour period; however, this number was reduced by cloud contamination. If the available sample number was less than 96 (4 hours), the regression was not applied for the pixel. Ocean pixels were also not processed and were masked by the DEM.
3.3.2 Evaluation: The goodness of fit was evaluated by the coefficient of determination adjusted for the degree of freedom (adjusted R2) and by regression residuals. The BRDF-kernel combination was ranked by the average adjusted R2 of all computed pixels. The root mean square (RMS) of regression residuals was derived on a pixel basis to assess the geographical characteristics of the model performance. In addition, the temporal performance was evaluated using the time series of regression residuals.
4. RESULTS AND DISCUSSION
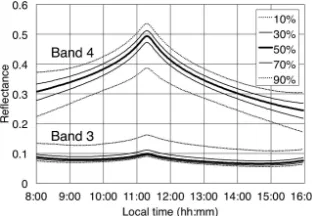
4.1 Temporal Changes in Reflectance
Figure 2 shows the time series of percentile points of reflectance for 8 hours, which were derived from the histogram of each radiance and reflectance increased slightly, especially in band 3, because the solar zenith angle ranged from 70 to 73° at 16:00. The highest reflectances were observed at 11:20 in both bands because the solar and satellite azimuth angles were closest to each other at this time, i.e., the fraction of the observation affected by shadow was minimized at this sun-target-sensor geometry.
Figure 2. Time series of the percentile of reflectance
4.2 Performance by Kernel Combinations
Table 2 shows the average adjusted R2 for all kernel combinations, calculated using all of the pixels. The bold black and bold gray frames indicate the best and second best kernel combinations, respectively. With regard to the volume kernel, the Ross-Thin kernel was better in band 3, but the Ross-Thick kernel was better in band 4. For the geometric kernel, the L-Sparse-Reciprocal and Li-Dense kernels displayed similar performance. Figure 3 shows the time series of the percentile other hand, the Ross-Thin kernel had a smooth concave shape at noon, and was hence better in band 3. The two geometric kernels displayed similar trends, and hence there were only small differences in the adjusted R2 between the Li-Sparse-Reciprocal and Li-Dense kernels. If we suppose a single combination of kernels is adopted for both bands, Ross-Thick/Li-Dense and Ross-Thin/Li-Sparse-Reciprocal showed almost same scores in adjusted R2. Ross-Thick/Li-Dense model
might be better because it showed higher score in band 4 in which reflectance showed higher intra-day variation.
Kernels Band 3 Band 4
RTK-LSR 0.828 0.935
RTK-LDN 0.858 0.948
RTK-RJN 0.744 0.859
RTN-LSR 0.898 0.914
RTN-LDN 0.894 0.890
RTN-RJN 0.835 0.880
Table 2. Average adjusted R2 by kernel combinations
Figure 3. Time series of the percentile of bidirectional reflectance distribution function (BRDF) kernels
(top: volume kernel, bottom: geometric kernel)
4.3 Kernel Parameters
Figure 4 shows the kernel parameters fiso, fvol, and fgeo for the best combinations, i.e., the Ross-Thin and Li-Sparse-Reciprocal kernels for band 3, and the Ross-Thick and Li-Dense kernels for band 4. The white areas around the south-east peninsula and other small areas are unprocessed pixels due to cloud contamination lasting over 4 hours. The total number of processed pixels was 99,610. The fiso in band 3 was lower in the forest over the mountainous area, and higher in agricultural and built-up areas on the flat plains. The fiso is regarded as isotropic reflectance (Gao et al., 2003), and corresponds to the characteristics of reflectance due to land cover. The other five parameters were affected by the terrain in the study area.
Figure 4. Bidirectional reflectance distribution function (BRDF) model parameters: fiso, fvol, fgeo (left: band 3, right: band 4)
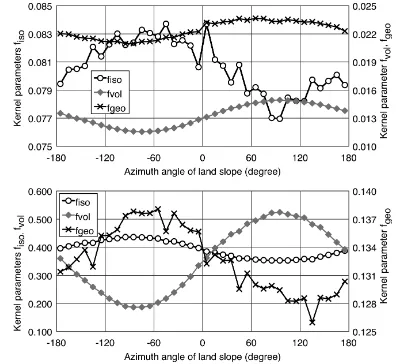
Figure 5 shows the average parameters of kernels by the azimuth angle of land slope derived in 1° steps. The azimuth angles were calculated from the 100-m resolution DEM (ellipsoidal height) shown in Figure 6. Although the variations in parameters within a 1° range were large, the averages showed a clear relation to the azimuth angle of land slopes. Each kernel had its highest and lowest peaks around ±70 to 80°, i.e., east- and west-facing slopes.
Figure 5. The kernel parameters against azimuth of land slopes (top: band 3, bottom: band 4)
Figure 6. Terrain of the study area
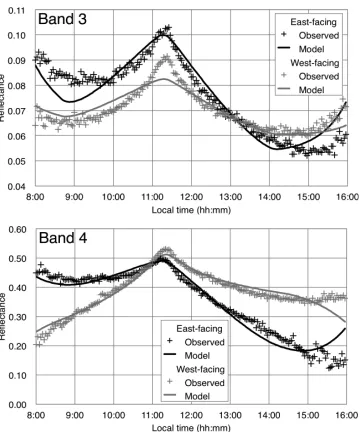
Figure 7 shows the time series of the reflectance for 8 hours extracted from two pixels, which were facing east and west. The modeled reflectances derived using the best kernel combinations are shown by solid lines. On east-facing slopes, reflectance was higher in the morning and lower in the evening, compared to west-facing slopes. This was mainly due to the local zenith angle rather than reflectance from the land surface itself, or atmospheric path radiance. The azimuth angle dependency of the kernel parameters was the result of the use of linear regression to express this terrain-induced trend in reflectance.
Figure 7. Time series of observed and modeled reflectance on east- and west-facing slopes
4.4 Regression Residuals
Figure 8 shows the RMS of the residuals of multiple linear regression. Band 3 had smaller residuals than band 4 because of the smaller changes in reflectance during daytime. Agricultural and built-up areas had larger residuals than the forested area due to the local variance of reflectance in the former land cover. However, forest had smaller local variation in the red waveband because of the homogeneous land cover by artificial forests in this area. Weak vertical stripes were identified in band 3, which seem to be noise in the data. Low level stripe noise has been identified in AHI standard data. It persisted and was enhanced in the regression residuals due to its magnitude being comparable to that of the regression residuals in the land reflectance itself.
Figure 8. The root mean square (RMS) of the residuals of regression (top: band 3, bottom: band 4)
Figure 9 shows the average RMS of residuals by the azimuth angle of land slope derived in 1° azimuth-angle steps. The trends between bands were the reverse of each other. The BRDF model in band 3 had a better fit on east- to north-facing slopes, but band 4 had a better fit on west-facing slopes. These results also confirm the azimuth dependency of the kernel parameters indicated above.
Figure 9. The root mean square (RMS) of residuals against azimuth angles of land slopes
Figure 10 shows the time series of percentile points of regression residuals. The two bands displayed similar trends in residuals, although magnitudes were larger in band 4. The local peak at 11:20 corresponds to the peak in daily reflectance when the sensor and solar azimuth angles were similar and the least shadow was observed. Reflectance changed rapidly over this period and a sharp peak was observed (figures 2 and 7). However, the BRDF model could not express these sharp peaks because of the smooth changes in kernels (figures 3 and 7).
Another characteristic was the larger geographical variations in the morning and evening. In these periods, reflectance increased slightly due to the lower solar zenith angle and atmospheric path radiance. Even though the volume kernel increased in the morning and evening (Figure 3), it could not fully express the temporal changes in reflectance (Figure 7). Reflectance was not atmospherically corrected in this study and therefore there was a large change with an increase in the solar zenith angle.
Figure 10. Time series of the percentile of regression residuals
4.5 General Discussions
The coefficient of determination (adjusted R2) was high in both wavebands for the best kernel combination, i.e., 0.90 for the red and 0.94 for the near infrared as an average of the area. This
indicates the effectiveness of the kernel-driven BRDF model for geostationary satellites, due to the difference in observation geometry compared to polar-orbiting satellites. Despite this, it would be useful if the kernels responded to the large variation in solar position, because relatively large residuals were observed for the higher and lower reflectances at noon and in the morning/evening, respectively. A large number of geostationary satellite observations would help to evaluate and improve the BRDF model in combination with the data from polar-orbiting satellites.
Kernel parameters were affected far more by terrain (especially the azimuth angle of a slope) than by vegetation properties, such as structure and/or the LAI because the study area was mountainous, with large variation in illumination conditions. One possible adjustment would be to calculate the kernels using local observation geometry derived from a DEM. This is the most straightforward adjustment from an operational viewpoint; however, the kernel would be unstable if the solar or sensor zenith angle were large in terms of cosθ or tanθ. Further investigations are necessary regarding the use of this terrain-induced bidirectional reflectance to extract vegetation information.
Atmospheric correction is another important issue in this study. The data used were not corrected atmospherically and reflectance seemed to increase slightly in the morning and evening due to atmospheric path radiance. Although a sufficient number of samples was available for regression during noontime observations, a wide range of geometries is required for more robust modeling. Atmospheric correction is therefore an important factor in the BRDF modeling of geostationary satellite data, and is a major issue to tackle in future studies.
5. CONCLUSION
A kernel-driven BRDF model was applied to an 8-hour reflectance time series from Himawari-8/AHI to model intraday changes in bidirectional reflectance. For the volume kernel, the Thin kernel was selected for the red band and the Ross-Thick kernel was selected for band 4 because of the relatively large increase in near infrared reflectance at noontime, whereas red reflectance increased in the morning and evening. The geographical distribution of kernel parameters reflected the strong influence of terrain on the temporal changes in reflectance within a day. East- and west-facing slopes displayed different trends in kernel parameters. Furthermore, the geographic distribution of the RMS of regression residuals showed an azimuth-angle dependency by waveband, i.e., the red band was better on east-facing slopes and the near infrared band was better on west-facing slopes. The temporal properties of regression residuals indicated disagreements between the observed and modeled reflectance at noon and in the morning/evening, when higher and lower reflectances, respectively, are observed. Atmospheric effects and terrain-induced bidirectional reflectance are major issues in extracting land surface properties such as vegetation structure and optical properties by BRDF modeling of a geostationary sensor.
ACKNOWLEDGEMENTS
AHI data were provided by the Japan Meteorological Agency, via the NICT Science Cloud at the National Institute of Information and Communications Technology, as collaborative research. This research was supported by the Shikoku Create Association and the Japan Society for the Promotion of Science (JSPS) KAKENHI 15H02856.
REFERENCES
Carrer D., Roujean J.-L., Meury, C., 2010. Comparing operational MSG/SEVIRI land surface albedo products from land SAF with ground measurements and MODIS, IEEE
Transactions on Geoscience and Remote Sensing, 48(4), pp.
1714-1728.
Gao F., Schaaf, C. B., Strahler A. H., Jin Y., Li, X., 2003. Detecting vegetation structure using a kernel-based BRDF model, Remote sensing of Environment, 86(2), pp. 198-205.
Japan Meteorological Agency, 2015. Himawari-8/9 Himawari
Standard Data User's Guide (ver. 1.1),
Matsuoka, M., Nonomura, A., Moriya, H., Honda, R., Yoshioka, H., Akatsuka, S., Takagi, M., 2015. Evaluation and improvement of geometric accuracy of Himawari-8/AHI "Japan Area" data, Proceedings of ACRS 2015 (paper ID: 548), Manila, Philippines.
NICT Science Cloud, 2015. Himawari real time data website, http://sc-web.nict.go.jp/himawari/himawari-realtime.html (21, Nov. 2015).
Pokrovsky, O., Roujean, J.-L. 2002. Land surface albedo retrieval via kernel-based BRDF modeling: I. Statistical inversion method and model comparison, Remote Sensing of
Environment, 84, pp. 100-119.
Pokrovsky, I., Pokrovsky, O., Roujean, J.-L. 2003. Development of an operational procedure to estimate surface albedo from the SEVIRI/MSG observing system by using POLDER BRDF measurements II. Comparison of several inversion techniques and uncertainty in albedo estimates,
Remote Sensing of Environment, 87, pp. 215-242.
Roujean J.-L., Leroy, M., Dechamps P.-Y., 1992. A bidirectional reflectance model of the earth's surface for the correction of remote sensing data, Journal of Geophysical
Research, 97(D18), pp. 20455-20468.
Strahler, A. H., Muller J.-P., 1999. MODIS BRDF/Albedo
Product: Algorithm Theoretical Basis Document (ver. 5.0),
http://modis-land.gsfc.nasa.gov/pdf/atbd_mod09.pdf (21, Nov. 2015).
Tang, S., Chen, J. M., Zhu, Q., Li, X., Chen, M., Sun, R., Zhou, Y., Deng. F., Xie, D., 2007. LAI inversion algorithm based on directional reflectance kernels, Journal of Environmental
Management, 85, pp. 638-348.
Wanner, W., Li, X., Strahler A. H., 1995. On the derivation of kernels for kernel-driven models of bidirectional reflectance,
Journal of Geophysical Research, 100, pp. 21077-21090.
Revised March 2016