COMPARISON OF ZEB1 AND LEICA C10 INDOOR LASER SCANNING POINT CLOUDS
Beril Sirmaceka∗, Yueqian Shena, Roderik Lindenbergha, Sisi Zlatanovab, Abdoulaye Diakiteb
a
Department of Geoscience and Remote Sensing, Delft University of Technology, Stevinweg 1, 2628 CN Delft, The Netherlands
b
Section 3D Geoinformation, Department of Urbanism Faculty of Architecture and The Built Environment, Delft University of Technology, 2628 BL Delft, The Netherlands
(B.Sirmacek, Y.Shen-2, R.C.Lindenbergh, S.Zlatanova, A.A.Diakite)@tudelft.nl
Commission V, WG V/3
KEY WORDS: Point Clouds, Indoor Laser Scanning, Zebedee, Leica C10
ABSTRACT:
We present a comparison of point cloud generation and quality of data acquired by Zebedee (Zeb1) and Leica C10 devices which are used in the same building interior. Both sensor devices come with different practical and technical advantages. As it could be expected, these advantages come with some drawbacks. Therefore, depending on the requirements of the project, it is important to have a vision about what to expect from different sensors. In this paper, we provide a detailed analysis of the point clouds of the same room interior acquired from Zeb1 and Leica C10 sensors. First, it is visually assessed how different features appear in both the Zeb1 and Leica C10 point clouds. Next, a quantitative analysis is given by comparing local point density, local noise level and stability of local normals. Finally, a simple 3D room plan is extracted from both the Zeb1 and the Leica C10 point clouds and the lengths of constructed line segments connecting corners of the room are compared. The results show that Zeb1 is far superior in ease of data acquisition. No heavy handling, hardly no measurement planning and no point cloud registration is required from the operator. The resulting point cloud has a quality in the order of centimeters, which is fine for generating a 3D interior model of a building. Our results also clearly show that fine details of for example ornaments are invisible in the Zeb1 data. If point clouds with a quality in the order of millimeters are required, still a high-end laser scanner like the Leica C10 is required, in combination with a more sophisticated, time-consuming and elaborative data acquisition and processing approach.
1 INTRODUCTION
Three-dimensional (3D) modeling of building interiors has vi-tal importance for fields and tasks such as robotics, surveying, object scanning, mobile mapping, tourism, gaming and energy efficiency assessment. There are a number of ways to acquire 3D data, such as scanning lidar or radar, flash lidar, stereo vi-sion, imaging sonar, and structured light triangulation, Vidas and Moghadam (2013). One of the most precise and fast 3D data acquisition methods is to use laser scanners. Even laser scan-ner sensors have many different technologies and designs avail-able for generating 3D models of interiors. However, all of them come with different advantages, as well as disadvantages. The sensor devices have high variety of prices, sizes, quality, mea-surement capabilities and additional requirements of usage. Be-sides knowing that the device is affordable for the project and its measurements are satisfying for a specific application, it is also very important to consider how easy it is to make the acquisition by users and transporting the sensor device inside of the place which is going to be modeled. These important points must be considered before making a decision about which sensor device to select for a particular project. Therefore, this paper provides valuable information by focusing on practical and technical fea-tures of Zebedee (Zeb1) and Leica C10 laser scanners for interior point cloud acquisition. In Figure 1, the Zeb1 and Leica C10 Scanners are shown.
Although the Leica C10 laser scanner provides very high density and very high quality point clouds, the practical difficulties of transporting the scanner to different stations make it challenging to use in every day life, especially when the point clouds need to be generated urgently. Except for the transport of the scanner
∗Corresponding author
Figure 1: Left; the Zeb1 laser scanner is shown while it is being used in a scanning process. Right; the Leica C10 laser scanner.
itself during acquisition, also knowledge by the operator is re-quired on target installation, data acquisition and post-registration steps. The issue of the different stations is solved by using a per-sonal mobile mapping system, Lauterbach et al. (2015) and Corso and Zakhor (2013). Still, some mobile devices require a trained person to obtain a valid 3D point cloud product. The Zeb1 scan-ner brings advantages to overcome many of those difficulties. For instance, Zeb1 can be used by non-trained persons and the result-ing point clouds can be obtained very quickly even for very large structures. As could be expected, these advantages come with some drawbacks. Zeb1 based point clouds have way less point density and precision comparing to the Leica based point clouds. When several point cloud acquisitions are done, Zeb1 data needs to be submitted to an online system for registration process. This online platform charges also payments depending on the sizes of the submitted data.
mobile applications. They have demonstrated a particular real-ization of the general design concept, which is called Zebedee. A specialized SLAM algorithm (Durrant–Whyte et al. (2006)) has been developed that can be used both for incremental mo-tion estimamo-tion and global point cloud registramo-tion, Curran et al. (2011). In fact, the same algorithm base has been used for a va-riety of mobile 3D laser configurations, including spinning, nod-ding, and trawling 2D lidars. The solution has been evaluated in a variety of environments, both indoor and outdoor, and quanti-tatively analyzed using a motion capture system for ground-truth position estimates. There are, however, some limitations to the system. Common to all laser-based SLAM algorithms, there ex-ist pathological environments where the motion is weak or non-observable, such as long, smooth tunnel-like spaces, or large, fea-tureless, open areas. Such cases are identifiable by examining the distribution of surface normals, but extreme cases can be diffi-cult to recover from without additional sensors. Environments dominated by moving objects can also challenge the algorithm since it becomes difficult to distinguish true outliers. In some ap-plications, the Zeb1 design requires fairly continual excitation in order to induce motion of the sensor head. For example, the de-vice may not be appropriate for electric ground vehicles operating with infrequent accelerations on smooth terrain. However, there are many potential excitation sources in typical applications, such as rough terrain, vibrating engines, legged platforms, wind distur-bances for air vehicles or fast-moving ground vehicles, or wave motion for marine surface vehicles. It should also be noted that the trajectory computed by the SLAM solution tracks the sinu-ous trajectory of the sensor head: further processing would be required to also estimate the trajectory of the platform on which the sensor base is mounted. Since the compression of the spring is small compared with the bending of the spring, it behaves ap-proximately like a rigid link with a universal joint. Thus, a sim-ple transformation approximates the position of the sensor base frame relative to the sensor head. More accurate results can po-tentially be obtained by observing and tracking structure on the base platform within the local point cloud. Finally, a limitation of the SLAM solution which is presented is that it does not com-pute an uncertainty estimate, although there are ongoing studies on investigating this aspect.
Chane et al. (2013) used Zeb1 for 3D reconstruction of a large cultural heritage area which is a small village. Zeb1 gave the opportunity to walk in the village and generate a 3D model of the environment and the heritage buildings only in few hours. The areas which are not accessible by large devices could be modeled accurately. The 3D documentation of another cultural heritage area of 250×400m is discussed in Zlot et al. (2015) and the outdoor scanning of complex cliff morphology is discussed in James et al. (2014). A Zeb1 has also been discussed in Thomson et al. (2013) for the purpose of indoor mobile mapping, in Zlot et al. (2014) for the mapping of an underground mining system, while in Ryding et al. (2015), Zeb1 has been evaluated for the purpose of scanning 3D forest structure.
In a previous study, a Leica C10 laser scanner was used for 3D data acquisition of the interior and exterior of a historical wind-mill in Delft. The data is analyzed in the BSc thesis of Roe-broeks (2015) and partly available via an open data repository, Sirmacek (2015). The exterior point cloud acquisition took few hours, however the interior point cloud acquisition of different floors and rooms took three working days. In addition to that, several working days were spent for transferring the data from the laser scanner to the computer and to correctly align the dif-ferent scans. The point cloud has also color information which is not possible to obtain with the Zeb1 laser scanner. The details of the objects are very accurate and sharp. For instance, the data
gives opportunity to detect deterioration or cracks on wooden panels. Measurements of distances and angles can be done at high precision. However the total windmill point cloud (together with interior and exterior points) consists of almost 60GB data which is not possible to process or visualize easily on every com-puter. Besides these technical difficulties, another difficulty that researchers experienced was the practical phase of the data acqui-sition process. The laser scanner equipment was large and heavy to operate on the narrow and steep staircases of the windmill. Be-sides, the wood and stone based structure made it challenging to install magnetic targets or stick target papers.
In the rest of the paper, we discuss and compare point clouds of both the Leica C10 and the Zeb1 laser scanners in detail.
Figure 2: Outside view of the test building (Firebrigade office of Lansingerland, The Netherlands).
2 DATA SETS, FIREBRIGADE OFFICE
For data acquisition and comparison, we have visited the Firebri-gade office of Lansingerland in the Netherlands. The outside of the building is shown in Figure 2. The yellow box highlights the position of the room which is used for detailed comparison and tests in this paper.
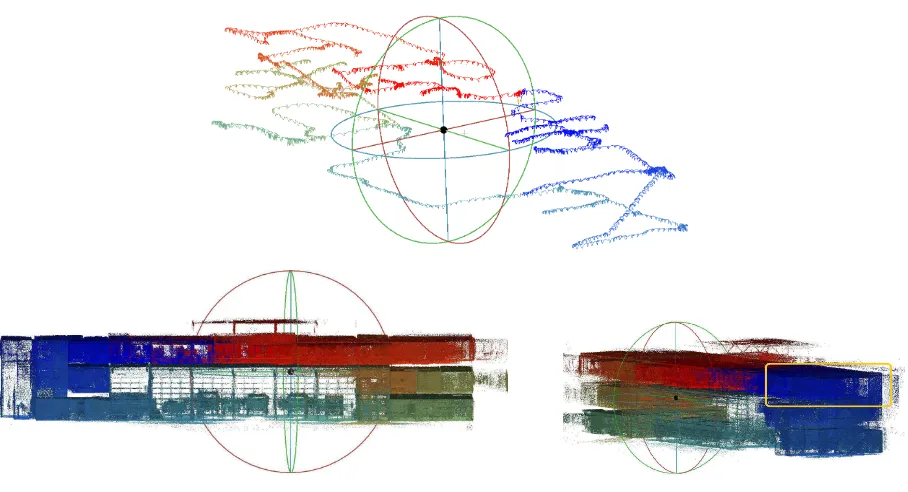
Because of the larger (target installation, data acquisition, post-processing) time requirements of the Leica C10 laser scanner, we have gathered data only in a few rooms of the building. How-ever, since the Zeb1 laser scanner can provide faster results, all building could be scanned in approximately half an hour. Figure 3 shows the path of the Zeb1 laser scanner and the resulting full building interior point cloud.
2.1 ZEB1
In terms of widening the appeal of scanning, probably the Zebe-dee is one of the most advanced devices. Peel (2014) announced it as the first truly handheld scanner. The mechanical simplicity, size, and weight of this sensor design make it suitable to develop practical solutions to a range of challenging applications, such as mapping from a micro air vehicle, or infrastructure inspection in confined spaces. A lightweight handheld or human-wearable version of a spring-mounted laser would be ideal for use as a localization or mapping tool by first responders in emergency situations. While several handheld 3-D scanners are commer-cially available (e.g., Z Corporations ZScanner, Leicas T-Scan, and Mantis Visions MVC-F5), they are primarily intended for ob-ject scanning applications, often require modification to the envi-ronment, and have limited working volume that is not appropriate for large-scale mobile applications. Available structured lighting solutions are limited in their sensing range, precision, and the lighting conditions in which they can operate. For example, the Microsoft Kinect has an effective range of a few meters, and a precision of around 12 cm at 4 m range, Khoshelham and El-berink (2012).
Figure 3: Top; the path of the Zeb1 sensor for the building scanning process. Bottom left; full point cloud of the building interior Bottom right; full point cloud of the building interior. All three images are false colored by time scale. The test room is highlighted in
the bottom right image by a yellow box.
The Zebedee 3D sensor system consists of a 2D laser scanner and an IMU mounted on one or more springs. The laser in the current model is a Hokuyo UTM-30LX, which is a 2D time-of-flight laser with a 270 degrees field of view, 30 m indoor and 15 m outdoor maximum range, and 40 Hz scanning rate. The dimensions of the UTM-30LX are 60×60 ×85 mm, and its
mass is 210 g, which makes it ideal for low-weight requirements. The IMU is a MicroStrain 3DM-GX2, an industrial-grade IMU that contains triaxial MEMS gyros and accelerometers with an output rate of 100 Hz.
2.2 Leica C10
The Leica C10 Scan Station scanner is a time-of-flight scanner with an effective operating range of +/- 1-200 m (up to 300 m with 90%reflectivity). It’s motorized head allows scanning of a com-plete field of view of 360 degree by 270 degree. Data is acquired at a rate of 50,000 points/second and can be stored on-board or on a wireless or wired laptop. The C10 has a number of features which make it particularly effective. It has an on-board camera which can provide images to be automatically aligned with the scans to texture the point clouds. The specifications indicate that the accuracy of a single measurement is 6 mm in position and 4 mm in depth at ranges up to 50 m, Leica (2011).
3 QUALITY ASSESSMENT
In this section, we focus on the laser scanning point clouds of one test room in order to discuss the capabilities of the two laser scanning sensors.
3.1 Preparing the input data for comparison
When after acquisition the Leica and Zeb1 point clouds are to-gether displayed in a point cloud viewer, they initially do not match. Both input point clouds have different coordinate sys-tem that are in addition not georeferenced. There are orientation
and coverage differences as well. Before starting to compare the interior scanning qualities of the two input point clouds, we need to align them correctly. To do so, we have used CloudCompare (2015) software which provides a tool for manually selecting tie points and obtain the 3D transformation function for aligning one of the point clouds on the other.
After aligning the Zeb1 point cloud with the Leica C10 point cloud, we have segmented walls in the room in order to be able to compare point clouds of each wall separately. The segmentation is done by extracting local normal vectors and calculating local differences. By applying a threshold to the normal vector angle differences, we have segmented the walls. Herein, we have used a normal search window of 20 cm and an angular difference thresh-old value of 45 degrees which means that surfaces having more than 45 degrees angle are segmented into different groups. More information on the algorithm is given in Ioannou et al. (2012). In Figure 4 we provide a view of the extracted wall segments for the Zeb1 and Leica C10 point clouds of test room.
Figure 4: Left; segmented Zeb1 point cloud walls. Right; segmented Leica C10 point cloud walls.
3.2 Suitability for the extraction of metric properties.
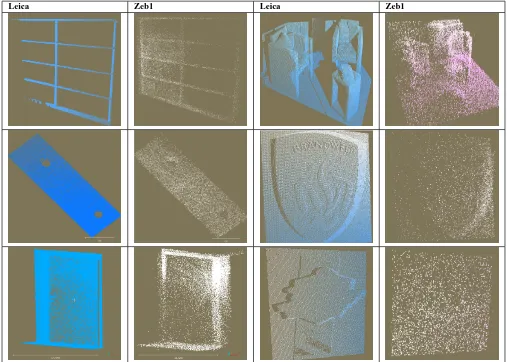
Leica Zeb1 Leica Zeb1
Table 1: Comparison of key objects. Leica C10 point clouds are shown in blue. The corresponding Zeb1 point cloud is shown on the right of each Leica C10 point cloud.
addition, distances between characteristic points like corners are extracted and compared.
3.2.1 Visual comparison. In Table 1 some of the key objects in the room are presented. Their appearance in the two different point clouds illustrate the sharpness of the 3D geometrical details and point density of the Leica C10 and the Zeb 1 data. From this visual inspection we conclude that coarse features like walls, are clearly visible in both point clouds. Features that vary at the decimeter scale, like chairs or cupboards are visible in both point clouds, but are already difficult to recognize in the Zeb 1 data. Finer features, like the 3D logo of the fire brigade, with variations in the order of centimeters are still sharp in the Leica C10 data but are not visible at all in the Zeb 1 data. A summary of the visibility of some key object is given in Table 2.
3.2.2 Extracting local patches A further quantitative evalu-ation of the Leica C10 and the Zeb 1 point clouds is given based on an analysis of local planar patches. These patches are ex-tracted and analyzed for both point clouds as follows. First an arbitrary wall is identified that is present in both point clouds. Using the segmentation results described above, all points sam-pling this wall for both sensors are extracted.
Next, after removing some remaining outliers, sampling for ex-ample window sills, 5000 points from each wall point cloud are randomly extracted. These 5000 points are used to estimate a global normal vector for the wall using Principal Component Anal-ysis (PCA). The eigenvectors of the PCA are used to convert each
# Key Object Leica Zeb1
1 Ceiling boundaries Visible Not Visible 2 Small wall decoration Visible Not Visible 3 Small holes in the ceiling Visible Not Visible 4 Staircase handles Visible Visible 5 Window ceiling Visible Visible 6 Larger wall decoration Visible Visible 7 Sitting corner Visible Visible 8 Elevator boundaries Visible Visible 9 Door boundaries Visible Visible
Table 2: Visibility of key objects.
full wall point cloud to a 2D plane aligned to the wall, where the 3rd coordinate, thezi, gives the signed distance of thei-th point
to this plane, compare also Van Goor et al. (2013).
The resulting 2D wall point clouds for both sensors are divided into patches of 20 [cm]×20 [cm]. For each resulting patch the following properties are derived for both sensors:
• Local point density
• Local standard deviation
• Local deviation from global normal
The local point density is obtained by, first, counting the number of points in each patch, and, second, normalizing the result to
Figure 5: Local point density of patches from one of the wall segments. Left. Leica C10 point cloud. Right. Zeb1 point cloud.
Figure 6: Standard deviation per patch for a local planar fit. Left. Leica C10 point cloud. Right. Zeb1 point cloud.
Figure 7: Difference between normal of local patch and global wall normal Left. Leica C10 point cloud. Right. Zeb1 point cloud.
the corresponding number of points per [m2]. A local standard
deviation and local normal vector are obtained by a local PCA fit. The resulting local normal vector is compared to the global normal vector of the plane to arrive at a local deviation from the global normal.
3.2.3 Results, local point density The resulting local point densities for both sensors are visualized in Figure 5 by coloring point according to this point density. The point density of the Leica C10 point cloud sampling the wall varies between roughly 30 000 points/[m2] and roughly 50 000 points/[m2]. This means
that the point to point distance is in the order of 5 [mm]. Vari-ations in the point density are caused by the relative position of the scanner w.r.t. the location of the wall during acquisition. If necessary, the point density could be further adapted by moving the scanner or changing the scan resolution.
For the Zeb 1 point cloud, individual points on the right hand side are clearly visible. For the Zeb 1 point cloud, the local point
den-sity varies between 1 000 points/[m2] and 18 000 points/[m2].
This means that the highest Zeb 1 point density compares to the lowest Leica C10 point density. Again, variations in point den-sity are probably caused by the acquisition geometry. Maybe a higher point density could be obtained by for example revisiting a room. The minimal point density of 1 000 points/[m2] would correspond to a point to point distance of around 3 [cm], which explains why some small features were not distinguishable in the above visual inspection. Still, the point densities found would probably be sufficient for most applications that consider com-plete buildings like considered in this work.
ranges here were in the order of 5 [m]. In addition, the material and acquisition geometry will further influence the quality. In this acquisition, scanning was near perpendicular, which means that conditions were very favorable, Soudarissanane et al. (2011).
Resulting standard deviations for the Zeb 1 acquisition varied be-tween 4 to 9 [mm]. This corresponds well to the product spec-ification of the embedded UTM-30LX laser range finder, which states that the range st.dev is below 10 [mm] for acquisitions up to 10 [m], so no surprises here. But note that in this case the final quality depends both on the laser and on the IMU solution, so in that sense the Zeb 1 does a nice job, as it stays within the specs of the laser, even when the IMU solution is included.
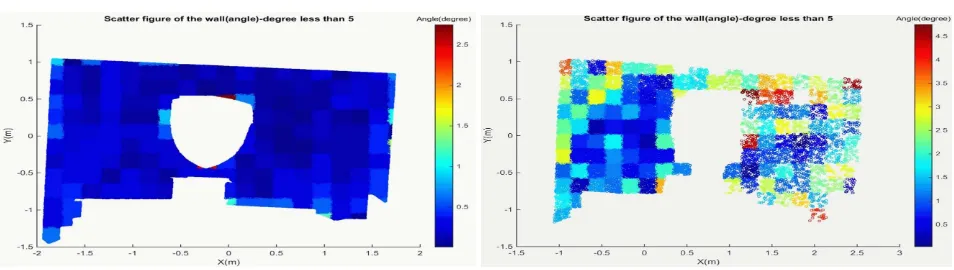
3.2.5 Results, local normal assessment The quality of the local planar patch parameters is determined by point density and point precision. Instead of considering these parameters sepa-rately, we consider the quality of the local patch reconstruction as a whole by considering the deviation between local patch nor-mal and global wall nornor-mal as visualized in Figure 7.
The results show that resulting local Leica C10 normals match the global normal up to differences that not really exceed 0.5 [deg]. The Zeb 1 local normal vary between 0.5 [deg] for the more densely sampled left part of the wall, to deviations of 3 to 4 [deg] on the more sparsely sampled right part of the wall. A first conclusion could be, that, if higher metric quality is required, ac-quisition by the Zeb 1 should be done such that local point density is sufficient. How this could be enforced during acquisition is not clear to this author at the time of this writing however.
3.3 Baseline Analysis
A final goal of a Zeb 1 acquisition could be to obtain a simple CAD map of the sampled building. For the coming analysis we assume that the Leica C10 data is superior in quality to the Zeb 1 data, which seems a reasonable assumption given the local patch analysis of above. The starting point of the coming analysis is the room segmentation for both sensors as shown before in Figure 4.
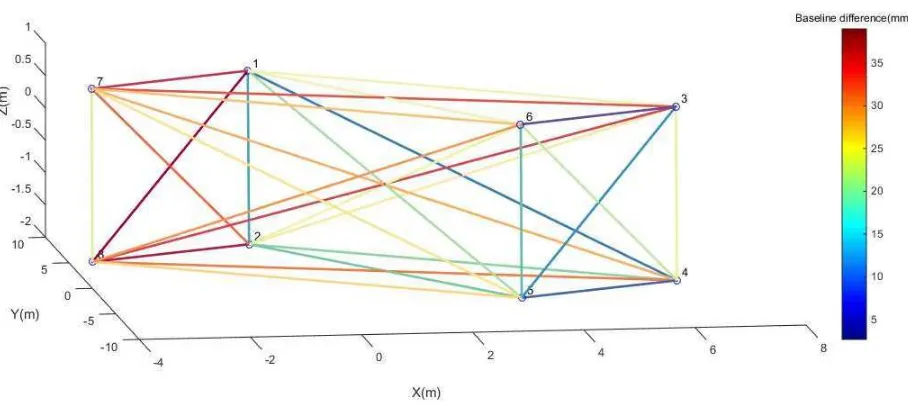
First, planes are fitted to the segments sampling different walls. Next, by intersecting these planes, 3D locations of the eight cor-ner points of the wall are obtained, that are visible in Figure 8. From both the Zeb 1 data and the Leica C10 data, lengths are derived of the line segments connecting the corner points. We refer to these line segments as baselines. Finally, the lengths of the Zeb 1 baselines are compared to the corresponding Leica C10 baselines which results in certain differences in length.
In Figure 8 the baselines connecting the corner points are colored by these differences. If we assume the Leica baselines to pro-vide ground truth, the resulting differences could give insight in the value that Zeb 1 measurements have for constructing a CAD map. The resulting differences are all between 3 [mm] and 38 [mm]. For example, if we would like to estimate the area of a room of 6 [m]×4 [m] by multiplying an estimated length of 6.04 [m] of the room with and estimated width of 4.04 [m], the result-ing error in the estimated area would be 0.4 [m2]. This worst-case
scenario would be acceptable for applications such as real-estate assessment, coarse renovation planning or many cadaster mea-surements. If the goal of a measurement would be to estimate the size of a window sill or a glass panel for for example external construction, a higher quality is probably required.
4 CONCLUSIONS AND FINAL REMARKS
In this paper, we have provided comparison results of Leica and Zeb1 point clouds sampling the same room. Besides discussing
practical advantages and disadvantages, we have provided de-tailed quantitative quality analysis in terms of local point den-sity, noise level and reconstruction capacities. Besides, we have compared the appearance of characteristic objects in the room, like room boundaries, door handles and 3D ornaments. Finally, we have discussed the quality of a simple 3D map as extracted from the Zeb1 point cloud benchmarked against the Leica C10 point cloud. Our examples and discussions illustrate technical and practical advantages and disadvantages of two different laser scanners. We believe that our detailed comparison provides in-sights to select the most suitable sensor device and understand the acquired data. As future work, we are going to include Google Project Tango and Kinect based point clouds for comparison with Leica and Zeb1 point clouds. We believe that our experiments provide important information to those who use point clouds for 3D modeling, object recognition and interior navigation purposes.
ACKNOWLEDGMENTS
This research is partly funded by the NWO/STW M4S project
Smart 3D indoor models to support crisis management in large public buildings (www.sims3d.net). We thank the Fire Brigade
Rotterdam – Rijnmond for making one of their buildings avail-able for the tests. The FP7 project IQmulus (FP7-ICT-2011-318787) A high volume fusion and analysis platform for
geospa-tial point clouds, coverages and volumetric data set is thanked
for funding part of the co-authors. We would like to thank the China Scholarship Council for enabling Yueqian Shen to study for one year at Delft University of Technology.
References
Bosse, M., Zlot, R. and Flick, P., 2012. Zebedee: Design of a spring-mounted 3-d range sensor with application to mobile mapping. IEEE Transactions on Robotics, 28(5), pp. 1104– 1119.
Chane, C., Mansouri, A., Marzani, F. and Boochs, F., 2013. Inte-gration of 3D and multispectral data for cultural heritage appli-cations: Survey and perspectives Image and Vision Computing, 31(1), pp. 91–102.
CloudCompare, 2015. http://www.danielgm.net/cc/release/. Ac-cessed: 2015-12-12.
Corso, N. and Zakhor, A., 2013. Indoor Localization Algorithms for an Ambulatory Human Operated 3D Mobile Mapping Sys-tem Remote Sensing, 5(12), pp. 6611–6646
Curran, K., Furey, E., Lunney, T., Santos, J., Woods, D. and Mc Caughey, A., 2011. An evaluation of indoor location de-termination technologies. Journal of Location Based Services, 5(2), pp. 61–78.
Durrant-Whyte, H., and Bailey, T., 2006. Simultaneous localiza-tion and mapping: part I. Robotics & Automalocaliza-tion Magazine,
IEEE, 13(2), pp. 99–110.
Van Goor, B., Lindenbergh, R. and Soudarissanane, S., 2013. Identifying corresponding segments from repeated scan data.
Int. Arch. Photogramm. Remote Sens. Spatial Inf. Sci.,
XXXVIII-5/W12, pp 295–300,
Ioannou, Y., Taati, B., Harrap, R. and Greenspan, M., 2012. Dif-ference of normals as a multi-scale operator in unorganized point clouds. The Second International Conference on 3D Imaging, Modeling, Processing, Visualization and Transmis-sion (3DIMPVT) pp. 501–508.
Figure 8: Visualization of differences in baselines derived from the Leica C10 point cloud and the Zeb1 point cloud..
James, M. R. and Quinton, J. N., 2014. Ultra-rapid topographic surveying for complex environments: the hand-held mobile laser scanner (HMLS). Earth Surf. Process. Landforms, 39: pp 138–142.
Khoshelham, K. and Elberink, S. O., 2012. Accuracy and res-olution of kinect depth data for indoor mapping applications.
Sensors, 12(2), pp 1437–1454.
Lauterbach, H. A., Borrmann, D., Heß, R., Eck, D., Schilling, K., and N¨uchter, A., 2015. Evaluation of a Backpack-Mounted 3D Mobile Scanning System. Remote Sensing, 7(10), pp 13753– 13781.
Leica, 2011. The all-in-one laser scanner for any application. Leica Geosystems Product Datasheet.
Peel, R., 2014. Innovation in rapid laser scan data collection and processing: The speed of light. GeoInformatics, 17(6), pp. 10– 12.
Roebroeks, J., 2015. Generating a full 3d model of the windmill (molen de roos). BSc Final Thesis.
Ryding, J., Williams, E., Smith, M. J., and Eichhorn, M. P., 2015. Assessing handheld mobile laser scanners for forest surveys.
Remote Sensing, 7(1), pp. 1095–1111.
Sirmacek, B. 2015. Delft Windmill Interior and Exterior Laser Scanning Point Clouds. Delft University of Technology. Dataset. http://dx.doi.org/10.4121/uuid:daea472d-2ca5-4765-9f1b-bd3200de4b41
Soudarissanane, S., Lindenbergh, R., Menenti, M., and Teunis-sen, P., 2011. Scanning geometry: Influencing factor on the quality of terrestrial laser scanning points. ISPRS Journal of
Photogrammetry and Remote Sensing, 66(4), pp 389–399.
Thomson, C., Apostolopoulos, G., Backes, D. and Boehm, J., 2013. Mobile laser scanning for indoor modelling, ISPRS
Ann. Photogramm. Remote Sens. Spat. Inf. Sci, 5, W2
Vidas, S. and Moghadam, P., 2013. HeatWave: A handheld 3D thermography system for energy auditing, Energy and
Build-ings, 66, pp 445–460.
Zlot, R. and Bosse, M., 2014. Efficient Large-scale Three-dimensional Mobile Mapping for Underground Mines Journal
of Field Robotics, 31(5), pp 758–779.