3D GEOVISUALIZATION & STYLIZATION TO MANAGE COMPREHENSIVE AND
PARTICIPATIVE LOCAL URBAN PLANS
M. Brasebina∗, S. Christophea, F. Jacquinodb, A. Vinessea, H. Mahonb a
Universit´e Paris-Est, COGIT, LASTIG, IGN, UPEMLV 73 av. de Paris, 94160 Saint-Mand´e, France [email protected] - [email protected]
b
Universit´e Paris-Est, SUN, EIVP, UPEMLV, 80 rue R´ebeval 75019 Paris, France - [email protected]
Commission II, WG II/2
KEY WORDS:3D geo-visualization, Public participation, simulation, stylization, urban regulation
ABSTRACT:
3D geo-visualization is more and more used and appreciated to support public participation, and is generally used to present pre-designed planned projects. Nevertheless, other participatory processes may benefit from such technology such as the elaboration of urban planning documents. In this article, we present one of the objectives of the PLU++ project: the design of a 3D geo-visualization system that eases the participation concerning local urban plans. Through a pluridisciplinary approach, it aims at covering the different aspects of such a system: the simulation of built configurations to represent regulation information, the efficient stylization of these objects to make people understand their meanings and the interaction between 3D simulation and stylization. The system aims at being adaptive according to the participation context and to the dynamic of the participation. It will offer the possibility to modify simulation results and the rendering styles of the 3D representations to support participation. The proposed 3D rendering styles will be used in a set of practical experiments in order to test and validate some hypothesis from past researches of the project members about 3D simulation, 3D semiotics and knowledge about uses.
1. INTRODUCTION
In order to support public participation, 3D City Models are used and abused to visualize urban projects. 3D geo-visualizations are mostly resorted to to help stakeholders understand the evolution of urbanized areas. This type of representation is appreciated as it provides an impression of the visual impact of a new project. Generally speaking, 3D geo-visualization is used to present planned evolution of physical objects such as construction of new build-ings or new district layouts which have been designed upstream by architects and/or urban planners. Nevertheless, territorial evo-lution is not limited to planned changes supervised by public au-thorities, but also integrates private-planned changes that are reg-ulated through urban planning documents. The participation of citizens in the elaboration of such documents is thus more and more considered as a way to enhance the quality and relevance of urban planning.
Among these documents, Local Urban Plans (LUPs) define the constructibility at the parcel scale through a set of 3D morpho-logical rules that new buildings must respect. LUPs elaboration is relatively strategic as it regulates sensitive topics such as the mor-phology of new buildings and the possibility to open new areas to urbanization for around a decade. Nevertheless, for non-experts, LUPs are difficult to understand because they are compiled in an inaccessible legal language and because of the difficulty to assess the concrete influence of the underlying constraints on the terri-tory. This is why it is quite complex to design efficient methods for the participation of citizens to the elaboration of LUPs. In this context, the PLU++ project addresses the issue of designing effi-cient 3D geovisualization system to ease this public participation and notably to simplify the understanding of LUPs regulations.
Designing such a system requires to solve a set of scientific issues that cover three main aspects:
∗Corresponding author
• Simulation of built configurations from LUPs regulation: As the aim is to visualize these complex LUPs textual regu-lations, it is necessary to represent their morphological con-straints with 3D geometric information. In order to provide non-experts with a familiar and meaningful representation of the regulation, we explore in the project the possibility to simulate built configurations.
• Designing efficient stylization of 3D geoinformation: Thus, the system requires efficient stylization that enables people to understand if an object is existing or a simulated built configuration (which is only a possible evolution of the ter-ritory) and how it could be integrated in the environment, regarding its morphology.
• Proposing relevant user interactions with the system: The system has to integrate different possibilities of interactions in order to allow navigating inside the 3D scene, switch-ing between simulations and representations to support effi-ciently the participation.
As different urban planing issues may be addressed during the discussions about this type of planning document, all the aspects of the system must be adapted to the participation context and users’ requirements. The design of such a system is an oppor-tunity to explore the convergence between recent subjects of re-search from various domains (simulation, 3D semiotics and knowl-edge about uses) and to confront our current knowlknowl-edge to a prac-tical use case.
2. THE USE OF 3D CITY MODELS FOR PUBLIC PARTICIPATION : APPLICATION TO THE FIELD
OF LUPS
In this state of the art, after an initial diagnosis of current practices and their limits, we present the scientific researches and practical system dedicated to public participation notably in the context of LUPs, based on suitable 3D geovisualizations, in order to de-fine our research objectives and to propose a formalization of our pluridisciplinary approach toward participation of citizens to the elaboration of LUPs.
2.1 3D systems for public participation: uses and limits
Our diagnose is based on the authors’ past works in several re-search project concerning consultation and participative experi-ments in various settings (windmill development, road construc-tion projects, flood mitigaconstruc-tion planning) and on exchanges with practitioners involved in the development in 3D models in France through professional networks1and user requirements studies con-ducted in the professional field (Nielsen, 2004, Nielsen, 2007, Badard et al., 2007, Carneiro, 2011, Pouliot and Daniel, 2011, M´eo, 2012). As far as LUPs are concerned, this diagnose is com-pleted with the result of the analysis of tools used by some French public authorities and associations2. Inputs from activists in the field have also been analysed3, through implications of the author in the field of urban planning through action-research.
As regards with the raising of citizens’ ability to understand plan-ning projects, 3D geovisualizations have proven their efficiency (Jacquinod, 2014), especially in comparison with 2D maps, in relation to:
• Their straightforward representation of volumes, which makes it easier for many users to better grasp the vertical dimension of urban areas, since imagining this vertical di-mension from looking at a 2D map requires training;
• The numerous landmarks they provideto help users find their way into a 3D spatial model. This, in turn, helps them to get a better grip on technical or ”abstract” data (such as LUPs zones and regulations) that are sometimes presented to them, by allowing them to link the location and content of those abstract data with their own knowledge of the area (in the case of inhabitants);
• The interactive navigationthat they can offer. Users can move around objects and change focus and scale in relation to their ongoing thoughts. In particular, the ability to be able to choose any viewpoint in the 3D scene can be crucial in the understanding of both physical organization of urban areas, their volumetric dimension and abstract data that might that may be presented along with the 3D built environment.
Nevertheless, there are still many aspects of those 3D geovisual-izations that need to be studied in order to fully grasp the reasons
1
The authors are involved in the professional networks created in the professional field to share experience and produce best prac-tices, such as The Ideal Community for 3D buildings and territo-ries (http://communautes.idealconnaissances.com/3dbt/public) and the 3D Ethic Comity (http://3dok.info/WordPress3/).
2
Two interesting examples of how consultation has been conducted for a local urban plan (and how citizens were in-volved) : Modification of Paris City LUPs: (https://modification-plu.imaginons.paris/) and Public participation for Strasbourg LUPs (http://www.strasbourg.eu/developpement-rayonnement/)
3
Civicwise network: https://civicwise.org/fr/
for their efficiency, especially in collective settings during par-ticipatory meetings. Indeed, although numerous scientific works have been conducted on the subject, no consensus has ever been reached on how exactly 3D geovisualizations can contribute to the participation of citizens to urban planning (Bishop and Lange, 2005, Riedjik et al., 2006, Jacquinod, 2014). Beyond the uncer-tainties regarding the design of a 3D interface and the way to configure its functionalities, in vivo observations of the use of 3D geovisualizations during consultation have shown that their effi-ciency is both linked to the way they represent the territory ( ”rep-resentative efficiency”) and to the way they allow users to use this representation to perform a set of actions in relation to the con-text their own strategies (”performative efficiency”) (Jacquinod and Joliveau, 2014). Those findings are not limited to 3D geo-visualizations and confirm previous results concerning the use of visual documents in urban planning (S¨oderstr¨om and Zepf, 1998, S¨oderstr¨om et al., 1999, S¨oderstr¨om, 2000). This highlights the need to adapt participation support system to their context of use and to the specific actions their users need or want to achieve through them through user requirements studies.
In the specific case of LUPs, according to practitioners that have been interviewed, a participation support system including 3D geovisualizations needs to be automated and to offer graphically advanced options at the same time. The lack of those two ele-ments accounts for the currently limited use of 3D models. They are already used by some, but not many, public authorities in or-der to explain to residents the rules that have been decided upon in an already produced local urban plan. Those models are mostly produced using computer graphics techniques mastered by pri-vate firms, involving little automation in the representation of the built structures.so as to 3D models are more seldom used during the consultation process itself, and, when they are, they are rarely resorted to as tools to allow citizens to participate in the making of the morphological rules themselves, but mainly as tools to present thematic debates on general development issues (the space that need to be devoted to transportation, vegetation, ...). This lack of use of 3D geovizualisations in the discussion of LUPs content does not reflect an unwillingness on the practitioners part but is directly linked to the lack of appropriate and usable participation support system that can properly tackle the specific issue of build-ing regulations through several morphological rules. This is why work needs to be done on :
• Automatizationof the production of digital 3D models from 3D georeferenced data so that planners and architects can use it even without having the technical and can concentrate on debates when a participatory meeting takes place (rather than on a complex parametric system).
• Graphical versatility, so as to offer various and advanced styles for 3D representation, so that the graphical styles cur-rently used by practitioners and produced through computer graphics techniques, can be transposed into digital tools that can make the most of existing 3D city models. This requires to define a limited set of useful styles through a user re-quirement study and to be able to implement them into the systems as ready to use profiles.”
styles through a user requirement study and to be able to imple-ment them into the systems as ready to use profiles.
2.2 Constructibility information simulation
Different works intend to ease the comprehension of urban regu-lation. In (Falquet and M´etral, 2005), the authors propose to rep-resent the information from local urban plan by non-geometric information in 3D a model by linking the textual regulation to the concerned features. Some other approaches are based on the pro-duction of geometric information from the knowledge contained into the Local Urban Plans. A first method to simulate LUPs reg-ulation is the generation of buildable hulls (El Makchouni, 1987, Murata, 2004, Brasebin et al., 2011). These hulls are generated by a set of morphological constraints and define maximal shapes that ensure that all buildings it contains respect these constraints. The main issue with this approach is that some constraint can not be integrated (Brasebin et al., 2011) and the generated shape is very different from possible buildings and may not be suitable for public participation. Some other authors try to tackle these issues and propose the generation of buildings that respect urban regulation with procedural grammar-based generation (M¨uller et al., 2006), by footprint extrusion to maximize the built volume (Turkienicz et al., 2008) or by optimization through a set of ob-jects4. All these approaches require parameters to define the mor-phology of one generated building. As the local urban regulations let the possibility to build different types of buildings, it may be limited to provide only one possible building during the discus-sions. The interactions may be provided by interacting with a set of parametric buildings that respects the local regulation in or-der to show different allowed buildings possibility (Coors et al., 2009). In (Brasebin et al., 2015), an automatic approach is pro-posed and aims to study the diversity of the buildings generated. This approach may be used to provide a set of potential and rep-resentative buildings allowed by a regulation.
2.3 3D rendering: stylization and interaction
To support the participation, many methods of representation are available but there are still challenges concerning their suitability for public consultation and their efficiency for complex spatio-temporal comprehension. A stake for public consultation is the controllability of the 3D representation, by targeted users, on rep-resented data and the way they are reprep-resented in the geovisual-ization. It is not only a problem of human-machine interfaces and interaction but also of how rendering processes may be con-trolled.
A high level of photo-realism and high level of detail have been the main challenge for 3D rendering and representation, in or-der to obtain high visualization quality (Drettakis et al., 2007). An opposite view is to consider that photo-realism techniques do not offer optimal solutions for understandable visualizations, e.g. too low contrasts, visual noise, imprecise objects boundaries, ... (Semmo et al., 2010). The evaluation of the usability of 2D and 3D representations for some tasks is at stake in visualization and GI sciences, most of all regarding the effect of photo-realism and abstraction levels (Bo´er et al., 2013). The relevancy to use photo-realism (photos or virtual reality in 3D) to represent risks has been studied in (Kostelnick and McDermott, 2011). A user study has been conducted to determine the influence of realism level in 3D representations on the confidence in data quality a user may have (Zanola et al., 2009). Expressive rendering allow stylizing 3D models in order to attempt aesthetic purposes or more effi-cient renderings (notably (Willats and Durand, 2005, Cunzi et
4
SimPLU3D project: https://github.com/IGNF/simplu3D
al., 2003)) and thus to inject some semantical, geometrical and graphical abstractions.
Some methods have been also explored in order to propose to explore the potentialities of the rendering combined with the in-teraction with the visualization. Three relevant styles to render a 3D urban model (photo-realist, informative and illustrative) have been identified (D¨ollner et al., 2006), integrated by (Semmo et al., 2012) in a continuum of representations, but they have not been tested in the context of public consultation. Style mixing has been also used to manipulate several styles of 3D models (Talton et al., 2012, Brasebin et al., 2015), while other authors propose to nav-igate between levels of details (Biljecki et al., 2014). Various Human Computer Interaction techniques, such as Focus+Context approaches (Cockburn et al., 2009), are explored to manage the visual attention of the users. Parametrization of rendering meth-ods to make progressive transitions between various abstraction levels and strategies to distribute this abstraction level, are pro-posed in the visualization, according to the distance from the image center or to the saliency of rendered objects (Semmo et al., 2012). Various symbol specification methods to interpolate colors and textures between ortho-imagery and vector data (vec-tor & raster styles mixing) are explored in order to control the level of photo-realism in intermediary hybrid maps (Hoarau and Christophe, 2015).
All those renderings and interactions with rendering methods are not explicitly specified in a proper formalism. 3D semiotics is not clearly defined (H¨aberling et al., 2008) even if some imple-mentations have been proposed to describe graphic 3D parame-ters applied on a scene in a SLD 3D (Neubauer and Zipf, 2007): the impact of graphic parameters (e.g. material color or light) of such renderings on public understanding and perception is not controlled by now (Brasebin et al., 2015).
2.4 Towards a participatory approach: a common frame-work for a participatory support system
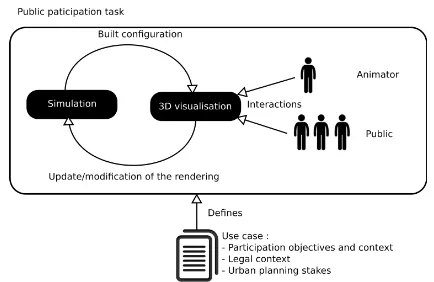
Figure 1. The considered global participation process and the system presented in this paper.
Different organizations of the participation are possible, the dis-cussions may take place in a meeting room, in situ or on the In-ternet. According to the type of participation, it may influence the different components of the participation.
• animators:an animator may be required in order to ease the discussions (in a room or in an Internet forum) or to interact with the 3D device is the public is not supposed to do it;
• participants: people who participates to this task may be resident of the concerned district or public area users;
• 3D device:computer, video-projector, 3D VR glasses, mo-bile device with AR representations may be used to display the 3D renderings. The type of device influences the pos-sible interactions and require adaptation to produced ren-derings. It can be used as thinking material, which raises several technical issues, in particular regarding their content and level of detail.
In this paper, the proposed system (described in section 3) is fo-cused on the production of 3D renderings according to the use case. Thus, the most important challenge of this work is to pro-duce efficient 3D renderings that can be adapted to different use cases and that can evolve during the consultation. We mainly consider two types of basic interactions in this paper: the modifi-cation of the regulation scenario and its impact on the presented simulation and the modification of the style of the represented simulated information.
3. METHODOLOGICAL APPROACH: 3D VISUALIZATION BETWEEN URBAN PLANNING
REGULATION SIMULATION AND COMPREHENSION
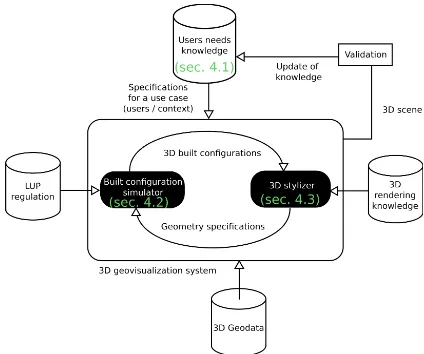
Our approach in this project is to consider controllable 3D geovi-sualizations of urban planning regulation simulation, in order to facilitate the understanding of such urban regulation by citizens. We thus focus on three sub-systems and their tight relations, in or-der to efficiently design a 3D geovisualization prototype. Figure 2 presents the three following sub-systems and how they interact.
1. thebuilt configuration simulator: an existing simulation engine is used to provide 3D built configurations based on knowledge on Local Urban Plans. The geometries produced by the simulator have to be adapted according to tested sce-nario and according to the type of style applied by the 3D stylizer;
2. the3D stylizer: a formalization and an implementation of a generic 3D rendering process based on 3D rendering styles is a new contribution of this project. It provides required geometric specifications to the previous sub-system in order to specify properly how geometric primitives should be ren-dered by the rendering engine of the 3D geovisualization. This sub-system is based on 3D representation knowledge;
3. theusers’ needs knowledge expectationsand needs of po-tential final users are determined by previous works and a user study to come. This sub-system provides users and con-text specifications for initial requirements for the 3D geovi-sualization and also for particular use cases. It defines rele-vant levers of interaction for the other sub-systems that are relevant to allow according to the context of the participa-tion.
Figure 2. Pipeline of the global approach.
Even if we will focus on each sub-system separately in the next section, we claim for an interdisciplinary and integrated approach in order to be able to design an effective 3D geovisualization sys-tem.
4. THE DESIGN OF A 3D SYSTEM BASED ON EXPLICIT RENDERING STYLES
Previous work regarding users and uses requirements give us clues to make some initial propositions about the 3D scene to represent and rendering styles to specify. Firstly, the users requirements according to the needs are presented (section 4.1). They are used as specifications to define expectations and potential interactions about 3D geodata and simulated built configuration (section 4.2), the renderings styles applied to these data (section 4.3).
4.1 Uses and users requirements
The study of user requirements in the PLU++ project is three-fold and is realized through:a preliminary studybased on pre-vious works; interviews with practitioners that are currently conducted anddirect observationof uses of the proposed de-vice during the experiments to come, so as to produce knowledge on its efficiency in collective and collaborative settings. Four main aspects have been highlighted so far through the prelimi-nary study in terms of visualization styles:
1. Abstract stylization for simulation results (simulated built configurations): rendering styles need to allow end users to understand they are viewing an abstract proposed urban morphology. Thus, a specific work has to be done both by producing generic geometrical shapes and schematic styles, so that users understand they are dealing with abstract data, that exists to feed their thoughts, but that will not be realized as such in real life.
3. Providing homogeneous LOD visualisation: considering the many morphological aspects that are not prescribed through LUPs and their morphological rules, and taking into account the need for landmarks for users to find their way into the 3D model, it is expected that the context is represented with more details than the focus. Nevertheless, the difference in LOD between the focus and the context should not be too important to provide a certain homogeneity. Thus, users will not focus on irrelevant building details when they express their opinion. This homogeneity should be achieved by try-ing to give, through the 3D representation, a sense of urban morphology at the district scale and an explicit reading of the proportions between free space and occupied space.
4. Providing complete 3D scene: Finally, the possibility to display both a set of objects from the existing environment, in relation to the focus of the LUP (i.e. topography, building, roads, vegetation), and abstract data such as parcel limits or existing zoning is expected. If users see an incomplete scene they won’t be able to understand and infer spatial knowl-edge.
Those requirements need significant work both on the simulation and stylization sides.
4.2 Geographic data and built configurations simulation
Providing a suitable 3D geovisualization system requires relevant 3D data notably building configurations that represent LUPs reg-ulation (section 4.2.1). As the aim is to provide an interactive sys-tem, the possibility of interactions with the built configurations is discussed in section 4.2.2.
4.2.1 3D geodata to support LUPs public participation
Simulated built configurations The core of this approach is to make public benefits from information concerning constructibil-ity by providing a set of built configurations according to a tested regulation. These simulations provide possibilities about what can be built at the scale of a parcel.
In the context of this work, the built configurations are generated with SimPLU3D5Open Source library. The built configurations from SimPLU3D is composed by a set of homogeneous objects (i.e. belonging to a same object class) and the system proposes a built configuration composed by a set of n objects where n is determined by the system.
The global process of the library is explained in figure 3 and re-quires several inputs:
• 3D geodata: this 3D database represents necessary existing features to check the regulation and are integrated in Sim-PLU3D model;
• LUP rules: these rules describe a set of geometric con-straints that the built configuration have to respect. Both model and rule formalization are described in (Brasebin et al., 2016);
• an input parcelas the simulation is proceeded parcel by parcel;
• a building strategythat includes, anoptimization function in order to choose the best built configuration according to a given measure andconfiguration parametersthat indicate which class of objects composes the built configuration and what are the characteristics of these objects.
Figure 3. Built configuration generation with SimPLU3D.
(a) Direct representation of con-straints
(b) Buildable hulls
Figure 4. Two possible information to indicate the constraints of the regulation.
As these built configurations only represent one instance of what can be built on a parcel, some extra geometric information may be added into the final scene in order to geometrically highlight the influence of regulation constraints according to the use case. In figure 4, there are two other possibilities that represent these constraints: a direct geometric representation of the constraints and a buildable hull.
Regulation oriented features In order to understand the influ-ence of the constraints, it is necessary to represent the feature concerned by these constraints. A 3D model that contains a set of necessary features is presented in (Brasebin et al., 2016) and is used in our approach. The model mainly describes information about properties (Cadastral parcel, basic property unit, cadastral boundaries), buildings, relief, roads and legal documents (zone, rules). These objects may be used and selected according to their relevance to the use case.
4.2.2 Possible interactions with built configurations Before preparing the participation, the organizers can choose a set of levers that may be activated during the discussions.
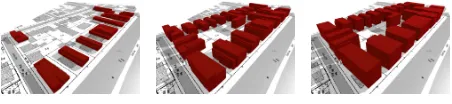
Figure 5. Different simulation results by adjusting some regula-tion parameters.
A first lever is to offer the possibility to change the input regula-tion of the simularegula-tion. According to the aim of the participaregula-tion,
5
the organizers may propose upstream different regulations sce-narios to discuss or let participants co-construct new regulations by adjusting regulation a set of parameters (figure 5). The simu-lator generates new built configurations according to these inputs.
Another lever is the opportunity to adapt the aim of the built con-figurations to the scope of the participation. It may be processed by parameterizing the building strategy. By choosing an adequate optimization function, the simulation can be linked with a urban phenomenon linked with the participation (i.e. by proposing built configurations that optimize solar energy to incite the develop-ment of this kind of energy). The shape of the built configurations may be adapted in order to produce a required LOD (figure 6) or level of generalization of built configurations or to be coherent with type of existing urban fabric (i.e. by generating individual houses).
Figure 6. Different simulation with different level of generaliza-tion.
4.3 Specification of rendering styles
According to previous highlighted guidelines coming from liter-ature and previous analysis of public participation, we propose to specify specific rendering styles of a 3D scene composed by simulated buildings in an existing environment.
Specification of four rendering styles We propose to specify three typical rendering styles: a photo-realist style and two ab-stract styles, i.e. typical and discreet. Their main visual char-acteristics and the related graphic parameters for each type of rendering style are the following:
• photo-realist: this style is made up of the visual properties of the ortho-image texture (colors, global luminance, reso-lution, ...) and the method to patch this texture.
• typical: this style is made up of some visual properties, typ-ical from the 3D scene: mainly a set of natural colors com-ing from the ortho-imagery or known field characteristics of walls and roofs. Surfaces are represented by plain colors, and strokes by visible thin black lines.
• discreet: this style is made up of a transparency level and white color for surfaces, and a light representation of strokes (black dashed or dotted lines, low thickness).
For each style colors may also vary between walls and roofs, in order to easily distinguish these surfaces.
Focus+Context of the 3D scene We propose to use the spec-ified rendering styles not on the whole scene but to differentiate the simulated buildings and the rest of the environment. So, we define thefocusas a set of simulated buildings, integrated into acontextrepresented by the other objects of the scene. These styles are visible whatever the camera and the zoom level are: we propose to manage abstract vs. photo-realist styles, and various abstract styles. According to the level of contrast we finally want to evaluate, we could manage a low or high difference between the two rendering styles of focus and context.
Possible co-visualizations for public participation Our first attempt is to manage the context, from an abstract style to a photo-realist style. Then, we aim at considering various parame-ters of the abstract styles in order to render the focus. Other vi-sual properties could be also parameterized while differentiating surfaces (walls, roofs) in the representation, i.e. different colors, different styles.
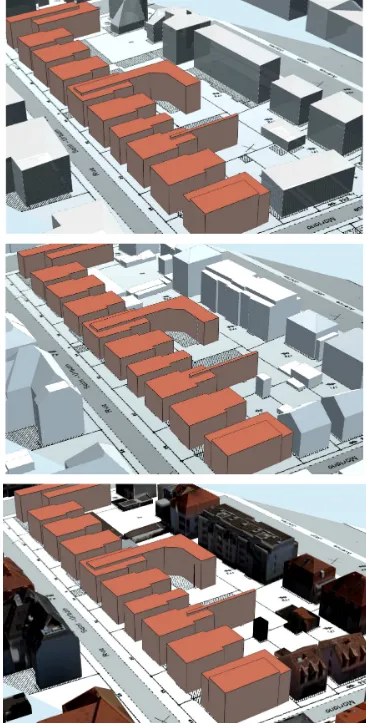
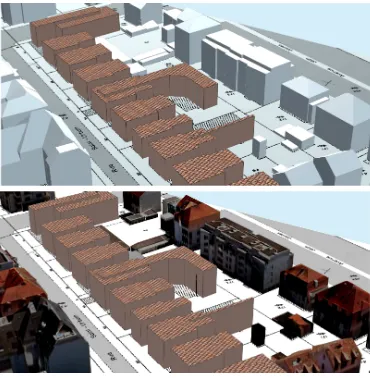
Figure 7 presents three types of combination of co-visualization of styles: the focus is represented by a typical style with ap-propriate colors regarding the ground truth, and a context vary-ing in generalization from discreet styles (transparent generalized blocks) to a photo-realist rendering.
Figure 7. Progressive generalization of the context, with a typi-cal focus: upper image: discreet buildings (generalized blocks); middle image: discreet buildings (preserved building shapes)
; lower image: photo-realist buildings.
Figure 8 presents two examples of a discreet style, differentiating walls and roofs (in the upper image) or not (in the lower image), in a photo-realist context.
Figure 9 presents two examples of a mixed style for the focus (typical walls and photo-realist roofs), in two different contexts (discreet and photo-realist): walls are represented by a typical style whereas roofs are represented by a photo-realist texture.
Figure 8. Visual effect of the differentiation of walls and roofs discreet style in a photo-realist context: upper image: differenti-ation between walls and roofs; lower image no differentidifferenti-ation.
Figure 9. Mix style for the focus and various contexts. upper image: discreet context; lower image: photo-realist context.
and typical rendering styles, we can provide very different results on the simulated buildings. Moreover, we see in the last images of figure 9 that styles (abstract or photo-realist) may be mixed in the focus, in order to help participants to consider new build-ings in their proper environment but also the visual effects of the simulation of regulation.
Our purpose is to present those possible co-visualizations to tar-geted users, as a result of a regulation simulation scenario: the suitable rendering styles will be selected upstream, according to the context of the use case, requiring to enhance a particular in-formation or targeting specific users. In the context of public par-ticipation, the system is used by performing the following steps. First, a set of built configurations is simulated according to the themes to be discussed during public participation. For
exam-ple, two sets of configurations may be simulated if discussions are focused on the comparison between two regulations. More sets may be simulated if discussions are focused on fixing regula-tion parameters values. Then, styling levers are defined according to the expected interaction with the tool during the participation process (i.e. exploring several scenarios). Finally, a graphical interface is created in order to allow the participation animator to load the 3D scene with simulated configurations and to render buildings with a predefined style. If the possibility to change the styles is offered, the animator can handle the styling levers in or-der to ease the unor-derstanding of the participants. Thus, he can change the style from a discreet one, to discuss about building morphology, to a more typical one, to talk about the integration to urban fabric.
5. CONCLUSION AND FUTURE WORKS
In this article, we present users requirements, possibilities of data simulation and 3D stylization to properly visualize simulation re-sults, in the context of public participation. Our approach is a pluridisciplinary work that integrates aspects taken from simula-tion, 3D stylization and users’ knowledge. We provide design guidelines for a suitable 3D geovisualization system and ren-dering styles specification to visualize simulated built configu-rations.
We have now to proceed to the experiments with practitioners (decision-makers, urban planners, citizens) in order to validate the various levers we have on simulation and stylization aspects, to refine our propositions. First, we aim at conducting interviews in order to specify the use context of the participation: which are its objectives (elaboration of a new LUP or discussion on urban planning based on existing LUPs, step of the participation, ...), re-quiring what kind of specific data and simulation rules and which type of questions for citizens. Those interviews will be supported by provided visualizations, in order to validate their suitability in terms of represented data and the way and level of stylization: the main question is which styles combination(s) are useful for an objective of participation. This step of acquisition of operational knowledge will help to next specify the required types of inter-action between the participants and the system, or an animator and the system, to better understand the regulation at stake. In-teraction tasks on data (for instance, display attributes), rules (for instance, see the rules in their initial form), simulation results (for instance, modify simulation rules), and the final visualization (for instance, hide type of objects).
An example of a future evolution of the system concerns the sim-ulation of other objects, such as vegetation and parking spaces. They are concerned by this type of regulation: they have also a crucial importance in the effects of the rules as they are directly included in mathematical ratio into the regulation documents. In the future, we plan to offer the possibility to simulate simulta-neously different types of objects if they are required by the use case. The ability to compare and mix multiple sets of rules has also been cited as a key element since urban planners, when they design rules, have to diagnose previous rules such as generic rules that apply to the whole country or specific ruling derived form thematic legislation (preservation of coastal areas, urbanization in mountainous zones, ...).
ACKNOWLEDGEMENTS
This work was partially funded by the PEPS PLU++ project (https://ignf.github.io/PLU2PLUS/) and by the Paris-Est Univer-sity and the Centre national de la recherch scientifique (CNRS).
REFERENCES
Badard, T., Daniel, S., B´edard, K., Thomas, V. and Pouliot, J., 2007. The profession of 3D-Geomatician. Assessment and per-spectives. Technical report, Departement of Geomatics Sciences and Center of Research in Geomatics.
Biljecki, F., Ledoux, H., Stoter, J. and Zhao, J., 2014. Formal-isation of the level of detail in 3D city modelling. Computers, Environment and Urban Systems 48, pp. 1–15.
Bishop, I. D. and Lange, E., 2005. Visualization in landscape and environmental planning : technology and applications. Taylor & Francis, London.
Bo´er, A., C¸ ¨oltekin, A. and Clarke, K. C., 2013. An Evaluation of Web-based Geovisualizations for Different Levels of Abstrac-tion and Realism What do users predict? In: 26th InternaAbstrac-tional Cartographic Conference, Dresden, Germany, August 25-31, 2013.
Brasebin, M., Perret, J. and Ha¨eck, C., 2011. Towards a 3d ge-ographic information system for the exploration of urban rules: application to the french local urban planning schemes. In: 28th urban data management symposium (UDMS 2011), 28-30 Sept. 2011, Delft, Netherlands.
Brasebin, M., Perret, J. and Reuillon, R., 2015. Stochastic build-ings generation to assist in the design of right to build plans. In: Joint International Geoinformation Conference 2015 - 3D GeoInfo, 28-30 October 2015, Kuala Lumpur, Malaysia.
Brasebin, M., Perret, J., Musti`ere, S. and Weber, C., 2016. A generic model to exploit urban regulation knowledge. ISPRS International Journal of Geo-Information 5(2), pp. 14.
Carneiro, C., 2011. Extraction of urban environmental quality in-dicators using LIDAR-based Digital Surface Models. PhD thesis, EPFL.
Cockburn, A., Karlson, A. and Bederson, B. B., 2009. A re-view of Overre-view+Detail, zooming, and Focus+Context inter-faces. ACM Comput. Surv. 41(1), pp. 1–31.
Coors, V., H¨unlich, K. and On, G., 2009. Constraint-based Gen-eration and Visualization of 3D City Models. In: J. Lee and S. Zlatanova (eds), 3D Geo-Information Sciences, Lecture Notes in Geoinformation and Cartography, Springer Berlin Heidelberg, pp. 365–378.
Cunzi, M., Thollot, J., Paris, S., Debunne, G., Gascuel, J.-D. and Durand, F., 2003. Dynamic Canvas for Non-Photorealistic Walk-throughs. In: Graphics Interface, pp. 121–130.
D¨ollner, J., Baumann, K. and Buchholz, H., 2006. Virtual 3D city models as foundation of complex urban information spaces. In: M. Schrenk (ed.), 11th international conference on Urban Planning and Spatial Development in the Information Society (REAL CORP), CORP Competence Center of Urban and Re-gional Planning, pp. 107–112.
Drettakis, G., Roussou, M., Reche, A. and Tsingos, N., 2007. Design and Evaluation of a Real-World Virtual Environment for Architecture and Urban Planning. Presence: Teleoperators & Virtual Environments, MIT Press.
El Makchouni, M., 1987. Un syst`eme graphique intelligent d’aide `a la conception des plans d’occupation des sols : SYGRIPOS. In: 12th Urban Data Management Symposium, Blois, France.
Falquet, G. and M´etral, C., 2005. Integrating Urban Knowledge into 3D City Models. In: 1st International Workshop on Next Generation 3D City Models, ISPRS WG III/4, EuroSDR, DGPF, and University of Bonn, Bonn.
H¨aberling, C., B¨ar, H. and Laurenz, H., 2008. Proposed car-tographic design principles for 3D Maps: a contribution to an extended cartographic theory. Cartographica 43(3), pp. 175–188.
Hoarau, C. and Christophe, S., 2015. Color and texture interpo-lation between orthoimagery and vector data. In: ISPRS Annals of Photogrammetry, Remote Sensing and the Spatial Information Sciences, Vol. II-3/W5.
Jacquinod, F., 2014. Production, pratique et usages des g´eovisualisations 3D dans l’amnagement du territoire. PhD the-sis, Universit´e de Saint- ´Etienne.
Jacquinod, F. and Joliveau, T., 2014. La carte en action: l’efficacit´e performative de la carte au service de la reflexion sur l’urbain. reflexions tir´ees de l’observation de l’utilisation de g´eovisualisations 3D. In: Symposium International Eidolon -Cartographier l’intelligence urbaine, 3 - 4 juillet 2014, Qu´ebec, Canada.
Kostelnick, J. and McDermott, D., 2011. An evaluation of ab-straction and realism on the perception of hazards and risks. In: 25th International Cartographic Conference, 38 July 2011, Paris, France.
M´eo, Y., 2012. Enquˆete sur la 3d dans les collectivit´es territori-ales. In: Actes des conf´erences IMAGINA 2012, Monaco.
M¨uller, P., Wonka, P., Haegler, S., Ulmer, A. and Van Gool, L., 2006. Procedural modeling of buildings. ACM Trans. Graph. 25(3), pp. 614–623.
Murata, M., 2004. 3D-GIS application for urban planning based on 3D city model. In: 24th Annual ESRI International User Conference, August 913 2004, San Dieo, USA, pp. 9–13.
Neubauer, S. and Zipf, A., 2007. Suggestions for Extending the OGC Styled Layer Descriptor (SLD) Specification into 3D. In: Towards Visualization Rules for 3D City Models, Urban Data Management Symposium. UDMS.
Nielsen, A., 2004. User-centered 3d Geovisualisation. In: Proceedings of the 12th International Conference on Geoinformatics - Geospatial Information Research: Bridging the Pacific and Atlantic, 7 - 9 June 2004, G¨avle, Sweden, University of G¨avle.
Nielsen, A., 2007. A Qualification of 3D Geovisualisation. PhD thesis, Aalborg.
Pouliot, J. and Daniel, S., 2011. Survey on 3D Geospatial mar-kets: Land management and urban planning. Technical report, Geomatics Department, Laval University.
Riedjik, A., Velde, R. J. v. d., Pleizier, I. D., Hoogerwerf, T. C., Lammeren, R. J. A. v., Baltussen, W. H. M., Jansen, J., Wynia, P., Uum, J. H. v. and Wilgenburg, R. v., 2006. Virtual Netherlands. Geo-visualizations for interactive spatial planning and decision making : from Wow to impact. Vrije Universiteit.
Semmo, A., Trapp, M., Kyprianidis, J. E. and D¨ollner, J., 2012. Interactive Visualization of Generalized Virtual 3D City Mod-els using Level-of-Abstraction Transitions. Computer Graphics Forum.
S¨oderstr¨om, O., 2000. Des images pour agir - Le visuel en urbanisme. Lausanne, Payot.
S¨oderstr¨om, O. and Zepf, M., 1998. L’image n´egoci´ee : urban-isme strat´egique et visualisations winterthur. Disp 134, pp. 12– 19.
S¨oderstr¨om, O., Chivallon, C., Ragouet, P. and Samers, M., 1999. Les g´eographes et le visuel: de l’iconophilie `a l’expertise. In: Discours scientifiques et contextes culturels : g´eographies franaises et britanniques `a l’epreuve postmoderne, Maison des sciences de l’Homme d’Aquitaine.
Talton, J., Yang, L., Kumar, R., Lim, M., Goodman, N. and Mˇech, R., 2012. Learning design patterns with bayesian grammar in-duction. In: Proceedings of the 25th annual ACM symposium on User interface software and technology, UIST ’12, ACM, New York, NY, USA, pp. 63–74.
Turkienicz, B., Gonc¸alves, B. B. and Grazziotin, P., 2008. City-zoom : A visualization tool for the assessment of planning reg-ulations. International Journal of Architectural Computing 6(1), pp. 79–95.
Willats, J. and Durand, F., 2005. Defining Pictorial Style: Lessons From Linguistics and Computer Graphics. Axiomathes.
Zanola, S., Fabrikant, S. I. and C¸ ¨oltekin, A., 2009. The effect of realism on the confidence in spatial data quality in stereoscopic 3D displays. In: 24th International Cartographic Conference, Santiago, Chile.