A NEW APPROACH FOR SEGMENTATION-BASED TEXTURING OF
LASER SCANNING DATA
Z. Lari a, *, A. Habib b
a
Dept. of Geomatics Engineering, University of Calgary, 2500 University Drive NW, Calgary, AB, Canada, T2N 1N4 – [email protected]
b
Lyles School of Civil Engineering, Purdue University, 550 Stadium Mall Drive, HAMP 4108 West Lafayette, IN 47907 – [email protected]
Commission V, WG V/4
KEY WORDS: Laser scanning, Texturing, Segmentation, Boundary detection
ABSTRACT:
In recent years, laser scanning systems have been recognized as a fast and accurate technology for the acquisition of high density spatial data. The advent of these systems has reduced the cost and increased the availability of accurate 3D data for mapping, modelling, and monitoring applications. The original laser scanning data does not explicitly provide meaningful information about the characteristics of the scanned surfaces. Therefore, reliable processing procedures are applied for information extraction from these datasets. However, the derived surfaces through laser scanning data processing cannot be effectively interpreted due to the lack of spectral information. To resolve this problem, a new texturing procedure is introduced in this paper to improve the interpretability of laser scanning-derived surfaces using spectral information from overlapping imagery. In this texturing approach, individual planar regions, derived through a laser scanning data segmentation procedure, are textured using the available imagery. This texturing approach, which aims to overcome the computational inefficiency of the previously-developed point-based texturing techniques, is implemented in three steps. In the first step, the visibility of the segmented planar regions in the available imagery is checked and a list of appropriate images for texturing each planar region is established. An occlusion detection procedure is then performed to identify the parts of the segmented regions which are occluding/being occluded by other regions in the field of view of the utilized images. In the second step, visible parts of planar regions are decomposed into parts which should be textured using individual images. Finally, a rendering procedure is performed to texture these parts using available images. Experimental results from real laser scanning dataset and overlapping imagery demonstrate the feasibility of the proposed approach for texturing laser scanning-derived surfaces using images.
*
Corresponding author
1. INTRODUCTION
Over the past few years, laser scanning systems have been established as the leading technology for the rapid collection of high density 3D point cloud. The original laser scanning point cloud usually does not provide semantic information about the types and characteristics of the scanned surfaces. The collected point cloud consequently needs to be processed to extract the required information for different applications (e.g., terrain mapping, environmental monitoring, 3D city modelling, transportation planning, cultural heritage documentation, structural health monitoring, industrial site modelling, and forest mapping). The derived surfaces through laser scanning data processing surpass the quality of the reconstructed surfaces using other methods such as photogrammetric reconstruction. However, those surfaces cannot be easily and effectively interpreted due to the lack of descriptive (spectral) information. On the other hand, the imagery data collected by high quality passive imaging systems provides rich descriptive information regarding the scanned surfaces. Therefore, the complementary characteristics of the images can be utilized to improve the interpretability of the laser scanning-derived surfaces.
The synergistic properties of laser scanning systems and images can be fully exploited only when they are successfully registered relative to a common reference frame (Habib and Schenk, 1999; Habib et al., 2004). Once the images and laser
scanning data are registered to a common reference frame, the spectral and positional surface information from both datasets can be linked together through a texturing procedure. Traditionally, the link between laser scanning and image data is established through point-by-point projection of the dense point clouds onto the images(Lamond and Watson, 2004; El-Omari and Moselhi, 2008; Koch and Kaehler, 2009; Kim and Habib, 2009). Due to the large volume of scanned points, the texturing of a complete laser scanning dataset using this approach will be very time and memory consuming. Furthermore, the laser-scanned surfaces may not be homogenously textured due to local point density variations. In order to overcome the second drawback of the point-based texturing techniques, different surface-based texturing approaches have been introduced in recent years. In these approaches, the laser scanning point cloud first is converted into continuous surfaces using a surface modelling technique. The surface modelling is performed by fitting smooth surfaces (Vosselman et al., 2004), fitting basic geometric shapes (Guelch, 2009), or triangulation/meshing (Kazhdan et al., 2006) of laser scanning point cloud. Once the continuous surfaces are constructed, the vertices of the individual surfaces, within the generated mesh, are projected onto the image space using collinearity equations (Kraus, 1993). The textures within the projected surfaces onto the image are then mapped to the mesh components to produce a photo-realistic appearance for the generated mesh (Wang et al., 2001;
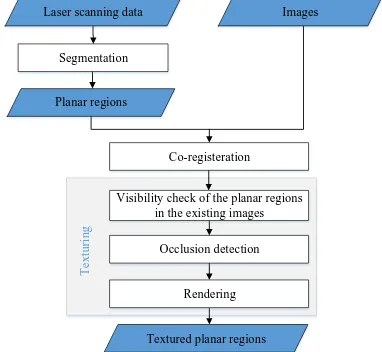
El-Hakim et al., 2003; Alshawabkeh and Haala, 2005; Bannai et al., 2007; Xu et al., 2010; Chen et al., 2012). These approaches also suffer from the computational inefficiency of point-based texturing approaches due to point-by-point projection of the scanning point cloud onto the image/images. The other shortcoming of point-by-point projection – in both of the introduced point-based and surface-based texturing approaches – is the occlusion problem. This problem occurs when two laser scanning points, at the vicinity of abrupt surface changes, are competing for the same image location. In order to identify and resolve instances of this problem during the texturing procedure, different point-based visibility analysis techniques have been proposed (Ahmar et al., 1998; Kuzmin et al., 2004; Habib et al., 2007). The majority of these approaches suffer from the computational inefficiency and cannot accurately identify instances of occlusion problems in complex scenes. In order to overcome the drawbacks of the aforementioned techniques, a new segmentation-based texturing approach is introduced in this paper. This approach improves the computational efficiency of the texturing procedure and provides photo-realistic textures along the laser scanning-derived surfaces (segments). Moreover, a region-based occlusion/visibility analysis procedure is proposed to resolve instances of the occlusion problem. Figure 1 shows the outline of the proposed method for texturing laser scanning-derived surfaces using overlapping images.
T
e
x
tu
ri
n
g
Images
Planar regions Segmentation Laser scanning data
Co-registeration
Visibility check of the planar regions in the existing images
Occlusion detection
Rendering
Textured planar regions
Figure 1. The outline of the proposed texturing approach
This paper starts by the introduction of the utilized segmentation approach for the extraction of planar regions from laser scanning point cloud. The next section introduces the proposed approach for texturing of segmented planar surfaces using imagery. The newly-developed visibility analysis and occlusion detection approaches are also described in this section. Afterwards, experimental results with real data are presented to verify the feasibility of the proposed approach for texturing laser scanning-derived surfaces using overlapping images. Finally, concluding remarks and recommendations for future research work are summarized.
2. PLANAR FEATURES SEGMENTATION
In this paper, the parameter-domain segmentation approach proposed by (Lari and Habib, 2014) is utilized for the extraction of planar regions from laser scanning data. In the first step of this segmentation approach, a Principal Component Analysis (PCA) of local neighborhoods of individual laser scanning points is performed to detect and model potential planar
neighborhoods within the laser scanning point cloud (Pauly et al., 2002). Afterwards, geometric attributes which describe the detected planar neighnorhoods are estimated using an adaptive cylindrical buffer defined based on the PCA outcome (Figure 2). This cylindrical buffer is a modified version of adaptive cylinder neighborhood proposed by Filin and Pfeifer (2005). The diameter of this cylindrical buffer is specified by the distance between the query point and its nth-nearest neighbor, where n is the number of points required for reliable plane definition while considering the possibility of having some outliers. The orientation of the cylinder axis is adaptively changing to be aligned along the normal to the plane through the majority of the neighboring points and the height of this cylindrical buffer – maximum normal distance between a neighboring point and best fitted plane – is usually determined based on the noise level in the point cloud coordinates.
Local planar neighborhood
QP
Figure 2. Adaptive cylindrical buffer of a query point (QP) belonging to a planar neighborhood
The implemented cylindrical buffers are then employed for the estimation of local point density variations along the involved planar surfaces. The estimated local point density indices are utilized to refine the characteristic attributes for planar features segmentation. In order to speed up the segmentation process, the classification and representation of local planar neighborhoods is followed by a region growing procedure to aggregate all the points which belong to planar features into groups based on the estimated local point density indices. Further processing steps are carried out for the individual groups of planar surfaces rather than the entire points classified as being part of these surfaces.
The segmentation attributes associated with the individual laser points, which belong to local planar neighborhoods, are then defined as the coordinates of the origin point’s projection onto the best-fitted plane (X0, Y0, Z0) to that planar neighborhood.
Afterwards, a clustering approach is utilized for the detection and extraction of the accumulated peaks in the attribute space. In this segmentation approach, the estimated attributes are firstly organized in a kd-tree structure, which is manipulated for peak detection. A novel peak detection approach is then implemented, for which an appropriate extent of the cluster is estimated while considering acceptable deviation (angular and spatial) among the attributes of coplanar points. All the points in the parameter domain are checked to count the number of their neighboring points within the established cluster extent. The attribute point with the highest neighbors’ count is chosen as the peak. The points in the spatial domain whose attributes are the constituents of the detected peak are then considered as one segment and removed from the parameter domain. The search for the highest count peaks is continued until the number of detected attribute points in the identified peak is less than the size of the smallest region to be segmented. The disadvantage of such a segmentation procedure is that the points belonging to coplanar but spatially disconnected planes will be segmented into the same cluster. In order to resolve this ambiguity, a neighborhood analysis is conducted through boundary detection
of the clustered points using the modified convex hull algorithm (Jarvis, 1977).
3. TEXTURING
In order to take advantage of the complementary characteristics of laser scanning data and images for the interpretation of segmented planar surfaces, a new texturing procedure is introduced in this section. The objective of this procedure is to texture the outcome from the laser scanning data segmentation (i.e., the planar features) using single/overlapping images. Rather than assigning the texture on a point-by-point basis, which is how it was implemented in the previously-developed texturing approaches, the proposed procedure will be based on polygonal image-to-object rendering.
To ensure that both the laser scanning data and the images can be linked together with their fully synergistic properties, prerequisite procedures such as camera calibration and co-registration of both datasets should be performed to provide the Interior Orientation Parameters (IOPs) of the utilized imaging sensor and the Exterior Orientation Parameters (EOPs) of the available images. The proposed texturing procedure is then initiated by investigating the partial/full visibility of the segmented planar regions in the available imagery. Once the visibility of the segmented regions in the available imagery is checked, an occlusion detection procedure is performed to check if a planar region is occluding/being occluded by other regions in the field of view of existing images. In the next step, the segmented planar regions are decomposed based on their visibility within the available images. Finally, a rendering procedure is implemented to visualize the textured planar regions on the screen. The detailed explanation of these steps will be presented in the following subsections.
3.1 Visibility check
In this subsection, a visibility analysis procedure is introduced and implemented to check if a segmented planar region is fully or partially visible in the available imagery. One should note that this procedure does not consider whether the region of interest is occluded by other regions in the field of view of a given image. In the first step of this procedure, the suitability of available images for the texturing of a planar region is investigated while considering the angle between the region surface normal and the optical axis of the image. For a given region, the image in question is considered to be appropriate for the texturing procedure only if the region surface normal makes an acute angle with the optical axis of the image.
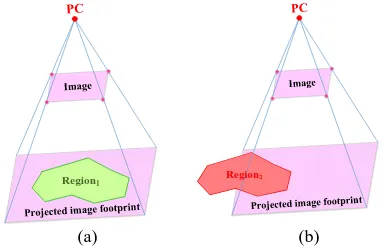
For the images which satisfy the abovementioned condition, the image footprint (the four corners of each image) is then projected onto the infinite plane encompassing the planar region of interest using collinearity equations, while enforcing the plane equation of the region of interest. The overlap area between the projected image footprint and the planar region of interest is then identified to determine if the planar region is fully or partially visible within the image in question. The overlap area between two planar regions is identified using the Weiler-Atheron algorithm (Weiler and Atherton, 1977). The planar region of interest is fully visible in an image if it is completely covered by the projected image footprint (Figure 3.a). On the other hand, the region of interest is partially visible in an image if more than the pre-specified percentage of the region area is covered by the projected image footprint (Figure 3.b). Once this visibility check is carried out for all planar regions in all images, a list of the appropriate images that could be used for the texturing of a given region is established.
Region1
Region2
(a) (b)
Figure 3. Representation of (a) a fully visible region and (b) a partially visible region in an image
3.2 Occlusion detection
The objective of this step is to investigate whether the visible part of a planar region in an image is occluding/being occluded by the other regions in the field of view of that image. An option for conducting this test is to check whether or not every point in the overlap area between the region of interest and the footprint of the image in question is visible in that image. A point will be visible in a given image if the line of sight connecting the perspective center of the image to that point does not intersect any other region. A problem with this option is that we can derive an infinite number of points in the overlap area between a given region and the projected image onto that region. Therefore, the visibility analysis of these points in the given image will be time and memory consuming.
In order to overcome these drawbacks, an alternative occlusion detection approach will be adopted in this section. The conceptual basis of this alternative process is based on the boundaries (inner and outer boundaries) of the segmented region as well as their intersection with the footprint of the image in question. This procedure is implemented by checking whether or not a boundary point is visible in a given image. This visibility analysis is performed by intersecting the line segment connecting the perspective center of a given image and the boundary point in question with all the regions that are visible in that image. If the intersection point is outside the investigated region, the boundary point is not occluding/ being occluded by that region within the image in question (Figure 4.a). Alternatively, if the intersection point happens to be inside the investigated region, the boundary point is either occluding or being occluded by the intersection point (Figure 4.b).
Figure 4. Visibility analysis of a planar region’s boundary point in a given image, (a) intersection point outside of region
boundary (b) intersection point inside region boundary
The boundary point will be occluded by the intersection point if the latter is closer to the perspective center than the former. On the other hand, the boundary point will be occluding the intersection point if the former is closer to the perspective center. In the first case, where the boundary point of the region of interest is occluded, the boundary points of the occluding region are projected onto the region of interest to determine the part of that region which is occluded in the given image. This occluded part is identified by intersecting the planar region of interest with the projected occluding region onto the infinite plane of that region (Figure 5).
Visible region of interest Occluding
region Line of sight
Boundary point
Infinite plane
Projected occluding region
Figure 5. Identification of the occluded part of the region of interest (projection of boundary points of the occluding region
onto the region of interest’s infinite plane)
In the second case, where the region of interest is occluding another region, two different situations may happen:
1. All the boundary points of the region of interest are projected inside the occluded region (Figure 6.a).
2. A portion of the boundary points of the region of interest are projected inside the occluded region (Figure 6.b). The first situation can be solved by projecting the boundary points of the region of interest onto the occluded region and the second situation will be handled when the occluded region becomes the region of interest.
Region of interest
Boundary point
Occluded region
Line of sight
Intersection point
Occluded area/hole
Region of interest
Boundary point
Occluded region
Line of sight
Intersection point
Occluded area
(a) (b)
Figure 6. The occlusion of other regions by the region of interest (a) all the boundary points of the region of interest are
projected inside the occluded region and (b) a section of the boundary points are projected inside the occluded region
For each of the visible regions in an image, one can sequentially trace the visible boundary points, the points along the image footprint intersection with the region, if they happen to be inside the region, and the internal points that are occluded by the boundary points of the other regions. The outcome of this
procedure, for a given region, will be the sub-regions that are visible in different images.
3.3 Decomposition of planar regions according to their visibility within available images
Once the visible part/parts of the planar regions within available images are identified through the proposed procedures in the previous two subsections, the segments of these parts which should be textured using the individual images should be identified. In this section, a decomposition approach is introduced to determine these segments within planar regions. In other words, the objective of this procedure is to identify which parts of each planar region will be textured as best as possible using individual images. In this case, we are dealing with one of the following three scenarios:
1. In the first scenario, the entirety of a given region is visible in a single image. In order to render this region, all of its boundary points are projected onto that image and the part of the image within the projected boundary will be rendered onto the given region.
2. In the second scenario, the entirety of a given region is simultaneously visible in several images. In this case, the texturing of the region of interest is carried out using the image that has the best homogenous sampling distance along that region. The image which has the best homogenous sampling distance is defined as the image which is closest to the region of interest and has the smallest angle between the surface normal and the optical axis of the image.
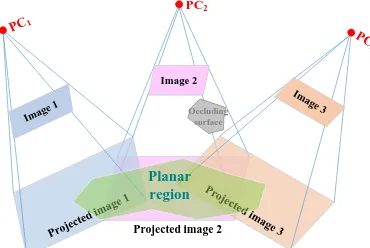
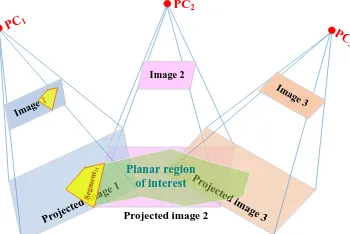
3. In the third scenario, the region of interest is composed of sub-regions which are visible in several images (Figure 7). The rendering of such a region is carried out by decomposing the visible sub-regions into the parts which are visible in single or multiple images. In order to identify these parts, the visible sub-regions in the individual images first are intersected together using the Weiler-Atheron algorithm. One should note that the occluded parts of the visible sub-regions in each image were identified in the previous step. Figure 8 shows the visible sub-regions in each image and Figure 9 shows the outcome of intersecting these regions. The intersected parts of the visible sub-regions represent the segments which are visible in multiple images (segment12 and segment23). The overlap areas between the sub-regions (i.e., the segments that are visible in multiple images) are then subtracted from the individual sub-regions to identify the segments which are visible in a single image (i.e., segment11, segment22, and segment23).
Projected image 2 PC2
Image 2
Planar region
Occluding surface
Figure 7. A planar region which is partially visible in the overlapping images
Projected image 2 Occluded
region
Sub-region2
Figure 8. Visible sub-regions of the planar region in the overlapping images
Segment22
Occluded region
Segment11 Segment12 Segment33
Segment23
Figure 9. The intersection between visible sub-regions in each image
For the segments which are visible in a single image, the rendering procedure is carried out by projecting their boundary points onto that image and selecting the part of the image within the projected boundary for texturing that segment (Figure 10). However, for the segments which are visible in multiple images, the rendering procedure is carried out using all the images encompassing those segments. Accordingly, the boundary points of such a segment are projected onto all of the images enclosing that segment. In this case, the projected boundary onto the image which has the best sampling distance along that segment is selected as the texture master. In order to incorporate the spectral information from other enclosing images into the master texture, the correspondence between the conjugate pixels within the projected boundary onto the images in question is established using a 2D projective transformation. The assigned color to a pixel within the master texture is determined by averaging the colors of its conjugate pixels in all images enclosing the projected boundary in question. The intersected segment then will be textured using the established master texture (Figure 11).
Projected image 2 PC2
Image 2
Planar region of interest
Figure 10. Rendering a segment which is visible in a single image (segment11)
Projected image 2 PC2
Image 2
Region of interest Master texture
Figure 11. Rendering a segment which is visible in two images
3.4 Rendering and visualization
Once the parts of planar regions are decomposed according to their visibility within individual images, a rendering procedure should be implemented to render and visualize them on the screen. The objective of this procedure is to apply the identified textures, within the images, to the segmented planar surface in 3D space and visualize the textured surfaces on the 2D screen. More specifically, in rendering procedure, the clipped textures are rendered onto the segmented planar surface in 3D object space, which is then mapped to the destination image (on the screen) using projective transformation.
In this research, the transformation between object space and texture space was already established using the collinearity equations in the previous section while the transformation between the object space and screen is carried out using the Open Graphics Library (OpenGL) software interface (Shreiner, 2009). In order to optimize the performance of the rendering procedure, OpenGL is only able to render convex and solid planar surfaces onto 2D screen space. However, in reality, we are also dealing with concave planar surfaces, planar surfaces with holes, and complex planar surfaces. In order to handle the projection of theses surfaces onto a 2D screen, they should be tessellated into simple convex polygons. Therefore, the Delaunay triangulation algorithm (Bowyer, 1981; Watson, 1981) is utilized to subdivide concave, hollow, and complex polygons into easier-to-render convex polygons (triangles). Since the correspondence between texture space and object space has already been established through the texturing procedure, the vertices of the derived triangles, in the object space, are identified on the assigned texture to the planar region of interest to determine the parts of the texture that belongs to those triangles. The clipped textures are then rendered onto the triangles and visualized in 2D screen space.
One should note that the identified textures and the objects to be textured, on the screen, are rarely the same size in pixels. Therefore, filtering techniques should be applied to determine how each pixel, in the original texture image, should be expanded or shrunk to match a screen pixel size (Figure 12). In this case, the color information for each pixel on the screen should be simulated or interpolated based on the utilized texture image. If the quality of the texture image is less than the screen resolution, the color information for each pixel in the filtered texture image is sampled using the color information from the nearest neighboring pixel in the original texture image. However, if the quality of the texture image is higher than the screen resolution, the assigned color to each pixel in the filtered texture is derived by linear interpolation of its neighboring pixels in the original texture image.
Texture
Screen object
Magnification
Texture
Screen object
Minification
Figure 12. Filtering methods for adapting a texture image to the screen resolution
4. EXPERIMENTAL RESULTS
In this section, experiments using the segmented planar regions from an airborne laser scanning data and overlapping images
are conducted to verify the feasibility of the proposed texturing approach. This texturing procedure is performed to facilitate the interpretation of the laser scanning-derived surfaces. The utilized dataset for this experiment includes six overlapping airborne laser strips and eight aerial images captured over an urban area in Calgary, Canada. The airborne laser scanning data was acquired by an Optech ALTM 3100 laser scanner and aerial images were collected using an RC30 analogue camera. This dataset was acquired from a flying height of 770m, with a ground sampling distance of 6cm for the images and an average point density of 2pts/m2 for the laser scanning data. Figures 13.a and 13.b show one of the aerial images and the laser scanning data (displayed in different colors according to the height) over the area of interest, respectively.
(a) (b)
Figure 13. (a) An aerial photo and (b) and airborne laser scanning data colored according to height over the area of
interest (University of Calgary campus)
The utilized laser scanning point cloud is initially segmented to establish the individual planar regions which will be textured using the images. This dataset includes 421,974 points, where 387,643 of them have been segmented into 72 planar regions. Figures 14.a shows the planar features segmentation outcome for this point cloud. The boundary points of the segmented planar regions (inner and outer boundary points) are then detected and utilized for texturing these regions using the available images. Figures 14.b shows the boundaries of the segmented planar regions within the utilized laser scanning point cloud. The segmented planar regions are finally textured using the texturing approach introduced in the previous section. The laser scanning points which had not been segmented into planar regions were then individually projected onto the image space and colored using the spectral/color information of the nearest neighboring pixel to the projected image coordinates, after visibility analysis using the Z-buffer approach.
(a) (b)
Figure 14. (a) Planar feature segmentation and (b) boundary detection outcome for the utilized laser scanning dataset
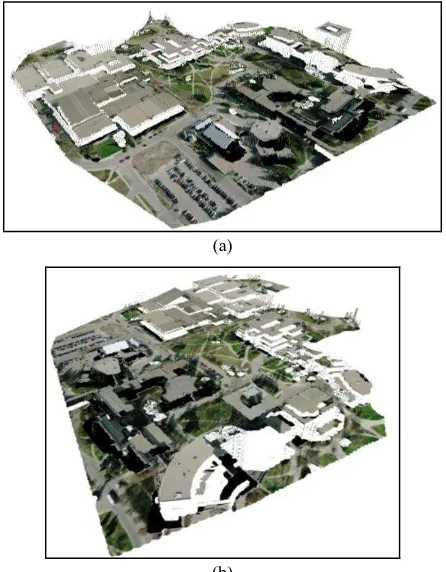
Figures 15.a and 15.b show two different views from the textured 3D planar regions and colored non-segmented points of the areas of interest while considering the occlusion problems (the occluded areas are visualized in black color). Qualitative evaluation of the derived texturing results through visual inspection of Figures 15.a and 15.b verifies the feasibility
of the proposed approach for the texturing planar regions using overlapping images while considering the visibility of those regions within the images.
(a)
(b)
Figure 15. (a, b) Two different views from the textured planar regions and individually colored non-segmented points
5. CONCLUSIONS AND RECOMMENDATIONS FOR FUTURE RESEARCH WORK
This paper introduced a new region-based texturing procedure for the establishment of the link between the laser scanning positional and the images’ spectral information. This texturing procedure is implemented while investigating the visibility of the segmented planar regions in the provided images. This investigation is conducted in two steps: 1) a new visibility analysis technique is utilized to identify the visible parts of a given region within the individual images, and 2) a new occlusion detection approach is implemented to check whether the visible part/parts of a region in an image is occluding/being occluded by the other regions. The proposed visibility analysis technique overcomes the computational inefficiency of existing approaches (i.e., the approaches which are implemented based on point-based texturing procedures) by checking the visibility of the boundary points of a given region rather than its entire points. Once the visibility of the segmented regions within the existing images is checked, a decomposition technique is applied to identify the parts of the segmented planar regions which should be textured using individual images. A rendering procedure is finally performed in an OpenGL environment to apply the 2D texture images onto the segmented planar regions. Qualitative evaluation of the derived segmentation results verified the feasibility of the proposed approach for texturing of laser-scanning derived surfaces.
In conclusion, the introduced texturing procedure resolves the computational inefficiency of the point-based texturing technique and provides continuous spectral information along the segmented planar regions. The textured 3D surfaces can be
ultimately utilized for different surface interpretation, object extraction, modelling, and monitoring applications. Future research work will be focused on the extension of the proposed approach for texturing non-planar surfaces (e.g., linear/cylindrical features, cones, spheres) to provide completely textured scenes. In addition, the assigned textures to the segmented planar regions can be processed using image processing techniques (e.g., image segmentation) to identify and quantify characteristics of individual planar features (e.g., possible deteriorations or cracks that have not been properly represented in the laser scanning point cloud).
ACKNOWLEDGEMENTS
The authors would like to thank Tecterra and the Natural Sciences and Engineering Research Council of Canada Discovery and Strategic Project Grants (NSERC) for financial support of this research work.
REFERENCES
Ahmar, F., Jansa, J., Ries, C., 1998. The generation of true orthophotos using a 3D building model in conjunction with a conventional DTM, in: International Archives of Photogrammetry, Remote Sensing and Spatial Information Science. 32 (Part 4), pp. 16–22.
Alshawabkeh, Y., Haala, N., 2005. Automatic multi-image photo-texturing of complex 3D scenes, in: Proceedings of CIPA 2005 XX International Symposium. Torino, Italy.
Bannai, N., Fisher, R.B., Agathos, A., 2007. Multiple color texture map fusion for 3D models. Pa ttern Recognition Letters. 28, 748–758.
Bowyer, A., 1981. Computing Dirichlet tessellations. Computer Journal. 24, 162–166.
Chen, Z., Zhou, J., Chen, Y., Wang, G., 2012. 3D texture mapping in multi-view reconstruction, in: Advances in Visual Computing, Lecture Notes in Computer Science. Springer, Berlin, Germany, pp. 359–371.
El-Hakim, S.F., Remondino, F., Voltolini, F., 2003. Integrating techniques for detail and photo-realistic 3D modelling of castles. GIM Int 22 21–25.
El-Omari, S., Moselhi, O., 2008. Integrating 3D laser scanning and photogrammetry for progress measurement of construction work. Automation in Construction. 18, 1–9.
Filin, S., Pfeifer, N., 2005. Neighborhood systems for airborne laser data. Photogramm. Eng. Remote Sens. 71, 743–755. Guelch, E., 2009. Advanced matching techniques for high precision surface and terrain models, in: Proceedings of Photogrammetric Week 2009. Heidelberg, Germany, pp. 303– 315.
Habib, A., Ghanma, M., Mitishita, E.A., 2004. Co-registration of photogrammetric and LiDAR data: methodology and case study. Brazilian Journal of Cartography. 56, 1–13.
Habib, A., Kim, E.M., Kim, C., 2007. New methodologies for true orthophoto generation. Photogrammetric Engineering and Remote Sensing. 73, 25–36.
Habib, A., Schenk, T., 1999. New approach for matching surfaces from laser scanners and optical sensors, in:
International Archives of Photogrammetry, Remote Sensing and Spatial Information Sciences. 32(3-W14), pp. 55–61.
Jarvis, R. A., 1977. Computing the shape hull of points in the plane. in: Proceedings of the IEEE Computing Society
Conference on Pa ttern Recognition and Image Processing, pp. 231-241.
Kazhdan, M., Bolitho, M., Hoppe, H., 2006. Poisson surface reconstruction, in: Proceedings of Symposium on Geometry Processing 2006. pp. 61–70.
Kim, C., Habib, A., 2009. Object-based integration of photogrammetric and LiDAR data for automated generation of complex polyhedral building models. Sensors 9, 5679–5701. Koch, M., Kaehler, M., 2009. Combining 3D laser-scanning and close-range Photogrammetry: An approach to exploit the strength of both methods, in: Proceedings of the 37th International Conference of Computer Applications in Archaeology. Williamsburg, Virginia, USA, pp. 1–7.
Kraus, K., 1993. Photogrammetry, Vol.1, Fundamentals and Standard Processes. Dummler Verlag, Bonn.
Kuzmin, Y.P., Korytnik, S.A., Long, O., 2004. Polygon-based true prthophoto generation, in: International Archives of Photogrammetry, Remote Sensing and Spatial Information Science. 35. pp. 529–531.
Lamond, B., Watson, G., 2004. Hybrid rendering - a new integration of photogrammetry and laser scanning for image based rendering, in: Proceedings of Theory and Practice of Computer Graphics. pp. 179–186.
Lari, Z., Habib, A., 2014. An adaptive approach for the segmentation and extraction of planar and linear/cylindrical features from laser scanning data. ISPRS Journal of Photogrammetry and Remote Sensing. 93, 192–212.
Pauly, M., Gross, M., Kobbelt, L.P., 2002. Efficient simplification of point-sampled surfaces, in: Proceedings of the Conference on Visualization (VIS) 2002. IEEE Computer Society, Washington, DC, USA, pp. 163–170.
Shreiner, D., 2009. OpenGL Programming Guide: The Official Guide to Learning OpenGL, Versions 3.0 and 3.1 (7th Edition). Addison-Wesley Professional, Indianapolis, IN, USA.
Vosselman, G., Gorte, B.G.H., Sithole, G., Rabbani, T., 2004. Recognising structure in laser scanner point clouds, in: The International Archives of the Photogrammetry, Remote Sensing and Spatial Information Sciences, 8-W2. pp. 33–38.
Wang, L., Kang, S.B., Szeliski, R., Sham, H.Y., 2001. Optimal texture map generation using multiple views, in: Proccedings of Computer Vision and Pa ttern Recognition 2001. pp. 347–354. Watson, D.F., 1981. Computing the n-dimensional Delaunay tessellation with application to Voronoi polytopes. Computer Journal. 24, 167–172.
Weiler, K., Atherton, P., 1977. Hidden surface removal using polygon area sorting, in: Proceedings of the 4th Annual Conference on Computer Graphics and Interactive Techniques, SIGGRAPH ’77. ACM, New York, NY, USA, pp. 214–222. Xu, L., Li, E., Li, J., Chen, Y., Zhang, Y., 2010. A general texture mapping framework for image-based 3D modeling, in:
Proceedings of 17th IEEE International Conference on Image Processing (ICIP). pp. 2713–2716.