UTILIZING THE GLOBAL LAND COVER 2000 REFERENCE DATASET FOR A
COMPARATIVE ACCURACY ASSESSMENT OF GLOBAL 1 KM LAND COVER MAPS
M. Schultz a, N.E. Tsendbazar a, M.Herold a,*, M.Jung b, P. Mayaux c, H. Goehmann d
a
. Laboratory of Geo-Information Science and Remote Sensing, Wageningen University – (michael.schultz, nandin.tsendbazar, martin.herold)@wur.nl
b
. Department of Biogeochemical Integration, Max Planck Institute for Biogeochemistry - [email protected] c
. Institute for Environment and Sustainability, European Commission, Joint Research Centre - [email protected] d
. Institute of Geography, University of Jena – [email protected]
KEY WORDS: global land cover, accuracy assessment, comparison, reference dataset, landscape heterogeneity
ABSTRACT:
Many investigators use global land cover (GLC) maps for different purposes, such as an input for global climate models. The current GLC maps used for such purposes are based on different remote sensing data, methodologies and legends. Consequently, comparison of GLC maps is difficult and information about their relative utility is limited. The objective of this study is to analyse and compare the thematic accuracies of GLC maps (i.e., IGBP-DISCover, UMD, MODIS, GLC2000 and SYNMAP) at 1 km resolutions by (a) re-analysing the GLC2000 reference dataset, (b) applying a generalized GLC legend and (c) comparing their thematic accuracies at different homogeneity levels. The accuracy assessment was based on the GLC2000 reference dataset with 1253 samples that were visually interpreted. The legends of the GLC maps and the reference datasets were harmonized into 11 general land cover classes. There results show that the map accuracy estimates vary up to 10-16% depending on the homogeneity of the reference point (HRP) for all the GLC maps. An increase of the HRP resulted in higher overall accuracies but reduced accuracy confidence for the GLC maps due to less number of accountable samples. The overall accuracy of the SYNMAP was the highest at any HRP level followed by the GLC2000. The overall accuracies of the maps also varied by up to 10% depending on the definition of agreement between the reference and map categories in heterogeneous landscape. A careful consideration of heterogeneous landscape is therefore recommended for future accuracy assessments of land cover maps.
* Corresponding author
1. INTRODUCTION
The consistent and continuous observation of land cover is one of the most important foundations for understanding the Earth’s environment and ecosystems (Verburg et al., 2011). Currently, several global land cover datasets (GLC) have been developed and these datasets are evolving towards higher spatial resolution (Gong et al., 2013; Mora et al., 2014) . Most GLC maps were developed by individual groups as one-time efforts and the subsequent mapping standards reflect the varied interests, requirements and methodologies of the originating programs (Herold et al., 2006). These differences of GLC maps and the effects of their quality on the model outcome are not always considered when selecting a map as an input for specific modeling applications (Verburg et al., 2011). Uncertainties of GLC maps can result in considerable differences in modeling outcomes (Hibbard et al., 2010; Nakaegawa, 2011; Verburg et al., 2011).
The accuracies of GLC maps are assessed using independent validation datasets and regional maps or cross validated against training datasets. The results of accuracy assessments of previous maps indicate that overall area-weighted accuracy is around 70% for the existing GLC maps (Defourny et al., 2012). However, the use of different approaches in the GLC map production (e.g., classification scheme, data sources and algorithms) as well as in validation data collection (e.g., sampling scheme, data source and method of reference classification) raise inconsistency issues and make map comparisons difficult. Several comparative analyses of land
cover maps were conducted at regional levels (Heiskanen, 2008; Wu et al., 2008) and global level (Giri et al., 2005; Jung et al., 2006; McCallum et al., 2006; See & Fritz, 2006; Fritz et al., 2011). However, most studies used thematic per-pixel agreement among the maps to assess and compare datasets without quantifying their uncertainties. These efforts assume thematic agreement among datasets as surrogate for more certain land cover characterization. This assumption is generally applicable in particular in areas where there is agreement among the datasets (Herold et al., 2008). Till date, there has been no systematic study that compares the thematic accuracy of existing GLC maps in order to identify best available maps for GLC.
This study aims to compare GLC maps and highlight general patterns of uncertainty in them in order to support informed use of GLC maps. We used the Global Land Cover 2000 (GLC2000) GLC reference sites (Mayaux et al., 2006) for comparative accuracy assessment of five GLC maps with 1 km resolution (IGBP-DISCover, UMD, MODIS, GLC2000 and SYNMAP). This reference dataset has been developed using a flexible land cover characterization based on classifiers of the UN Land Cover Classification System (LCCS) (Di Gregorio, 2005). Utilizing this reference dataset and existing 1 km GLC maps, the objectives of this paper are to:
• Process and analyze the GLC 2000 reference dataset • Harmonize the land cover classes into a generalized
GLC legend of eleven classes based on LCCS • Perform a global comparative accuracy assessment of
2. DATA AND METHODS 2.1 Global land cover maps
Five existing GLC maps were analysed and compared in this study. Descriptions of these maps are shown in Table 1.
Map name Time of
data collection
Input data Classification method
Classificat
ion scheme Reference
IGBP-Table 1. Description of GLC maps used in comparative accuracy assessment
The IGBP-Discover map was based on monthly global NDVI-AVHRR composites for the period April 1992-March 1993 (Loveland et al., 2000). Similar to the IGBP map, the GLC map of the University of Maryland (UMD) used NDVI-AVHRR time series (Hansen et al., 2000). The MODIS GLC maps used the enhanced spectral information from the MODIS sensor. This map is based on a supervised classification approach with a multi-temporal decision tree algorithm to assign the most probable class for each location based on the IGBP classification scheme (Friedl et al., 2002). The development of the Global Land Cover 2000 (GLC 2000) map combined and harmonized 19 regional land cover maps that were based on 1 km SPOT4-VEGETATION data from November 1999 to December 2000 (Bartholomé & Belward, 2005). The regional maps were merged to one GLC map with LCCS-based 22 classes. The SYNMAP product was derived as synergy map among existing GLC maps described above with a legend suitable for carbon modeling purposes (Jung et al., 2006).
2.2 A generalized global land cover legend for comparative analysis
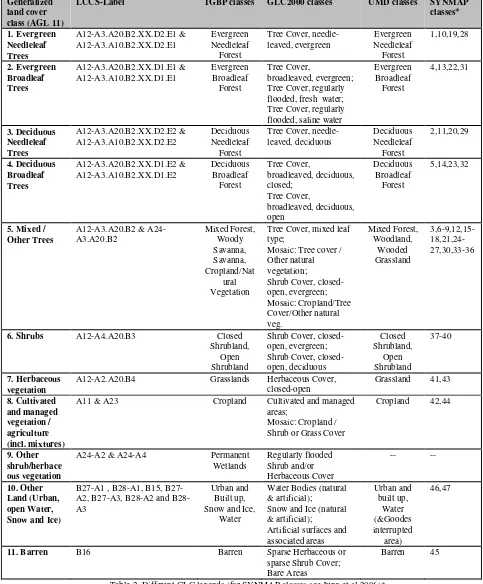
The land cover categories of the maps were harmonized into a generalized 11 classes based on LCCS in order to reduce the thematic heterogeneity among the maps. The LCCS, a language for building, translating and comparing land cover legends, provides a flexible system to describe land cover features at any scale or level of detail with an absolute level of standardization of class definitions between different users (Di Gregorio, 2005; Herold et al., 2006). The generalization process builds on the LCCS translation work documented in Herold et al. (2008). The original legends for GLC2000 and SYNMAP are based on LCCS classifiers and are, thus, easily translated into a common LCCS-based generalized legend. The LCCS-translations for the IGBP and the UMD legends followed the method of Herold et al. (2008). From the legend translations to LCCS, the common
denominator of all included legends results in a set of eleven aggregated classes (AGL11), which is shown in Table 2.
The legend translation was problematic for a few classes due to the thematic differences between the maps. For instance, forest definition was different among the maps, i.e., minimum tree cover should be at least 15 % for the GLC2000 and SYNMAP whereas, it is 60 % for the IGBP and UMD. This difference could be resolved by labeling the IGBP classes 8 and 9 and the UMD classes 6 and 7 as tree categories. These categories, as well as, tree class with no specifics in leaf type and longevity (e.g. mixed forest or IGBP savannah classes) were combined to the class Mixed/Other trees. The category “Other shrub/herbaceous vegetation” represents non-tree vegetation with no further specifications of life form, leaf type and longevity. This category basically reflects non-forested wetlands in maps except SYNMAP and UMD that do not categorize this land cover type.
2.3 Processing of GLC2000 reference dataset
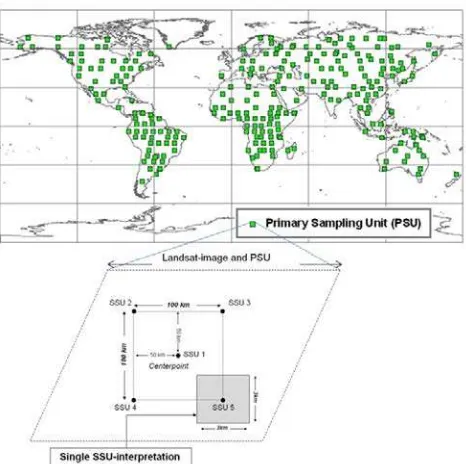
We used a reference dataset that was developed for the accuracy assessment of the GLC2000 map. The design procedures for deriving the reference dataset are described in Mayaux et al. (2006). The sampling design used two-stage stratified clustered sampling. The stratification was based on the proportion of priority classes and on the landscape complexity. The Landsat World Reference 2 System was used as primary sampling frame to derive 253 Primary Sampling Units (Figure 1). Within each PSU, five Secondary Sampling Units (SSU) with 3x3km area were derived. In total, 1265 SSU were interpreted by international experts using Landsat scenes. Land cover type within each 3x3 km box was characterized according to LCCS classifiers (Mayaux et al., 2006).
Generalized land cover class (AGL 11)
LCCS-Label IGBP classes GLC2000 classes UMD classes SYNMAP classes*
Tree Cover, mixed leaf type;
Mosaic: Tree cover / Other natural
6. Shrubs A12-A4.A20.B3 Closed
Shrubland,
A12-A2.A20.B4 Grasslands Herbaceous Cover, closed-open
A11 & A23 Cropland Cultivated and managed
areas;
Mosaic: Cropland / Shrub or Grass Cover
Cropland 42,44
9. Other shrub/herbace ous vegetation
A24-A2 & A24-A4 Permanent Wetlands
A1 , B28-A1, B15, B27-A2, B27-A3, A2 and B28-A3 Snow and Ice (natural & artificial);
11. Barren B16 Barren Sparse Herbaceous or
sparse Shrub Cover; Bare Areas
Barren 45
Three step analyses have been performed to ensure the quality and consistency of the GLC2000 reference dataset (Figure 2).
Figure 2. Steps followed for the quality and consistency check of the GLC2000 reference dataset
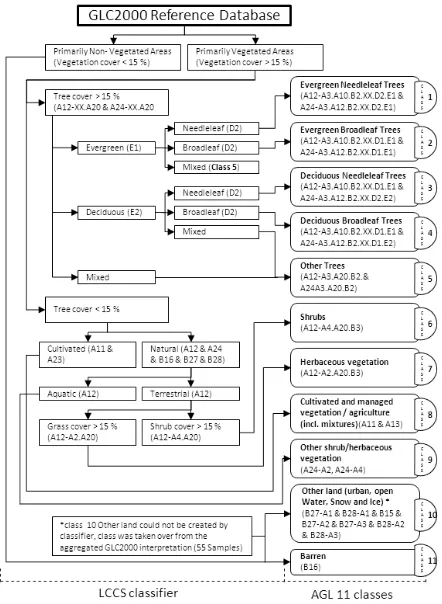
Firstly, we re-interpreted randomly selected 10% of all sample sites as a quality check. To guide the visual interpretation, the Landsat scenes were classified using ISODATA classification to estimate the class percentages. In total 126 samples were processed and 95% of all considered samples had the same class descriptions as the reference dataset. Secondly, we conducted a consistency check in the legend for the whole dataset (Figure 3). We translated the GLC2000 class descriptions into AGL11 legend and compared this AGL11 classes with LCCS classifier information of the GLC2000 data to identify inconsistencies in the reference dataset legend description. The LCCS classifier information in the reference dataset was not always detailed and stringent enough to allow a proper translation in particular for different forest types. Finally, we reinterpreted the entire reference dataset using Landsat data and very high resolution satellite images from Google Earth in order to assess the consistency of AGL11 translation. All samples marked as problematic in the first quality assessment were thoroughly reinterpreted. In total 1253 samples were flagged as finally usable. The remaining 12 were omitted since they did not have sufficient land cover information in the original dataset.
2.4 Accuracy analysis and reporting
The thematic accuracies of the GLC maps were calculated using confusion matrices. The confusion matrices were adjusted by accounting for the spatial extent of classes on the map to create area weighted confusion matrices. Area weighted overall accuracy and class-specific accuracies were derived following the method described by Card (1982). The variance and confidence level of the accuracies were calculated using the equations for stratified random sampling (Card, 1982; Olofsson
et al., 2013). Area estimation of land cover classes (true marginal map proportion) were corrected based on the area weighted confusion matrices.
Figure 3. Internal consistency check: Process of translating the LCCS classifiers from the GLC2000 reference dataset into the
11 generalized classes
Comparison of the reference categories and the map categories involved the consideration of the spatial heterogeneity in the sample unit area. Reference land cover category is for 3x3 km SSU area which equals to 3x3 pixels for the maps. The homogeneity of the reference point (HRP) was calculated describing how many different map categories correspond to the reference category which reflects the landscape heterogeneity. If all nine pixels have the same map class, the HRP would be one; if all nine pixels represent different classes, the value reaches the minimum of zero. The accuracy analysis was performed for a range of spatial heterogeneities, i.e. for all reference sample covering the full range of possible HRPs versus reference sample units corresponding to only homogenous map classes. In the latter case, there are less reference SSUs used since all heterogeneous SSUs are excluded.
3. RESULTS 3.1 Accuracy comparison of the GLC maps
The overall accuracy of the GLC maps and number of samples used for the assessment are shown in Figure 4. The overall accuracies were 59%, 55%, 58%, 63% and 71% for the UMD, IGBP, MODIS, GLC2000 and the SYNMAP respectively at HRP level 0. The overall accuracy of the SYNMAP was the highest at any HRP followed by the GLC2000. In contrast, the IGBP provided the lowest accuracies at all level of HRP. Because the number of sample used to assess the MODIS map decreased significantly at higher HRP levels, its confidence in the overall accuracy was the lowest. The ranking of the overall accuracy between all the maps remained similar at all HRP range, except the MODIS at high HRP level.
The overall accuracy of the GLC map was dependent upon the applied HRP. A high level of the HRP resulted in higher overall accuracies of the maps (Figure 4). An increase of the HRP level also resulted in reduced number of accountable samples which led to high confidence intervals of the accuracies (Figure 4). The increase of overall accuracy was 9-14% at the HRP 0.9 level when compared with the HRP level 0. When the HRP was above 0.5 the variation among the number of available sample sites for each GLC maps increased. For instance, the difference between the number of sample sites used for the accuracy assessments of the IGBP and the MODIS maps reached more than 200. Small number of available sample sites at high HRP level may show that these two are more heterogeneous compared with the other maps.
Figure 4. Relationship of HRP, overall accuracy and number of used samples
Class specific accuracies of the GLC maps indicate that evergreen broadleaf trees, barren and other land covers classes were mapped with relatively high accuracy for the maps. On the other hand, mixed forest, shrubs and herbaceous classes were classified with low accuracy. The all maps had higher user’s accuracy than producer’s accuracy for deciduous needleleaf class which indicates under-mapping.
3.2 Validation cases
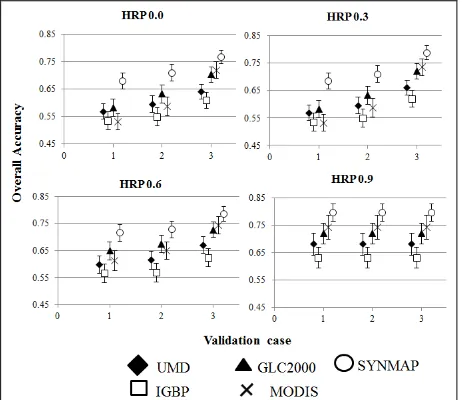
The overall accuracies of the maps were calculated at four different HRP levels for the three validation cases (different definition of agreement between reference and map categories) (Figure 5). Previously it was observed that an increased HRP level resulted in higher overall accuracies but reduced accuracy confidence (Figure 4). This was also true when comparing the accuracy for different validation cases (Figure 5). As expected, the accuracies were the lowest for validation case 1 (pessimistic) and highest for validation case 3 (optimistic). On average, the overall accuracies were 3.8% higher for validation
case 2 than those of validation case 1, while the overall accuracy was around 7% higher for validation case 3 than those of validation case 2 at HRP of 0. An average of 8-10% differences in overall accuracies of the maps were recorded depending on how the agreement between the reference and map categories is defined. The difference in the definition of agreement had a strong influence (up to 20% difference) in the overall accuracy of the MODIS map. Similar trend can also be observed at HRP level 0.3 and 0.6.
Figure 5. Overall accuracy for the maps in different validation case and HRP levels.
At HRP level 0.9, on the other hand, validation cases did not result in different overall accuracies for the maps because all the validation cases were the same at complete homogeneous areas. Since an increased HRP resulted in reduced number of used sample sites, an increase of accuracy uncertainty (confidence interval) can also be observed, lowest at a HRP of 0 and highest at 0.9.
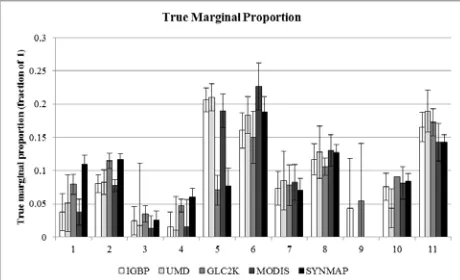
3.3 Marginal proportions of land cover classes
Area estimation of land cover classes (true marginal map proportion) of the GLC maps were adjusted based on the area weighted confusion matrices (Figure 6). Class proportions were varied among the maps. For instance, evergreen needle leaf trees occupy around 4% of the world land area according to the IGBP and MODIS maps, but this class occupies 8% of the world land area for the GLC2000 and 11% in the case of the SYNMAP. Similarly, mixed/other trees occupy around 18-21% according to the IGBP, UMD and MODIS maps, while around 7% in the case of the GLC2000 and SYNMAP. These differences are mostly related to the harmonization issues mentioned in section 2.2.
Figure 6. True marginal proportions of the land cover classes for each datasets.
4. DISCUSSION 4.1 Legend harmonization issues
The study showed that LCCS is useful in the harmonization of different GLC maps. The use of LCCS accommodates a set of standardized tools for synergistic usage of current and future mapping efforts.
However, a shortcoming of this harmonization is a reduced thematic detail of the GLC maps. For instance, the SYNMAP loses more than three quarters of all of its classes due to the legend harmonization. Furthermore, forested classes and other shrub/herbaceous vegetation class were problematic for the legend harmonization. The SYNMAP and GLC2000 legends (15-100%) represent different forest cover threshold than the IGBP legend (60-100%). This is a significant difference in the definition of forest classes and this thematic inconsistency can have an impact on the validity of the accuracy estimates and area estimation. An AGL11 class, ‘Other shrub/herbaceous vegetation’ is presented only in the GLC2000 and IGBP legend. Although, legend harmonization aims to reduce the influence of thematic heterogeneity as much as possible, these inconsistencies are a general limitation in comparing separately developed GLC maps.
4.2 Re-applicability of GLC2000 reference dataset
The GLC2000 reference dataset was used to compare 5 GLC maps with 1 km spatial resolution, and this study showed the possibility of re-using an existing GLC reference dataset with additional considerations such as consistency checking, legend translation, and sample re-interpretation. Since this reference dataset was based on LCCS legend with classifier information, legend translation into AGL11 was possible, although some inconsistencies remained.
The GLC2000 reference dataset was derived using a stratification based on the proportion of priority classes and on the landscape heterogeneity, and this makes the dataset a map dependent. The purpose of a stratification is to increase the precision of the accuracy assessment (Stehman, 2009). Although, there was no significant difference between the standard errors of the map accuracy estimates (Figure 4), the precision of the accuracy estimates for the GLC maps other than GLC2000 may not be optimum, and it is likely to be over-estimated. Nonetheless, the GLC2000 reference dataset can give statistical accuracy estimates since it is based on a probability sampling and provides a large number of samples.
The GLC2000 reference samples have a spatial support area of 3x3 km which covers 9 pixels of the GLC maps. Large sample units can be advantageous when avoiding the impact of positional errors (Stehman & Wickham, 2011). However, this large sample unit area creates a problem in heterogeneous landscape (Stehman & Wickham, 2011) and this is discussed in section 4.3.
In terms of temporal coverage, the use of GLC2000 reference dataset to compare the GLC maps was appropriate since most of the maps (except the IGBP and UMD) and reference dataset were produced for year 2000. The GLC2000 reference dataset was created through a visual interpretation of satellite images, and thus, it is subject to human variability and bias. However, our consolidation of 10% of the samples showed that 95% of the subsample matched with the original interpretation. This suggests the reliability of the reference data. Moreover, with our additional processing of the dataset e.g. translating and re-interpretation, the current version of the GLC2000 reference dataset can provide a reliable reference information for land cover.
A GLC reference dataset that can be used for comparison of different GLC maps should be derived independently from any GLC maps, based on probability sampling and commonly accepted legends like LCCS. Datasets should have MMU that is suitable for any map and flexible sample unit size. Forthcoming validation datasets such as the LC-CCI and GOFC-GOLD meet these requirements (Achard et al., 2011; Olofsson et al., 2012). Nevertheless, the value of the existing GLC validation datasets should not be neglected considering that the existing datasets provide a valuable information and their creation took considerable efforts and resources (Tsendbazar et al., 2014). This consolidated dataset is now available to the public through the Reference Data Portal of the Global Observation for Forest Cover and Land Dynamics (GOFC-GOLD)(GOFC-GOLD, 2014).
4.3 Comparison of GLC maps and impact of the heterogeneity
Previous comparison studies focused on spatial (dis)agreement between different maps (Hansen & Reed, 2000; Giri et al., 2005; Fritz et al., 2011). However, these studies do not inform on which map provides better quality. A comparative accuracy assessment providing information on the best available maps is challenging due to the lack of reference dataset that is applicable to multiple maps. Our study tackles this issue by providing quantitative comparisons of the accuracy of different GLC maps using existing GLC2000 reference dataset. With processing of the GLC2000 reference data and harmonization, it was possible to conduct a comparative accuracy assessment of GLC maps.
The analysis shows that the overall accuracies of the GLC maps varied from 58-71% at HRP level 0. The SYNMAP and GLC2000 maps had highest accuracies followed by the MODIS. The same trend could be shown with increased HRP levels.
We evaluated the accuracy of the GLC maps using different sample sets depending on the HRP levels. Our analysis showed that with increasing level of homogeneity overall accuracy increases by 10-16% for all the GLC maps (Figure 4). This coincides the general tendency of having high classification accuracy in homogeneous landscape and low in heterogeneous landscape (Fritz & See, 2008; Defourny et al., 2012). Heterogeneous landscapes are the main driver for inconsistency in the land cover maps, and it is identified as a major challenge for GLC mapping (Hansen & Reed, 2000; Jung et al., 2006; McCallum et al., 2006; Herold et al., 2008; Wu et al., 2008). To overcome this issue, an accuracy assessment should be based on reference datasets derived from very high spatial resolution images allowing a detailed matching analysis. However, the GLC2000 reference dataset employed in this analysis does not have such characteristics.
As HPR level increases, only homogeneous samples were used for the accuracy assessment thus, this decreases sample size substantially (Figure 4). Such decreased sample size may have an impact on the robustness of the assessment. This can be especially of concern since sampling design of GLC2000 has 4 strata, 2 for heterogeneous landscape and 2 for homogeneous areas. With increasing HRP levels, there is likely a biased representation of the stratums (less sample for heterogeneous landscape). Nonetheless, the use of accuracy estimates based on only homogeneous samples for further applications is strongly discouraged since such estimates can be misleading.
For heterogeneous samples consisting of two or more land cover types, definition of agreement between the reference and map categories becomes complex (Mayaux et al., 2006; Defourny et al., 2010). Since GLC2000 sample units have large area (3x3 map pixels), we used three different definitions of agreement depending on how heterogeneous land cover types are treated. Validation case 1 (pessimistic) resulted in lowest accuracy estimates for all GLC products, whilst validation case 3 (optimistic) resulted in the highest accuracy estimates (difference is up to 10%) (Figure 5). This also shows that the landscape heterogeneity influences the definition of agreement between reference and map categories which impacts the final accuracy estimates.
5. CONCLUSION AND RECOMMENDATIONS This study re-analysed the GLC2000 reference dataset for comparative accuracy assessments of 5 GLC maps with 11 classes. With the comprehensive re-analysis of the GLC2000 reference dataset and inherent LCCS based classifier information, this dataset was successfully used for conducting multiple accuracy assessments. Moreover, as a result of the re-analysis, a reliable reference dataset of GLC was obtained and this consolidated dataset is now available to the public through GOFC-GOLD Reference Data Portal (GOFC-GOLD, 2014).
For comparison, different legends of the GLC maps were harmonized into 11 general classes. Although, legend harmonization reduced the thematic heterogeneity as much as possible, these are still inconsistencies which are a general limitation in comparing separately developed GLC maps. Such inconsistencies could be dealt through joint efforts of institutions and international advocates of GLC mapping efforts, i.e, the GOFC-GOLD and CEOS-WGCV (Committee on Earth Observation Satellites - Working Group on Calibration & Validation).
The comparative accuracy assessment showed that the SYNMAP had the highest accuracy followed by the GLC2000 map based on the GLC2000 reference dataset. To help the GLC map users in selecting the best suitable maps for their applications, comparative accuracy assessments should be conducted per user perspective. This is because the GLC map users have different preferences on the land cover types; one class can be very important to one user while not for another user.
This study also demonstrated the importance of appropriate way of handling landscape heterogeneity in accuracy assessments. How to handle heterogeneous sample sites with two or more land cover classes and the definition of agreement between reference and map categories in heterogeneous areas are proven to have high impact on the accuracy estimates, and this is one of the main source of uncertainty in the accuracy assessment. Future reference dataset should have MMU that is small enough to reflect all land cover types within sample unit area which can be useful in assessing map accuracies in heterogeneous areas.
ACKNOWLEDGEMENTS
This study was supported by the ESA funded GOFC-GOLD Land Cover Office. We are grateful to the experts involved in generating the GLC2000 reference data collection for their input in developing the dataset.
REFERENCES
Achard, F., Defourny, P., Bontemps, S., Herold, M., & Mayaux, P. (2011). Product validation plan: Land Cover CCI. Louvain-la-Neuve, Belgium: Université catholique de Louvain (UCL)-Geomatics.
Bartholomé, E., & Belward, A. (2005). GLC2000: a new approach to global land cover mapping from Earth observation data. International Journal of Remote Sensing, 26(9), 1959-1977.
Card, D. H. (1982). Using known map category marginal frequencies to improve estimates of thematic map accuracy.
Photogrammetric Engineering and Remote Sensing, 48(3), 431-439.
Defourny, P., Bontemps, S., Obsomer, V., Van Bogaert, E., & Arino, O. (2010). Accuracy assessment of Global Land Cover Maps-lessons learnt from Globcover and Globcorine experiences.
Defourny, P., Mayaux, P., Herold, M., & Bontemps, S. (2012). Global Land-Cover Map Validation Experiences Remote Sensing of Land Use and Land Cover (pp. 207-224): CRC Press
Di Gregorio, A. (2005). Land cover classification system: classification concepts and user manual: LCCS: Food and Agriculture Organization of the United Nations.
Fritz, S., & See, L. (2008). Identifying and quantifying uncertainty and spatial disagreement in the comparison of Global Land Cover for different applications. Global Change Biology, 14(5), 1057-1075.
Fritz, S., See, L., McCallum, I., Schill, C., Obersteiner, M., van der Velde, M., et al. (2011). Highlighting continued uncertainty in global land cover maps for the user community.
Environmental Research Letters, 6, 044005.
Giri, C., Zhu, Z., & Reed, B. (2005). A comparative analysis of the Global Land Cover 2000 and MODIS land cover data sets.
Remote Sensing of Environment, 94(1), 123-132.
GOFC-GOLD. (2014). GOFC-GOLD Reference Data Portal. Retrieved 22 Oct, 2014, from http://www.gofcgold.wur.nl/sites/gofcgold_refdataportal.php
Gong, P., Wang, J., Yu, L., Zhao, Y., Zhao, Y., Liang, L., et al.
(2013). Finer resolution observation and monitoring of global land cover: first mapping results with Landsat TM and ETM+ data. International Journal of Remote Sensing, 34(7), 2607-2654.
Hansen, M., DeFries, R., Townshend, J., & Sohlberg, R. (2000). Global land cover classification at 1 km spatial resolution using a classification tree approach. International Journal of Remote Sensing, 21(6/7), 1331-1364.
Hansen, M. C., & Reed, B. (2000). A comparison of the IGBP DISCover and University of Maryland 1km global land cover products. International Journal of Remote Sensing, 21(6-7), 1365-1373.
Heiskanen, J. (2008). Evaluation of global land cover data sets over the tundra–taiga transition zone in northernmost Finland.
International Journal of Remote Sensing, 29(13), 3727-3751.
Herold, M., Mayaux, P., Woodcock, C. E., Baccini, A., & Schmullius, C. (2008). Some challenges in global land cover mapping: An assessment of agreement and accuracy in existing 1 km datasets. Remote Sensing of Environment, 112(5), 2538-2556.
Herold, M., Woodcock, C. E., di Gregorio, A., Mayaux, P., Belward, A. S., Latham, J., et al. (2006). A joint initiative for harmonization and validation of land cover datasets. Geoscience and Remote Sensing, IEEE Transactions on, 44(7), 1719-1727.
Hibbard, K., Janetos, A., van Vuuren, D. P., Pongratz, J., Rose, S. K., Betts, R., et al. (2010). Research priorities in land use and land‐cover change for the Earth system and integrated assessment modelling. International Journal of Climatology.
Jung, M., Henkel, K., Herold, M., & Churkina, G. (2006). Exploiting synergies of global land cover products for carbon cycle modeling. Remote Sensing of Environment, 101(4), 534-553.
Loveland, T., Reed, B., Brown, J., Ohlen, D., Zhu, Z., Yang, L., et al. (2000). Development of a global land cover characteristics database and IGBP DISCover from 1 km AVHRR data.
International Journal of Remote Sensing, 21(6/7), 1303-1330.
Mayaux, P., Eva, H., Gallego, J., Strahler, A. H., Herold, M., Agrawal, S., et al. (2006). Validation of the global land cover 2000 map. Geoscience and Remote Sensing, IEEE Transactions on, 44(7), 1728-1739.
McCallum, I., Obersteiner, M., Nilsson, S., & Shvidenko, A. (2006). A spatial comparison of four satellite derived 1km global land cover datasets. International Journal of Applied Earth Observation and Geoinformation, 8(4), 246-255.
Mora, B., Tsendbazar, N.-E., Herold, M., & Arino, O. (2014). Global Land Cover Mapping: Current Status and Future Trends
Land Use and Land Cover Mapping in Europe (pp. 11-30): Springer Netherlands
Nakaegawa, T. (2011). Uncertainty in land cover datasets for global land-surface models derived from 1-km global land cover datasets. [Article]. Hydrological Processes, 25(17), 2703-2714.
Olofsson, P., Foody, G. M., Stehman, S. V., & Woodcock, C. E. (2013). Making better use of accuracy data in land change studies: Estimating accuracy and area and quantifying uncertainty using stratified estimation. Remote Sensing of Environment, 129, 122-131.
Olofsson, P., Stehman, S. V., Woodcock, C. E., Sulla-Menashe, D., Sibley, A. M., Newell, J. D., et al. (2012). A global land-cover validation data set, part I: fundamental design principles.
International Journal of Remote Sensing, 33(18), 5768-5788.
See, L. M., & Fritz, S. (2006). A method to compare and improve land cover datasets: Application to the GLC-2000 and MODIS land cover products. Geoscience and Remote Sensing, IEEE Transactions on, 44(7), 1740-1746.
Stehman, S. V. (2009). Sampling designs for accuracy assessment of land cover. [Article]. International Journal of Remote Sensing, 30(20), 5243-5272.
Stehman, S. V., & Wickham, J. D. (2011). Pixels, blocks of pixels, and polygons: Choosing a spatial unit for thematic accuracy assessment. Remote Sensing of Environment(0).
Strahler, A., Muchoney, D., Borak, J., Friedl, M., Gopal, S., Lambin, E., et al. (Eds.). (1999).
Tsendbazar, N., de Bruin, S., & Herold, M. (2014). Assessing global land cover reference datasets for different user communities. ISPRS Journal of Photogrammetry and Remote Sensing, (in press).
Verburg, P. H., Neumann, K., & Nol, L. (2011). Challenges in using land use and land cover data for global change studies.
Global Change Biology, 17(2), 974-989.