ESTIMATION OF ATMOSPHERIC EFFECTS OF RADARSAT-2 D-InSAR PRODUCT
USING GROUNDBASEDAND SPACEBORNE METEROLOGICAL DATA
S. Thapa a, *, R. S. Chatterjee a
a Indian Institute of Remote Sensing, Dehradun 248 001, India- (shailaja, rschatterjee) @iirs. gov. in
Commission VI, WG VII/2
KEY WORDS: Differential Interferometric synthetic (D-InSAR), Ionospehric and Tropospehric Path Delay, Total Electron Content (TEC), Atmospheric Artifacts, path delay
ABSTRACT:
Differential Interferometric synthetic aperture RADAR (D-InSAR) has emerged as one of the influential tools for the measurement of Earth’s topography deformation. The temporal variability of atmosphere plays a contaminative role in degrading the accuracy of Interferometric measurements as it causes the path delay in the propagating RADAR signal. The Ionosphere and Troposphere are the two atmospheric layers which are responsible for the path delay error in the Interferometric measurement. In this study ground based meteorological data integrated with spaceborne meteorological data was used to mitigate the path delay induced by the atmosphere on the Radarsat-2 data. In this study Jharia Coal Fields, Jharkhand, was selected where active mining has taken place since 1894. The D-InSAR was generated from Radarsat-2 data. In Troposephric path delay calculation ground based data like water vapor, temperature and humidity acquired during the time of the pass as well as spaceborne meteorological data were used as input. The TEC from IRI-2007 model was used as input to calculate the ionospheric path delay. These Ionospheric as well as Tropospehric delay was subtracted from a Differential Interferrogram to obtain atmospheric artifacts free differential interferrogram. The corrected Diffrential Interferrogram was used to delineate subsidence areas. We observed that D-InSAR and levelling results shows good agreement with each other. The Diffrential Interferomteric pairs with low coherence causes phase unwrapping problem. Therefore, only those pairs with good coherence were considered for the study. The used technique provides an opportunity to understand the contribution of Ionospehric and Tropospehric path delay effects on the D-InSAR results.
1. INTRODUCTION
The InSAR has emerged as most powerful and reliable tool for mapping ground surface motion and topography due to its fine resolution, day and night operational capability, weather independent and high measurement accuracy. However, variations in atmospheric refractivity in the limiting factor which introduce significant error in repeat pass SAR interferometry. The major source of atmospheric variability comprises three factors: electron density (TEC) in the ionosphere, air pressure in the neutral atmosphere and water vapor content in the troposphere among these water vapor content is more variable in both time and space.
There is numerous existing techniques which is used to mitigate the atmospheric phase delay effects. They fall into following categories.
a) Correction of atmospheric delay effects using external data like ground based meteorological reading, GPS, high resolution meteorological models, MODIS, MERIS (Ding et al., 2008).
b) Using correlation analysis (Sarti et al., 1999) c) Using pair wise logic (Massonnet et al., 1995) d) PS InSAR Technique (Ferretti et al., 2000) e) Stacking ( Zebker et al., 1997)
These methods rely on the assumption that the ground signal remains spatially stationary at the pixel level, while the atmospheric signal varies spatially. In the present work we have used an integrated atmospheric correction approach which
* Corresponding author. (email: [email protected])
includes ground based meteorological data and MODIS based water vapor product to model the tropospheric phase delay and for measurement of ionospheric phase delay IONEX data was used.
In many studies an integrated approach using ground based GPS and automated weather data model is used to correct the atmospheric phase delay, the potential limitation with these two methods is that it can only give point wise delay information which is interpolated spatially which consequently lead to difference in spatial resolution of GPS station in comparison to In-SAR data. Having such dense network of GPS and meteorological information is not always economically feasible. In our case dense network of GPS and meteorological information was not available. Since we have used Radarsat-2 SAR data for differential interferometry, which does not have any synchronization with the meteorological data provider platform to compensate, it we have recorded meteorological parameters continuously for the test site to get the actual picture of the atmospheric behavior using portable automatic weather station.
2. MODIS
The Moderate Resolution Imaging Spectroradiometer (MODIS) is equipped onboard the National Aeronautics and Space Administration (NASA) Earth Observing Terra and Aqua (launched in Dec 1999 & May 2002 platforms respectively) which provide daily coverage of the Earth. Both Terra andAqua are polar sun-synchronous orbit at a height of 705 km. It detects electromagnetic radiation in thirty six visible, NIR and IR bands. It measures water vapor content using both NIR and IR band range during the day and night.
The International Archives of the Photogrammetry, Remote Sensing and Spatial Information Sciences, Volume XL-3/W2, 2015 PIA15+HRIGI15 – Joint ISPRS conference 2015, 25–27 March 2015, Munich, Germany
This contribution has been peer-reviewed.
MODIS NIR, Water Vapor Data is available for daytime only at a spatial resolution of 1km x 1km. It is derived from absorption channels. The quality of this data is directly dependent on the estimation of surface reflection. This product is claimed to have accuracy within 5% to 10 % (Chang et al., 2014).
The MODIS IR product has low accuracy and it is derived from the 24-36 bands in which 26 bands are excluded during calculation. It is available for night time. MODIS products (mod07_l2) were used in the study.
3. GROUND BASED METEROLOGICAL DATA
Portable Automated Weather Station (AWS) is used to collect the ground meteorological observations in the study area. The AWS records the measurement of temperature, pressure, humidity, wind speed, wind direction, rain rate and solar rate. It comprises of following components anemometer, rain gauge and sensors for measuring temperature and pressure. It can record information in user definable rate. This instrument has been installed in the field to continuously record the readings of the meteorological parameters. The data is stored in a text document, which can be used for further analysis.
4. TOTAL ELECTRON CONTENT (TEC) DATA
Total Electron Content (TEC) data is used to calculate the ionospheric path delay. To calculate the ionospheric path delay in the present work IRI-2007 model was used. The TEC values from IRI-2007 model can be obtained for different height profile. In this work height of 800 km above the earth’s surface was used because Radarsat-2 orbit height is at approximately 798 km above the earth’s surface.
5. CALCULATION OF ATMOSPHERIC PATH DELAY
Radarsat-2 SLC data from 12-10-2012, 29-11-2012 and 23-12-2012 were used in the study. Interferograms were generated using three pass D-InSAR techniques. Steps involved in D-InSAR pair processing are given below.
a) Co-registration of two SLC images: For Interferogram generation, Two SLC images were registered very accurately in both amplitude and phase.
b) Interferogram Generation: Subsequent to image registration, the phase of two SLC images is subtracted from one another and Interferogram is generated.
c) Generation of unwrap phase involves three steps: Flattening, Filtering, Phase unwrapping.
5.1 Tropospheric Path delay
The troposphere represents the neutral (i.e. non-ionized layer) part of the atmosphere which is extended vertically from earth's surface to approximate height of 50 km (Spilker, 1996). In a neutral atmosphere, atmospheric delays are mainly induced by the refraction of gases (including dry air, water vapor), particulates and hydrometer which depends on their permittivity and concentration (Li., 2005). Tropospheric phase delay is dependent upon air pressure, temperature, and water vapor pressure and relative humidity values. Total tropospheric delay is divided into hydrostatic (ΔΨ hydro, SAR), wet (ΔΨ wet, SAR) and liquid components (ΔΨ liq, SAR) ( Jehle. et al., 2008).
ΔΨ , A = ΔΨy , A + ΔΨw , A + ΔΨ , A (1)
The hydrostatic component includes the significant contribution from water vapor (i.e. only the non dipole component of water vapor) and large contribution of dry air (Li., 2005). The wet and liquid components refer to the water vapor content and water content (i.e. Cloud, droplets) respectively. Liquid component posses very small contribution in the delay, therefore it is neglected in SAR applications. So eq (1) becomes.
ΔΨ , A = ΔΨy , A + ΔΨw , A (2)
The equation. (2) can be calculated using the following equation:
ΔΨy , A = x −6k g P R (3) (K2/,mbar), temperature lapse rate β = 6.5 (K/Km), temperature above sea level, T0 (K), water vapor pressure above sea level is e0 (mbar), mean temperature of water vapor Tm (K), target height h (Km), an average decrease of water vapor λ (unit less) The parameters like β, T0, e0, λ were calculated using latitude and height of the station.
The total tropospheric delay is calculated in the zenith direction which is to be converted into slant range geometry, in order to calculate the atmospheric effect of the troposphere. The slant range propagation is given by the equation.
ΔΨ , A /Cos (6)
Where α is satellite off nadir angle.
5.2 Ionospehric Path delay
The upper part of atmosphere stretched from 50 – 1000 km height is referred as ionosphere. Its constituents are free electrons and ions that influence the refractive index of this layer and consequently lead to the path delay of the signal. The TEC specifies the number of free electrons contained in column with an area cross section of 1m2. One TECU is equivalent to 1016 electrons per m2. The value of TEC is maximum at round 14:00 time and low at night time. The ionospheric delay is inversely proportional to the square of the frequency of the incoming signal. So shorter the wavelength lesser influenced by the ionospheric effect (Jehle et al., 2005) . The equation used to calculate ionospheric path delay is given as.
ΔΨ , A = . Kf CosTEC (7)
The International Archives of the Photogrammetry, Remote Sensing and Spatial Information Sciences, Volume XL-3/W2, 2015 PIA15+HRIGI15 – Joint ISPRS conference 2015, 25–27 March 2015, Munich, Germany
This contribution has been peer-reviewed.
Where refractive constant K = 40.28( m3 s-2), frequency of RADAR signal is given as 5.405 (GHz)
The TEC data is available as GIM’s (Global Ionospheric Maps) which are updated every hour as well as from the IRI-model. In this study, TEC data from IRI-2007 model is used because TEC from GPS data is generally overestimated because it also includes the plasma exosphere which extends above the ionosphere. RADARSAT-2 is approximately 800 km above the earth’s surface. So, the IRI model is suitable as it gives the TECvalue till ionosphere layer only, i.e. within 800 km above the surface (Kamarajugedda, 2013).
6. PHASE DELAY CORRECTION
The Differential interferograms were corrected using the atmospheric phase delay bands. The corrected phase of the differential Interferogram is represented as:
4
λ δ = ϕ − 4
λ ΔR − ΔR
(8)
4
λ δ ′= ϕ −
4
λ ΔR − ΔR
(9)
Where ΔR1, ΔR2 and ΔR3 are the atmospheric phase delay generated.
Where λπδ and λπδ ′is the corrected phase of two interferogram.
Theses corrected phase are then recombined with the component to produce atmospheric phase corrected interferogram. The corrected Interferogram were then analyzed to generate the subsidence map.
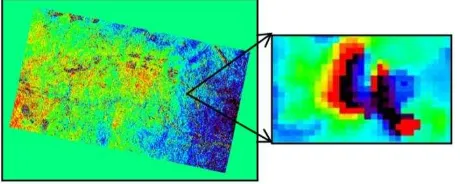
Figure 1 represents the topographic free Differential Interferogram where topographic phase and noise were removed precisely using high resolution Carto DEM and filtering technique. There was a priori knowledge of the study area that subsidence has taken place during the time period. So the phase has the three component deformation phase, atmospheric phase. Figure 2 represents the atmospheric phase corrected Interferogram. In atmospheric corrected Interferogram fringes are more clearly visible; it is due to the fact that for this pair has shortest temporal baseline.
Figure 1.Filtered Interferogram and Subsidence fringe before atmospheric phase delay correction
Figure 2. Filtered Interferogram and subsidence fringe after atmospheric phase delay correction.
7. RESULTS
Levelling data were used to calculate the real picture of subsidence at the Bastacolla test site for the same time duration as covered by a SAR Interferometric pair. It has been observed that the subsidence rate observed from DInSAR pair is within the range of the subsidence rates observed for in the test site. The subsidence observed from levelling has much higher value than D-InSAR results.
8. CONCLUSION
D-InSAR is the most reliable tool for measuring surface deformation. Atmospheric phase hinders the quality and the accuracy of the interferogram. To mitigate such problem integrated approach was applied in the present study. Tropospheric and ionospheric path delay map were generated for the time of acquisition of D-InSAR pairs. The value obtained for tropospheric phase delay ranges from 5.0 to 5.07 m where as ionospheric phase delay ranges from -0.137 to -0.189 respectively. The negative value of ionospheric phase delay indicates the phase advance. The total path delay was estimated by summing the tropospheric and ionospheric phase delay which was then subtracted from the D-InSAR phase to generate atmospheric phase free D-InSAR pair. The Radarsat-2 data pair is acquired at 5:47 AM (IST). There are no existing space borne satellite data which can provide meteorological data during that time. Therefore ground meteorological data were recorded and were integrated with MODIS derived temperature, pressure, and water vapor, which was later on calibrated at the time of acquisition of RADARSAT-2 from this tropospheric phase delay was calculated. From the result we have observed that subsidence range is in the acceptable range (with in the upper and lower limit of subsidence rates obtained from levelling data). Atmospheric correction had shown a drastic effect on the fringe cycles. It is concluded that atmospheric effects influence the measurement at certain extent. So it is very important to mitigate this delay to obtain precise and more reliable measurements. Also, this study was done using single automated weather station data. This procedure is good for estimating temporal dynamics of the meteorological data for the specific study area only. Increasing the number of weather stations for the meteorological parameters will help in correcting the atmospheric phase delay more accurately.
ACKNOWLEDGEMENTS
This work is supported by Dr. Y.V.N. Krishna Murthy, Director, Indian Institute of Remote Sensing, Dehradun, Dr. Amalendu Sinha, Director, Central Institute of Mining & Fuel Research, Dhanbad.The authors gratefully acknowledge Dr. V.K. Dadhwal, formerly Dean, Indian Institute of Remote Sensing, Dehradun & presently Director, National Remote Sensing Centre, Hyderabad, The International Archives of the Photogrammetry, Remote Sensing and Spatial Information Sciences, Volume XL-3/W2, 2015
PIA15+HRIGI15 – Joint ISPRS conference 2015, 25–27 March 2015, Munich, Germany
This contribution has been peer-reviewed.
Dr. P.S. Roy, formerly Director, Indian Institute of Remote Sensing, Dehradun. The authors sincerely thank and acknowledge the help and services provided by Mr. S.N. Rajak of Central Institute of Mining & Fuel Research, Dhanbad.The authors convey sincere thanks to the staff and officials of the mining agencies namely, Bharat Coking Coal Ltd, Tata Steel, and Steel Authority of India Ltd., Dhanbad for their help and cooperation during field survey and ground data collection. .
REFERENCES
Askne, J., H. Nordius, 1987. Estimation of tropospheric delay for microwaves from surface weather data, Radio Science, vol. 22, pp. 379–386.
Chang. L., Jin. Shuanggen, He. Xiufeng, 2014. Assessment of InSAR atmospheric correction using both MODIS near-infrared and infrared water vapor products, IEEE Transaction of Geoscience and Remote Sensing, 52(9), pp. 5726-5735.
Ding, Xiao-li., Li, Zhi-wei, Zhu, Jian-jun, Feng, Guang-cai, Long, Jiang-ping, 2008. Atmopspheric effects on InSAR measurements and their mitigation., Sensors, 8(9), pp. 5426-5448; DOI:10.3390/s8095426.
Ferretti, A., Prati, C. Rocca, F, 2000. Nonlinear subsidence rate estimation using permanent scatters in differential SAR interferometry, IEEE Transactions on Geoscience and Remote Sensing, 38(5), pp. 2202-2212.
Jhele, Michael., Ruegg, Maurice, Small, David, Meier, Enrich and Nuesch, Daniel, 2005. Estimation of ionospheric TEC and Faraday roatation for L-band SAR. Proceedings. of SPIE Vol.5979, pp. 252-260. DOI:10.1117/12.627618.
Jehle, Michael., Perier, Donat, Small, David, Schubert, Adrian, Meier, Erich. 2008., Estimation of atmospheric path delays in TerraSAR-X data using models vs. measurements. Sensors., 8 (12), pp. 8479-8491; DOI: 10.3390/s8128479.
Kamarajugedda. Shankar, “Atmospheric correction of D-InSAR phase for land subsidence measurements using an intergrated approach,” M. Sc, University of Twente. 2013.
Li. Zhenhong, 2005 “Correction of atmospheric water vapor effects on repeat-pass SAR interferometry using GPS, MODIS and MERIS data,” Ph. D. Dissertation, Univ. of London.
Massonnet, D., Feigl, K. L, 1995. Discrimination of geophysical phenomena in satellite radar interferograms. Geophysical Research Letters, 22(12), pp. 1537-1540.
Spilker. J. J., 1994. Tropospheric effects on GPS. In: Spilker JJ, Parkinson BW (eds) Global positioning system: theory and applications, vol 1. American Institute of Aeronautics and Astronautics, pp. 517–546.
Sarti, F., Vadon, H., Massonnet, D, (1999). A method for the automatic characterization of InSAR atmospheric artifacts by correlation of multiple interferograms over the same site. Geoscience and Remote Sensing Symposium, 1999. IGARSS '99 Proceedings. IEEE 1999 International, Volume: 4, 28 June-2 July 1999, pp.1937–1939.
Zebker, H.A., P.A. Rosen, and S. Hensley, 1997. Atmosphericeffects in interferometric synthetic aperture radar surface deformation and topographic maps, Journal of Geophysical Research, 102(B4), pp. 7547-7563.
The International Archives of the Photogrammetry, Remote Sensing and Spatial Information Sciences, Volume XL-3/W2, 2015 PIA15+HRIGI15 – Joint ISPRS conference 2015, 25–27 March 2015, Munich, Germany
This contribution has been peer-reviewed.