JOINT ALIGNMENT OF UNDERWATER AND ABOVE-THE-WATER
PHOTOGRAMMETRIC 3D MODELS BY INDEPENDENT MODELS ADJUSTMENT
F. Mennaa, E. Nocerinoa,b, S. Troisib, F. Remondinoa
a 3D Optical Metrology (3DOM) unit, Bruno Kessler Foundation (FBK), Trento, Italy - (fmenna, nocerino, remondino)@fbk.eu, Web: http://3dom.fbk.eu
b Parthenope University of Naples, Dept. of Sciences and Technologies, 80143 Naples, Italy – [email protected]
Commission V
KEY WORDS: Underwater, Photogrammetry, Least Square Adjustment, Accuracy, Independent Models, Alignment ABSTRACT:
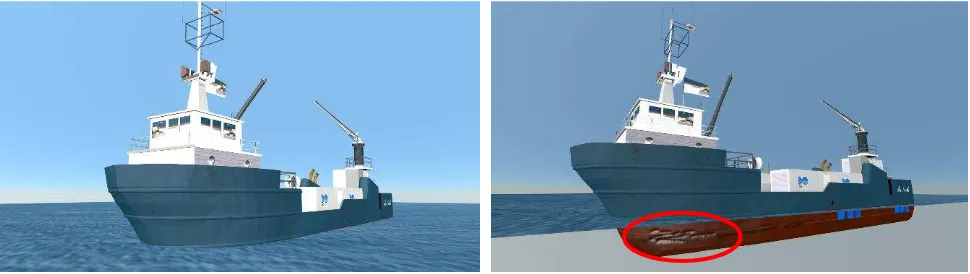
The surveying and 3D modelling of objects that extend both below and above the water level, such as ships, harbour structures, offshore platforms, are still an open issue. Commonly, a combined and simultaneous survey is the adopted solution, with acoustic/optical sensors respectively in underwater and in air (most common) or optical/optical sensors both below and above the water level. In both cases, the system must be calibrated and a ship is to be used and properly equipped with also a navigation system for the alignment of sequential 3D point clouds. Such a system is usually highly expensive and has been proved to work with still structures. On the other hand for free floating objects it does not provide a very practical solution. In this contribution, a flexible, low-cost alternative for surveying floating objects is presented. The method is essentially based on photogrammetry, employed for surveying and modelling both the emerged and submerged parts of the object. Special targets, named Orientation Devices, are specifically designed and adopted for the successive alignment of the two photogrammetric models (underwater and in air). A typical scenario where the proposed procedure can be particularly suitable and effective is the case of a ship after an accident whose damaged part is underwater and necessitate to be measured (Figure 1). The details of the mathematical procedure are provided in the paper, together with a critical explanation of the results obtained from the adoption of the method for the survey of a small pleasure boat in floating condition.
Figure 1. A ship whose hull (immersed part) has been damaged after a collision. The paper presents a low-cost but reliable and precise image-based methodology for the surveying of the emerged and submerged parts of the ship.
1. INTRODUCTION
3D measurements of floating objects and in general of all the structures that have parts both under and above the sea level is an important task in our time. Not only its importance is relevant for the marine engineering sector (ships, oil rigs, etc.) and renewable energy (floating wind power platforms, wave power buoys, tidal turbines), but also for civil engineering (bridges, channels), cultural heritage (semi-submerged buildings, ship wrecks) and marine biology (marine organisms leaving on reefs, rocks).
In general, today different surveying techniques are employed for underwater applications when the object to be surveyed is not deformable and above all, still. These techniques are mainly distinguishable in acoustic (single beam echo sounder - SBES, multibeam echo sounder – MBES, and side scan sonar) (Lawrence et al., 2004; Plets et al., 2011) and optical methods (laser scanning, photogrammetry, structured light systems) (Bianco et al, 2013; Drap, 2012; Roman et al., 2010). An
integration of two techniques is usually adopted when the survey requires merging information from above and below the waterline (Figure 2). By adopting this solution, the achievable accuracy strongly depends on the complementary technologies, i.e. positioning and ship motion inertial measuring systems (GNSS+IMU) and usually the resolution provided by the two methods is significantly different.
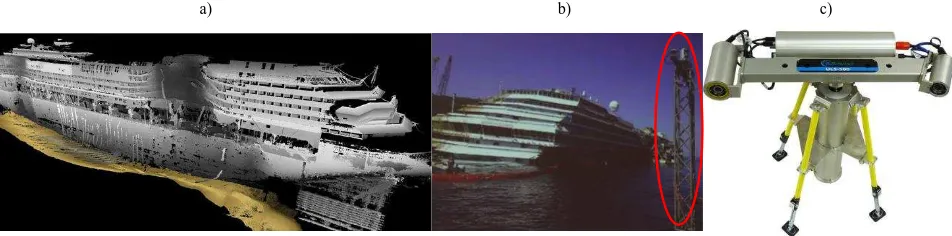
Recently, new underwater laser scanning (UWLS) systems, mainly based on triangulation technique, have started to appear on the market and have been also used in conjunction with terrestrial laser scanner (TLS) for simultaneously surveying a ship both below and above the water level (Figure 3). The system developed requires the use of a heavy and huge pole (Figure 3b) where the UWLS and TLS are attached on and that is fixed on a boat, which “circumnavigates” the object of interest. The obtained parts below and above the water are of comparable resolution, but the accuracy is strictly related to the navigation system used for determining the boat movements.
Figure 2. Combined laser and bathymetric survey of Sydney harbour
(http://www.teledyne-reson.com/news/video-a-combined-laser-and-bathymetric-survey-sydney-2014-2/).
a) b) c)
Figure 3. Combined laser survey, above and below the water, of Costa Concordia wreck (a) conducted by “ADUS DeepOcean” using a pole (b) (http://www.teledyne-reson.com/news/video-paper-high-quality-surveys-of-man-made-structures-by-adus/); the underwater triangulation based laser
scanner developed by 2G Robotics (http://www.2grobotics.com/products/underwater-laser-scanner-uls-500/) used for the survey (c).
The cost of the system is not reported but it is expected to be quite expensive.
In previous works (Menna et al., 2013), the authors presented a novel low-cost methodology for 3D surveying (and modelling) of floating and semi-submerged objects under the assumption that they are rigid bodies. In this contribution, the technique is augmented through the development of an improved adjustment procedure. The method is based on photogrammetric technique, employed for surveying both the submerged and emerged parts of objects and the two surveys are combined together by means of special rigid orientation devices. The proposed procedure works with the object in both floating and static conditions and supplies a very flexible solution suitable in different circumstances, such as when a prompt survey is required after an accident, as well as for long term monitoring of structures. The application presented in this contribution is part of a wider project started at “Parthenope” University in 2006 and called OptiMMA (optical metrology for maritime applications,
http://3dom.fbk.eu/en/node/89).
2. THE PROCEDURE FOR THE ALIGNMENT OF UNDER AND ABOVE-THE-WATER
PHOTOGRAMMETRIC SURVEYS
2.1 General description
The basic idea is to carry out, separately, two photogrammetric surveys in two different media, i.e. one in air above the sea level and one in water below the sea level, each of them performed with suitable equipment, i.e. a digital camera for the above-the-water survey and, usually, a digital camera in a proper above-the-water
proof housing and a flash light underwater. Two classical close-range photogrammetric workflows are, hence, followed:
- planning of the camera network to meet the project requirement,
- object targeting with scale bars and targets if necessary (in particular in water where the contrast and light condition can be limiting and unfavourable),
- camera calibration, - image acquisition,
- data processing (image orientation and triangulation, dense matching, mesh generation, etc.).
At the end of the process, two photogrammetric models are obtained, each in its own arbitrary datum or coordinate system, i.e. with an arbitrary orientation and position in space.
Usually the scale is defined separately above and below the water level, by fixing elements of calibrated known lengths on the two portions of the object that are imaged during the two separate photogrammetric acquisitions.
At the end of the two photogrammetric processes, the floating or semi-submerged object has been reconstructed, but the part above and the part below the water are separated. In order to join the two, up to this moment, independent parts, the two photogrammetric models are to be moved, i.e. oriented or transformed, in a common coordinate system.
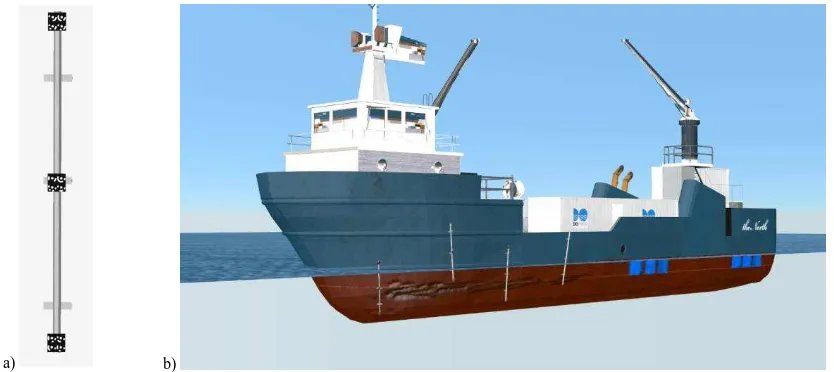
The reasoning behind the proposed method is that since it is not possible to see the submerged part from above the water and vice-versa, a kind of “hinge” is needed to link the two parts surveyed respectively above and below the water level. Orientation Devices (ODs), consisting in rigid rods with spatially distributed targets attached on (Figure 4a), are designed to be firmly placed with strong magnets or special glue or even welded to the surface of the floating object (Figure 4b).
a) b)
Figure 4. An example of Orientation Device (OD) with four targets attached to three plates (a). Four ODs fixed to the object and surrounding the area of interest (b).
The ODs are calibrated with high accuracy before being placed on the object.
The number and length of the ODs depend on the dimension of the object and extension of the area to be measured. Usually the ODs are made of some plates, whose number can vary according to the size of the object but at least two, are firmly attached on the ODs and display photogrammetric targets (three would be the theoretical the minimum number but four is suggested for the sake of redundancy).
Summarizing, the following procedure is performed:
1. the coded targets, usually four, on each plate of the ODs are previously measured in order to accurately know the relative position between the targets on the plates of each OD;
2. the ODs are fixed on the floating object with one plate above and one below-the-water level (for a two-plate OD);
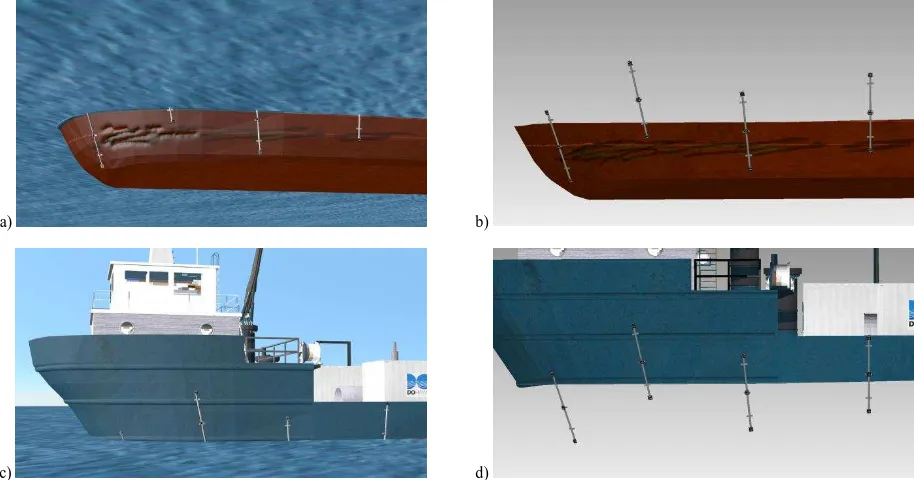
3. the coordinates of the targets on the submerged plates are measured during the underwater survey (Figure 5a); 4. the four measured targets are used for computing the
similarity transformation parameters to align (roto-translate) each OD in the underwater coordinate system; in this way, the coordinates of the targets on the emerged plates become also known in the underwater coordinate system (Figure 5b);
5. the same procedure is repeated for the above-the-water portion: the targets measured and known in the above-the-water coordinate system are used to “mount” all the ODs on the photogrammetric above-the-water model so that the submerged targets were known in the above-the-water coordinate system (Figure 5c and Figure 5d);
6. now, all the targets are known in both the photogrammetric models and can used for aligning the separate models in the same coordinate system (Figure 4b).
2.2 Mathematical formulation
From the theoretical/mathematic point of view, to converge to the final solution where the two originally independent photogrammetric models are merged in a unique coordinate system, a three-step procedure is followed:
1. in the first iteration, each single OD is roto-translated, one at time, through a rigid similarity transformation and the target coordinates are determined in each of the two photogrammetric models
2. the two models are oriented in the same coordinate system, choosing one of the them as reference
3. in the last step, a refinement of the alignment is performed by re-computing simultaneously the similarity transformations for the models and ODs and the coordinates of all the targets.
The procedure here formulated falls in the very common problem in geodesy and surveying where coordinates of points measured in one coordinate system are to be transformed in another coordinate system. The coordinate transformation is usually performed through a 7 parameters rigid transformation also called similarity transformation.
Moreover, the last underlined step can be regarded as the well-known aerial triangulation process where photogrammetric stereo models are firstly relatively oriented and then transformed in the absolute datum defined by Ground Control Points (GCPs). In particular, it recalls the semi-analytical or independent models aerial triangulation method (Kraus and Waldhäusl, 1993).
2.2.1 First two steps – Coarse alignment between the two photogrammetric models: The first step of the procedure outlined in section 2.2 requires that a similarity transformation is computed to roto-translate each individual OD in both the two photogrammetric models, above and under-the-water, separately.
Considering fixed one reference coordinate system of the photogrammetric models (let’s call it the reference or target coordinate system CSa) and taken one OD at time (defined as the local coordinate system CSb), a 3D similarity transformation is to be computed to transform the OD in the fixed photogrammetric coordinate system. The 3D rigid similarity transformation requires the computation of the so-called seven parameters transformation, namely, three shiftings (i.e. the coordinates of the origin of CSb with respect to CSa), three rotation angles and one scale parameter (if an isotropic scale factor exists so that the transformation can be also defined conformal or isogonal).
a) b)
c) d)
Figure 5. – Target-based procedure for the alignment of the two separate surveys above and below the waterline.
Equation 1 provides the transformation between CSa and CSb, that is the transformation which allows to obtain the coordinates of points originally known in system CSb in the target system CSa:
[ ] = [ ] + � ⋅ [ ] (1)
where
- [ ] = , , are the coordinates of a generic
point P in the target system CSa (here the superscript indicates the system where the coordinates are defined);
- [ ] are the coordinates of the origin 0b of system CSb
known into system CSa;
- � = [ ] is the diagonal matrix containing the
scale factors in the three directions; usually = =
= , i.e. an isotropic scale factor exists between the two systems so that S reduces to
� = [ ] (2)
- is the 3x3 rotation matrix from system CSb to system CSa:
= [c s + s s � c c c − s s � sc � c − c � s − s c �s �
s s − c s � c s c + c s � s c c � ]
(3)
where c=cos(∙) and s= sin(∙) and ω,φ,κ (also known as roll, pitch and yaw) are the three rotation angles between the two coordinate systems.
It’s noteworthy that the rotation matrix contains the sequential rotations that, applied to the axes of target system CSa, transform the system CSa to be parallel with system CSb:
= { } ∙ {� } ∙ { } (4)
- [ ] = , , are the coordinates of point P in
system CSb that constitutes the observations of the systems.
To compute the seven parameters transformation between the two coordinate systems from equation 1, some points are to be known in both coordinate systems and, usually, more than the minimum is used to increase the reliability of the transformation. For this reason, the ODs are designed to have at least one plate with four targets visible above and one plate with four targets visible below the sea level.
As well known, when the number of observations is greater than the number of unknown parameters (seven), the problem reduces to an estimation process, where the “best” solution for the unknowns is to be inferred from observations – as in our case. The most commonly used method in modern surveying for the estimation of parameters is the least squares (LS) approach, where the mathematical model is composed of a (i) a functional model, that relates the estimation of transformation parameters
to the observations (i.e. equation 1), and (ii) a stochastic model, that is a statistical description that defines the random fluctuations in the measurements and, consequently, the parameters. The stochastic model allows to characterise each measurement (point coordinates) with a proper quality level, which is expressed statistically in terms of weight w, defined as the ratio between the variance factor or reference variance � and its own variance ��:
�= � �⁄ � (5)
In matrix notation, the weight matrix W of the observations and the cofactor matrix �
of the observations are derived:
= � ��− (6)
� = − = �− �� (7)
where �� is the covariance matrix
��= � [��1 ��1 ��1 … ���] (8)
containing the standard deviations of the observations. The covariance matrix is diagonal under the hypothesis of independent observations (i.e., the correlations coefficients are zero).
Stating the stochastic nature of the observations, neither their true values or the true values of the unknowns (transformation parameters) are cognisable and, consequently, the process of LS will provide the best estimates of both observations (also called adjusted observations) and unknowns:
�̂ = � + � = �̂ (9)
where
- �̂ is the vector of adjusted observations - � is the vector of measured observations - � is the vector of corrections or residuals
- �is the Jacobian or design, model or coefficient matrix - ̂ is the vector of best estimates of the unknowns.
In the case of interest, i.e. the 3D rigid similarity transformation between the two coordinate systems, the functional model expressed by equation 9 consists of non-linear relations, because of the non-linearities in the rotation matrix (equation 3). The original non-linear system (equation 1) is linearized using Taylor’s series and LS is then applied to the linearized form:
� = � � + � (̂ − � = � + � (10)
� is a vector containing the approximate values for the unknowns and the difference:
(̂ − � = �̂ =
[ �
]
(11)
can be seen as a vector of corrections to the initial approximations.
The Jacobian or design matrix � contains the first-order partial derivatives of the system:
� = (12)
The LS solution for the non-linear system can be re-written as followed:
� + � = ��̂ (13)
Where:
- � is the difference between measured and approximate observations, i.e. the vector of reduced observations:
� = � − ��= [
�− �
�− �
�− �
] (14)
being �� the vector of approximate observations obtained from the functional model computed with the approximate parameters �:
� � = �� (15)
The functional and stochastic model of LS can be combined together:
��̂ = � (16)
The correction for the solution vector and the corresponding LS residuals are then derived:
�̂ = − � � (17)
�̂ = ��̂ − � = � − � − � � (18)
where the matrix of normal equations:
= � � (19)
As for the observations, also for the unknowns and residuals the cofactor and covariance matrices can be defined:
Qx̂= N− = ATWA− (20)
Cx̂= σ̂ Qx̂= σ̂ ATWA − (21)
Qv̂= W− − AN− AT (22)
Cv̂= σ̂ Qx̂= σ̂ W− − AN− AT (23)
where �̂ is the reference variance (also called unit variance, variance factor or variance of a measurement of unit weight):
�̂ =�̂� �̂ (24)
The LS adjustment process described above is performed for computing the transformation parameters that transform the OD in the photogrammetric coordinate system. This procedure is repeated for all the ODs with the first photogrammetric model (e.g., the submerged part of the object) and, similarly, with the second photogrammetric model (e.g., the emerged part of the object). So, if for example 4 ODs are employed, 4×2 adjustment processes are to be computed.
At the end of this analytical procedure, corresponding to step 1 in section 2.2, the coordinates of the targets on the ODs are known in both the two distinct photogrammetric models (above and below the water level). It is worth to note that, after this set of transformations, in the photogrammetric model of the emerged part also the targets in water are known and, analogously, in the submerged model the targets in air are estimated. That means that now the two separate photogrammetric models have enough common points through which a further transformation can be computed, choosing one model as reference coordinate system (step 2 in section 2.2).
2.2.2 Third step – refinement of the alignment through independent models adjustment: An independent models approach is finally applied to refine the alignment of the two photogrammetric models described in section 2.2.1 (step 3 in section 2.2).
Together with standard bundle block adjustment, block adjustment by independent models was the common technique employed for the absolute orientation of blocks of photographs (Kraus and Waldhäusl, 1993) when the computational power of computer was not as high as today. The technique was also known as semi-analytical aerial triangulation, since originally the process was performed in two subsequent steps: (i) the analogue part of the procedure, where the relative orientation for each individual or independent stereomodel was performed with a precision or “1st order” plotter (Faig, 1986); (ii) the analytical part, where a simultaneous block adjustment of all the independent stereomodels was implemented on the computer. Hence, the aim of aerial triangulation with independent models was to link several separate photogrammetric models (each measured independently in a local or relative coordinate system) and absolutely orient all together in the global coordinate system defined by ground control points (GCPs). The connection of the individual models was performed through tie points and projection centres common to adjacent models, and the transformation of the entire block in the higher-order coordinate system was achieved thanks to GCPs visible in the images.
The preliminary, coarse alignment achieved in the previous phase (section 2.2.1) serves as initial approximation for the chained of spatial similarity transformation that will adjust simultaneously both the two photogrammetric models (above and under-the-water) and the coordinates systems associated to the ODs.
The functional model for the independent models adjustment is the inverse transformation of equation 1:
[ ] = �− ⋅ [ −−
− ]
= �− ⋅ [ −−
− ]
(25)
Equation 25 is written for each observation (target coordinates on the ODs) measured in each local coordinate parameters from the local model/coordinate system to the reference system and (ii) the coordinates of targets expressed in the reference system.
To explain the procedure implemented for the considered case, let’s consider the case of two individual photogrammetric models (the emerged and submerged models with their own coordinate systems � and � , respectively) and two ODs (with their coordinate systems � and � ) used as hinge. Usually, there is not an objective evidence that one of the photogrammetric model is of higher accuracy than the other and hence regarded as reference coordinate system or datum. Consequently, a free-network or inner constraint solution is implemented, eliminating the need of fixing the reference system and making each observation to contribute to the final result in the most adequate way, i.e. weighted according to its own original uncertainty. It corresponds to find an arbitrary Cartesian coordinate system, out of the derived photogrammetric models of the above and underwater parts and ODs, which provides the inner accuracy or favourable figures of accuracy (Kraus and Waldhäusl, 1993) for the point coordinates. For deepening the topic of free-network solution in non-topographic close-range photogrammetry, see, for, example Dermanis (1984), Fraser (1984).
In free-network solution, the normal-equation matrix (equation 19) has a rank deficiency of seven, exactly equal to the number of datum elements that must be defined. To eliminate the rank deficiency of the normal-equation matrix seven additional equations are added, according to the observation equations with respect to the transformation parameters from the local coordinate systems � , � ,
� and � to the final free-network datum � . Each sub-block features a number of rows equal to the number of targets visible in the corresponding model and seven columns, i.e. the number of unknown transformation parameters.
- [ � � �� � ]� are sub-blocks of the design matrix � containing the partial derivatives of the observation equations with respect to the coordinates of points in the final coordinate system � . Evidently, the sub-block related to one model will display zero elements in correspondence of those points that are not visible in it and the number of row will be equal to the number of measured targets.
- The last rows of the design matrix feature the sub-block �� of the design matrix containing the coefficients of additional constraint equations for the elimination of the datum deficiency:
[ ⋱
− −
− −
− −
]
∙
[ ]
=
[ ]
(27)
The first three equations mean that the sum of the corrections to the approximate coordinates is zero, i.e. the centroid of the approximate coordinates is the same as the centroid of the adjusted coordinates. The further equations, three for the rotations and one for the scale factor, originate from the general relation for a spatial similarity transformation (equation 1). The inner constraint solution can be interpreted according to a geometric explanation: when advancing from one iteration to the next, there will be no shift, rotation or scale change between the approximate and the refined coordinate positions (Mikhail et al., 2001).
The dimensions of the LS system (equation 26) will result:
(i) the total number of rows of the design matrix will be equal to the sum of all the observations, i.e. targets visible in all the photogrammetric models plus the seven constraint equations for the free network solution. It corresponds to the length of the reduced observation vector plus the zero elements of constraint equations:
# �= # [�,�]=
3 × � +
3 × � +
3 × � +
3 × �
) + 7 (28)
(ii)the number of columns of the design matrix is equal to elements of the correction vector of the unknowns, i.e. the seven transformation parameters of all the systems and the target coordinates in the free network datum ground system
� :
# �= # ̂ =
7 × # + 3 × # (29)
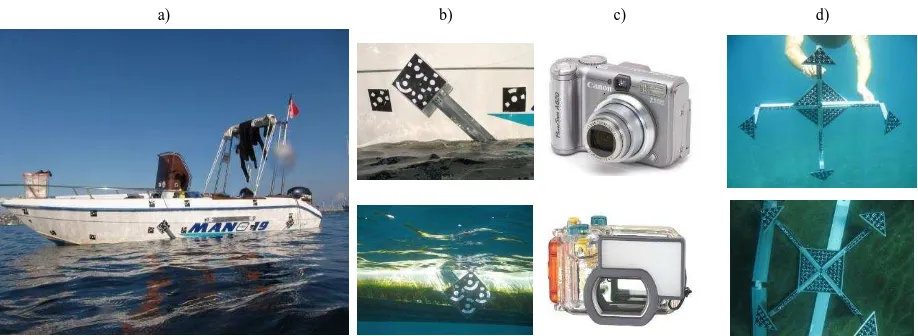
3. CASE STUDY: 6 M FLOATING BOAT The refined procedure for the alignment of the underwater and in-air photogrammetric models based on independent models adjustment is applied for the surveying and 3D modelling of a 6 meter fiberglass boat in floating condition (Figure 6a). The detailed survey and photogrammetric processing was described in (Menna et al., 2013). Here the improvement in the final merging of the submerged and emerged parts is specifically addressed.
3.1 Boat survey and processing
The boat was anchored off the coast of Procida Island in the gulf of Naples (Italy) in 6 meter deep water.
A 7 Mpx CANON A620 (pixel size 2.3μm) consumer-grade digital camera mounted in its own waterproof camera housing with a flat lens port (Figure 6c) was used for surveying the boat both below and above the sea level. A portable volumetric rigid frame made of aluminium with photogrammetric targets attached on was specifically built and used for underwater calibrations (Figure 6d).
a) b) c) d)
Figure 6. – The 6 m pleasure boat surveyed with the proposed technique with the attached photogrammetric targets and ODs (a). One of the ODs seen above and below the sea level (b). The consumer grade digital camera with its underwater camera housing employed for the survey (c). The portable
volumetric rigid frame made with photogrammetric targets used for the underwater camera calibration (d).
XY Plane
XZ Plane
YZ Plane
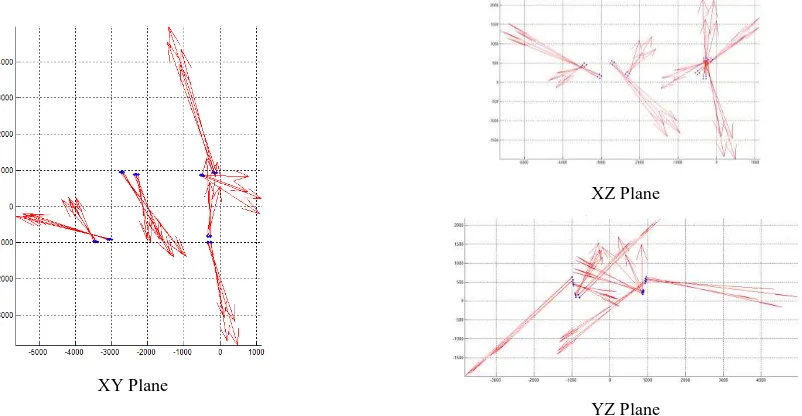
Figure 7. Spatial residuals in mm (scale: 1000) from coarse rigid transformation between the local above-the-water model and the reference
underwater.
XY Plane
XZ Plane
YZ Plane
Figure 8. Spatial residuals in mm (scale: 1000) from the alignment through independent models adjustment.
a) b) c)
Figure 9. a) Coordinate reference system established on the boat. b) Feature lines and points measured after the union of the two photogrammetric surveys. c) 3D model of the boat used in a software package for naval engineering calculation.
About 50 photogrammetric circular coded targets were fixed both above and below the waterline (Figure 6a), together with two aluminium scale bars (one in water and one in air). Four ODs were placed aft and fore, symmetrically on the two sides of the boat, with one plate below and one above the waterline each of them with four photogrammetric coded targets (Figure 6b). According to the procedure described in section 2.1, two separate photogrammetric surveys and processing were carried out for the two parts of the boat, below and above the water
level, with an average ground sample distance (GSD) of 0.7 mm. The achieved precision for object coordinates, extracted from covariance matrix resulting from bundle adjustment, was about 0.9 mm and 0.5 mm for the underwater and above-the-water surveys, respectively.
3.2 Result of the alignment
The alignment of the two independent photogrammetric models was performed following the three step procedure described in section 2.2.
The coarse alignment required the transformation of the four ODs both in the above and under-the-water coordinate systems separately, so that a first approximate rigid transformation was possible for joining the two separate photogrammetric parts. It is worth to note that a reference system was established on the boat, with the X-axis along the longitudinal axis of the boat, Y-axis in the starboard-port direction and Z-Y-axis pointing upwards (Figure 9a).
The results of the coarse alignment are summarised in Figure 7 and Table 1.
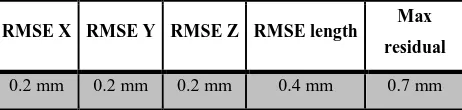
The independent models adjustment was applied starting from the approximate alignment derived in the previous step. Figure 8 reports the residual vectors on the targets and Table 2 the statistics after the alignment. With respect to the simple rigid transformation of Figure 7 and Table 1, an improvement of 7 times on the RMSE is achieved.
RMSE X RMSE Y RMSE Z RMSE length Max residual
1.3 mm 2.0 mm 1.4 mm 2.8 mm 4.3 mm
Table 1. Statistics resulting from the rigid transformation/coarse alignment.
RMSE X RMSE Y RMSE Z RMSE length Max residual
0.2 mm 0.2 mm 0.2 mm 0.4 mm 0.7 mm
Table 2. Statistics resulting from the alignment through independent models adjustment. Note the improvements with respect to the results
shown in Table 1.
After the merging of the two separate photogrammetric projects, edges and lines were manually measured (Figure 9b) for the complete geometric 3D reconstruction of the boat (Figure 9c). The final 3D model was used for hydrostatic calculations in specific naval engineering software package.
4. CONCLUSIONS
This contribution has presented an innovative procedure for the alignment of two photogrammetric models, deriving from two separate and independent photogrammetric surveys above and below the water level. The power of the technique is its applicability to objects of different dimensions and in floating condition. The proposed method is low-cost and flexible and requires simple equipment in addition to a digital camera with waterproof housing. It relies indeed on the use of specifically designed targets, named Orientation Devices that, attached on the object and visible both above and below the sea surface, working as “hinge” between the two photogrammetric models. The improvement presented in this paper derives from the implementation of the well-known independent models adjustment to refine the rigid transformation between the above and below-the-water photogrammetric models.
The detailed mathematical formulation of the developed procedure has been described and a case study has been reported. Here, the methodology was applied to a small boat in floating condition and the improvement resulted in a reduction of the RMSE of the transformation of about 7 times. The
procedure was also successfully tested in the case of a much bigger semi-submerged object, the leak of Costa Concordia and the results will be presented in a future work.
REFERENCES
Bianco, G., Gallo, A., Bruno, F., Muzzupappa, M., 2013. A comparative analysis between active and passive techniques for underwater 3D reconstruction of close-range objects. Sensors, 13(8), 11007-11031.
Dermanis, A., 1994. The photogrammetric inner constraints. ISPRS Journal of Photogrammetry and Remote Sensing, 49(1), 25-39.
Drap, P., 2012. Underwater Photogrammetry for Archaeology. Special Applications of Photogrammetry, Dr. Daniel Carneiro Da Silva (Ed.), <http://www.intechopen.com/books/special- applications-of-photogrammetry/underwater-photogrammetry-for-archaeology>.
Faig, W., 1986. Aerial Triangulation and Digital Mapping: Lecture Notes for Workshops Given in 1984-85. School of Surveying, University of New South Wales.
Fraser, C. S., 1984. Network design considerations for non-topographic photogrammetry. Photogrammetric Engineering and Remote Sensing, 50(8), 1115-1126.
Kraus, K., Waldhäusl, P., 1993. Photogrammetry. Fundamentals and Standard Processes.–Vol. 1. Bonn: Dümmmler Verlag.
Lawrence, M., Oxley, I., Bates, C. R., 2004. Geophysical techniques for maritime archaeological surveys. Symposium on the Application of Geophysics to Engineering and Environmental Problems 17(1).
Menna, F., Nocerino, E., Troisi, S., Remondino, F., 2013. A photogrammetric approach to survey floating and semi-submerged objects. Proc. of Videometrics, Range Imaging and Applications XII, SPIE Optical Metrology, Vol. 8791, doi: 10.1117/12.2020464.
Mikhail, E. M., Bethel, J. S., McGlone, J. C., 2001. Introduction to modern photogrammetry (Vol. 1). John Wiley & Sons Inc.
Plets, R., Quinn, R., Forsythe, W., Westley, K., Bell, T., Benedetti, S., McGrath, F., Robinson, R., 2011. Using multibeam echo-sounder data to identify shipwreck sites: archaeological assessment of the Joint Irish Bathymetric Survey data. The International Journal of Nautical Archaeology, 40 (1), 87–98.
Roman, C., Inglis, G., Rutter, J, 2010. Application of structured light imaging for high resolution mapping of underwater archaeological sites. OCEANS 2010 IEEE – Sydney, 1 – 9.