RESEARCH ON RICE ACREAGE ESTIMATION IN FRAGMENTED AREA BASED ON
DECOMPOSITION OF MIXED PIXELS
Huanxue Zhanga, Qiangzi Lia,*, Fan Leib, Xin Dua, Jide Weib
a.Institute of Remote Sensing and Digital Earth, Chinese Academy of Sciences, Datun Road, Chaoyang District, Beijing 100101, China –[email protected]; [email protected] [email protected]
b.Hunan Province Land and Resources Planning Institute, Furong Road, Yuhua District, Changsha 410007, China – [email protected]
KEY WORDS: Rice, Acreage estimation, Mixed-pixels, Pure-pixels, Accuracy, Remote sensing
ABSTRACT:
Rice acreage estimation is a key aspect to guarantee food security and also important to support government agricultural subsidy system. In this paper, we explored a sophisticated method to improve rice estimation accuracy at county scale and we developed our approach with China Environment Satellite HJ-1A/B data in Hunan Province, a fragmented area with complex rice cropping patterns. Our approach improved the estimation accuracy by combing supervised and unsupervised classification upon decomposition of mixed pixels model, and the rice estimation results, validated by ground survey data, showed a close relationship (RMSE≈3.40) with survey figures, the estimated accuracy (EA) reached 83.74% at county level according to the sub-pixel method, and the accuracy can be increased about 12% compared to the pure-pixel method. The results suggest that decomposition of mixed pixels method has great significance to the improvement of rice acreage estimation accuracy, and can be used in mountainous and broken planting area.
*Corresponding author
1. INTRODUCTION
Paddy rice is one of the most important primary crops globally as the foundation of the economy of many countries, accounting for more than 11% of the global cropland area (Maclean, 2002). China is one of the biggest rice cultivation countries. Paddy rice accounts for more than 42% of the crop yield in China and its cultivation is strongly related to food security and economic sustainable development for China (Chen, 2011). So the Chinese government establishes the agricultural subsidy system, in this way, farmers can apply for an additional income subsidy, whose number is based on the type and acreage of the crops they grow. In the past, legal planting area data is obtained by the report way of the local Bureau of statistics (Han, 2007). It is estimated that about 5 billion is paid wrongly because the report applications were filled out incorrectly. For example, with the decrease of rice growing price, the farmers’ planting aspiration is lower, more and more double-season rice was planted to single-season rice in southern China, but to get an income subsidy, the farmers may list the crop type of a field as double-season rice, which is heavily subsidized, while in fact single-season rice, which is not subsidized, is grown. To reduce a huge amount of money spent on incorrect applications, a high accuracy estimation of paddy rice acreage becomes a key link for China.
More recently, remote sensing has been widely used in large scale crop acreage estimation because it has wide swath and can provide effective and timely spatial and temporal information on crop growth conditions (Yang, 2007, Chen, 2007, Okamoto, 1999, Koppe, 2013). Multi-temporal low resolution images and NDVI Time series dataset have been used to identification various crop types by extracting crop phenological information (Peng, 2011, Xiao, 2006&2005&2002, Wang, 2010, Fang, 1998). Methods based on these images could cover large area and can be got at no cost but cannot provide accurate estimation due to mixture pixels (Toan, 1997). Moreover, multi-temporal
and multi-polarize SAR data has been used to reflect the changes of rice crop height or roughness from others vegetation (Koppe, 2013). Most of these satellite-based rice maps could provide reliable estimation results, however these methods and images were constrained by narrow swath and low temporal resolution (low repeat cycles), limited spatial coverage at regional scale and are often costly.
The objective of this research is to explore a new method to improve the area estimation accuracy at county level and provide a technological support for the county grain subsidy. Previous research got the rice identification accuracy of 69% using multi-temporal HJ-1A/B data in the western part of Guangdong province (Chen, 2011). Although the result can be adopted at regional level, it can’t meet the accuracy requirement to support the agricultural subsidy system, which needs at least 80% at county level. In the study, we compared the rice mapping using traditional hard classification method and decomposition of mixed pixels method based on HJ-1A/B data, and then contrasted the rice acreage estimation results obtained by calculating non-arable coefficient and cloud proportion. The result indicates that the acreage estimation accuracy can achieve 83.74% and it can be improved 12% according to sub-pixel decomposition method, and this method can meet the accuracy requirement at county level.
2. STUDY AREA
region is a continental subtropical monsoon humid climate. The province has a total area of 211,800 km2, and cropland area of 87,949 km2, among which rice fields account for 43,589 km2 according to 2011 statistical data of local agriculture department. According to the paddy rice growth phenology collected from China Meteorological Bureau, we found total three rice seasons in Hunan Province. The agriculture statistical data indicated that in this area major rice cropping system is rotation system of early-season and late-season rice per year, secondly the single-season rice cropping per year. Double paddy rice includes an early and late rice crops with sowing for early rice starting in March, first harvest in early July, followed by transplanting of late rice and the second harvest in late October. Single-season paddy rice, only involves one rice crop per year for a given field, which always has a relative longer growth period compared to double rice, starting in May, harvest in early September. This research mainly estimates the late-season rice acreage in the study area. There are mainly five growth periods in rice life cycles: transplanting period; seedling developing period; ear differentiation period; heading period; mature period. Temporally, these five periods for late-season rice are usually June 15-20, June 25-30, August 5-15, August 25-September 10 and October 10-30 per year.
3. DATA AND PRE-PROCESSING
3.1 Remote sensing data
The China Environment Satellite constellation is designed mainly for environment and disaster monitoring by Chinese government. As a part of the satellite constellation, two optical satellites (HJ-1-A and HJ-1-B) are launched on September 6, resolution of 30 m than MODIS and NOAA AVHRR, a higher temporal resolution of 4 days and bigger imaging swath of 700 km than TM and SPOT (Chen, 2011). The multi-spectral information, moderate spatial and temporal resolution, and the large coverage capability of the HJ data make it to be a highly suitable data source for improving agricultural mapping accuracy on regional scale and reduce the monitor cost. Based on late rice calendar, 17 HJ-1A/B images with relatively less cloud or cloud shadow from July 30 to October 15 over the Hunan province were collected during the growth periods of late-season rice in 2012 (Fig.1). This period covers the whole growth stage of late rice from turning green to harvest. Pro-processing of these images mainly included radiance calibration and geo-correction. The radiance calibration of the HJ data was to convert the DN value of the raw image to surface spectral reflectance. Atmospheric correction was done using a 6S model (Vermote, 1997). The geo-correction was completed referring to already geo-rectified TM images.
3.2 Paddy fields data
The 2nd National Resource Survey Project, under the support of the Chinese Ministry of Land and Resources and the Chinese Academy of Sciences, completed the analysis of System Probatoired’ Observation dela Tarre (SPOT) images acquired from 2007 to 2009 for all of China. The images were geo-referenced and ortho-rectified, using field collected ground
control points and fine-resolution aerial remote sensing images. Visual interpretation of SPOT images was conducted to generate a thematic map of land cover in village at county scale of 1:10,000 and a thematic map of land cover in city at a scale of 1:500. The result is vector and county boundary dataset, so it was converted into a gridded database at 5m spatial resolution. The 5m resolution gridded paddy rice layer dataset over the Hunan Province was used to mask non-arable area (Fig.1).
3.3 Ground survey data
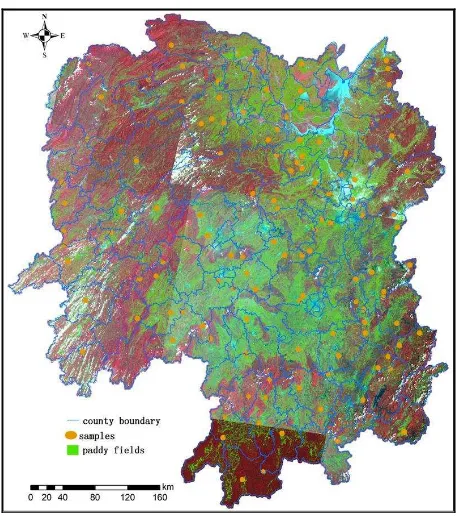
In the province, 122 samples at 1Km*1Km scale were obtained by spatial random sampling, which were used as ground training and validation data for the estimation of paddy rice (Fig.1). The ground survey was carried out on 1-25 September 2012. Firstly, the paddy field borders were lined out on images by GPS. And then the linear features, odd features and other crops in each paddy field were recorded. Half of the ground survey data was randomly selected as training samples, which were used for supervised classification, and the other half was selected as validation samples, which were used to validate the paddy rice mapping and acreage results.
Note: the base map is HJ images we used in the study
Figure 1. The distribution of HJ images, paddy fields and ground survey data in Hunan Province
4. METHODOLOGY
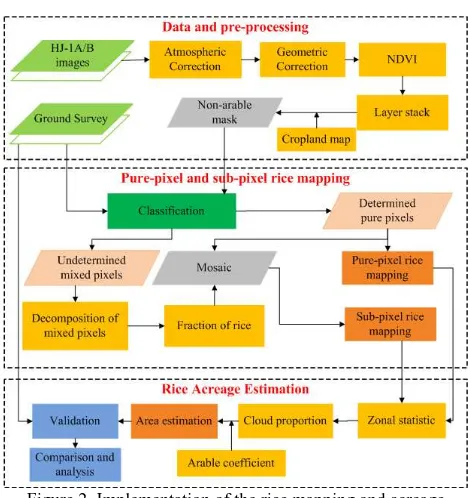
two methods. Fig.2 outlined the analysis algorithms and implementation.
Figure 2. Implementation of the rice mapping and acreage estimation
4.1 Extraction of non-arable mask images
The crops are highly reflective in the near infrared and highly absorptive in the visible red, the contrast between these channels can be used as an indicator of the status of the vegetation and crops (Sakamoto, 2011).There are many studies have shown that vegetation indices (VI), such as the Normalized Difference Vegetation Index (NDVI), enhanced vegetation index (EVI) and Soil-Adjusted Vegetation Index (SAVI), which have been used to discriminate crops and monitor crop growth conditions (Kamthonkiat, 2005, Friedl, 2002, Goward, 2012). Among these VI, the NDVI is the most widely used and the other indices are its refined form. In this study, we calculate the NDVI (Eq.1) of every image as a 5th band to be layered stack to the image.
(1)
Where and represent the reflectance of near infrared and red bands, respectively, which correspond to fourth and third bands for HJ-1A/B images.
After obtained the images with 5 bands, masks are made to exclude no-paddy fields by using paddy fields map provided by the 2nd National Resource Survey Project.
4.2 Pure-pixel rice mapping
Over the last decades, numerous algorithms to extract land cover information from remotely sensed images have been designed (Guo, 2012, Friedl, 2002, Liu, 2012, Zhang, 2008, Pan, 2012). Being a well-known statistical technique in other scientific disciplines, pixel-based classification was the first method to be applied to the multispectral digital image data. There are many classification methods such as maximum likelihood classifier (MLC), Supported Vector Machine (SVM) and decision tree which have been used in mapping crop lands. In the study, the most favourable classifier, MLC was selected as classification, which was made using VITO’s GLIMPSE software (Eerens, 2004).
The training and validation samples were conducted by expert knowledge based on field survey. Based on the phenology information, late-season and single-season rice were coinciding with the rainy season which typically starts at the end of March, and lasts until September. So, when the HJ imaging time is 15 September, four classes including late season rice, middle season rice, bare land and cloud, were trained for classification. And the else were trained for three classes, including late season rice, bare land and cloud. Then an adaptive maximum likelihood classification method was used to classify all the pixels into a certain class according to the ML-RULE. At last, the late rice identified result were obtained.
4.3 Sub-pixel rice mapping
4.3.1 Mixed pixels extraction
A mixed pixel is a picture element representing an area occupied by more than one ground cover type. In the area, the mixed pixels are mainly located at the edges of large objects like agricultural fields, and the mountainous area.
Instead of considering every pixel as a mixed pixel, in the study we only thought the edges of paddy rice fields and the mountainous area as the mixed-pixel region. The mixed pixels were extracted as following: a) The 17 HJ images were classified to 100 classes by K-means clustering, which is one of the most common unsupervised methods. b) We identified the late-season rice class among the 100 classes c) The unsupervised rice identification result was masked by the mosaic result of late rice pure pixels, and then the mixed pixels were obtained.
4.3.2 Decomposition of mixed pixels
As for the extraction result of mixed pixels, we selected the Linear mixture modelling, which is the most widely used method for extracting compositional information from remotely sensed images containing many mixed pixels. The fraction of rice can be calculated according to Eq. (2) and (3).
(2) (3) Where VI represents the NDVI of mixed pixels, VIr, fr represent the NDVI and fraction of rice pure pixels, VIbs, fbs represent the NDVI and fraction of bare land pure pixels.
4.4 Rice acreage estimation
Because the precipitation from August to October accounts for over 30% of annual precipitation in the Hunan province, and each HJ-1 A/B image has a large imaging swath, so many images collected were covered by clouds. Although we select several images to cover the same region, the province also has some regions that are covered by clouds. To minimize the potential impact of those areas with cloud cover in rice growing period on our estimation, we calculated the cloud proportion of every county to reason rice acreage under cloud cover.
There is also a need to reduce the influence of thin and small non-arable objects, such as ridges of fields, canals etc., we also calculate the non-arable coefficient by dividing the net cropland area using gross cropland area which was provided by local agriculture departments. The non-arable coefficient (r) of every county can be obtained using Eq. (4).
(4)
(5)
where S represent regional crop planting acreage, Ap represent crop pixel acreage, fr represent the fraction of rice, r represent non-arable coefficient, rcrepresent cloud proportion.
4.5 Survey data for validation of rice acreage results
Accuracy assessment of rice acreage estimation results at county scale is a challenging task, as the rice mapping result can overestimate or underestimate areas of individual land cover types due to the mosaic errors of 17 HJ images and the offset of geometrical rectification. Because of the human forces limitations and budget constraints, it is not able to conduct extensive labour intensive field surveys to validate the acreage result of every county in such a large area. In the research, we adopt the validation part of field survey acreage data to evaluate the estimated rice acreage results.
The root mean square error (RMSE) which is an alternative statistical measure and the EA were used to compare the estimated and survey figures. The two indices were defined by:
(6)
(7)
Where represent estimated crop planting acreage, Asrepresent ground survey crop acreage, N represent the number of total validation samples.
5. RESULTS
5.1 Mixed pixels identification and the results
Mixed pixels can be effectively identified through the method above mentioned, which are nearly half of the total. Most of mixed pixels are distributed at the fringe of large clusters. And Fig.3 gave an example of mixed pixels rice identification results in Dingcheng District.
(a) (b)
Figure 3. One example of decomposition of mixed pixels in Dingcheng District (a. HJ CCD images; b. the fraction of late-season rice)
5.2 Spatial distribution of late-season rice fields in Hunan Province
The distribution of late-season paddy rice fields in Hunan province were mapped from pure-pixel method using only maximum likelihood classifier (hereafter referred to as Purerice) and sub-pixel method combing Maximum likelihood classification and K-means clustering classifier (hereafter referred to as Mixrice) from 17 HJ-1A/B images. In this study, validation samples obtained from ground surveys data are employed to assess the classification accuracy of every image. Table 1 indicates the overall accuracy and Kappa coefficient of the 17 images using Maximum likelihood classification. The accuracy is all above 90% except for the images 2-84-20120820 and 4-88-20120829. This result indicates that we have accurately identified the rice pure pixels.
imaging orbit and time Overall
accuracy (%) Kappa 1-88-20121004 99.74 0.9945
2-80-20120818 96.20 0.9347
2-80-20120919 96.96 0.9494
2-84-20120820 87.66 0.8306
2-84-20120919 92.86 0.8938
455-84-20120916 99.33 0.9875
456-88-20121005 99.56 0.9931
457-54-20120915 96.41 0.9387
4-84-20120906 93.77 0.9139
457-84-20120915 94.48 0.9122
4-80-20120829 95.5 0.9285
4-84-20120906 93.77 0.9139
4-88-20120829 89.21 0.8554
6-84-20120828 98.08 0.9720
6-85-20121002 99.8 0.9970
7-81-20121001 99.07 0.9870
5-85-20120801 95.39 0.9305 Table 1. The overall accuracy and Kappa coefficient of HJ 1A/B
images using MLC method
of southern and western regions where altitude and topography prohibit the rice growth.
The spatial pattern of late-season rice from Mixrice (Fig. 4b) has some notable differences compared to that of the Purerice (Fig. 4a). In the middle of the province, we can easily find the Mixrice mapping identified many rice fields with low fractional coverage, such as the Dongkou county, Shaoyang county, Hengyang county, Leiyang district where rice fraction is lower
than 30%, while the Purerice mapping greatly underestimated rice planting area in these regions. This is because these areas are mountainous and increased complexity of topography restricts the size of rice fields that can occur, so the heterogeneous land cover in these areas is generally a mix of cropland and bare land, with most of the rice agriculture occurring in smaller river valleys or on terraced slopes.
Figure 4. Pure-pixel, sub-pixel comparisons of late-season rice distribution
5.3 Comparison of late rice acreage between pure-pixel and sub-pixel derived results
After obtained the late-season rice spatial distribution, we calculated the rice acreage of every county using Eq.5. Figures 5 (a) and (b) respectively showed the acreage result of late rice estimated from Purerice and Mixrice mapping at county level. Rice acreage at provincial and municipal level is just the sum of
every county. The late season rice estimated acreage of Hunan province is 1415,580 hectares and 1776,160 hectares separately using pure-pixel method and mix-pixel rice estimation method. The figures showed that the rice acreage was underestimated using only hard classification method, even if we calculated the non-arable coefficient and cloud proportion.
Compared Fig.5a and 5b, we can more intuitively find acreage obtained from the Purerice mapping is lower than the acreage of Mixrice mapping in some mountainous and rice sporadically planting counties especially in the middle and southern regions of the province, such as Qiyang County, Dao County, Longhui County, Dongkou County and so on. This is consistent with the analysis in front. In addition, from the figures we can also find even in the rice mainly producing areas (Dongting Lake in Hunan Province), the rice acreage derived from Purerice mapping is also underestimated, such as Ningxiang County, Yuanjiang County, Taoyuan County and so on, this is because even though these regions have relatively large rice planting fields, the mixed pixels still exist at the edge of the fields.
5.4 Quantitative evaluation of rice acreage estimation results
Certain challenges arise when we want to validate the rice acreage estimation result at county level. It is impossible to investigate the acreage of every county, because it will need large amounts of manpower, timing and material resources. In
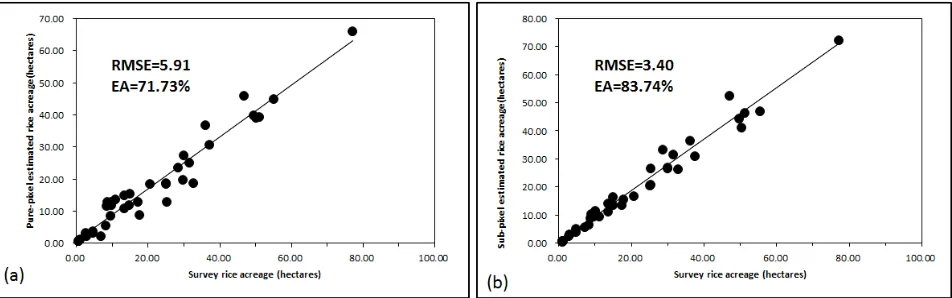
the study, rice acreage results validation is based on the ground survey figures. We calculated the RMSE, which is an alternative statistical measure that can be used to compare the datasets, and the EA to better verify acreage results. Fig.6(a) and (b) showed the relationship between survey figures and estimated late rice acreages respectively using pure-pixel and sub-pixel methods. Comparing the figures, the sub-pixel method obviously showed a better relationship between estimated and survey figures. The RMSE was 3.40 hectares for Mixrice (Fig.6b), while the RMSE was 5.91 hectares for Purerice (Fig.6a). The EA reached 83.74% according to Mixrice method (Fig.6b), while the acreage EA is only 71.73% derived from Purerice (Fig.6a). Compared to pure-pixel method, the accuracy has a 12% improvement using sub-pixel method. The strong relationship between the Mixrice and survey figures and the good estimation accuracy using Mixrice mapping suggest that sub-pixel method may be a useful tool to provide accuracy rice acreage estimation at county scale, and these results are very encouraging for government subsidy system.
Figure 6. Pure-pixel, sub-pixel comparisons of late-season rice acreage estimated accuracy between estimated and survey figures
6. DISCUSSIONS AND CONCLUSIONS
In this study, we separately used the hard classification method and decomposition of mixed pixels method to identify the late-season rice of Hunan province, and estimated the rice acreage at county scale based on rice fraction, non-arable coefficient and cloud proportion. The feasibility of operational rice acreage estimation by sub-pixel method using multi-temporal HJ-1A/B data presents much better compared to using pure-pixel method. The estimated accuracy reached about 83.74% at county level according to the sub-pixel method, while it was only 71.73% using pure-pixel method and the accuracy can be increased about 12% by decomposition of mixed pixels.
With the phenomenon of double-season rice changed to single-season rice becomes more and more serious in southern China, highly accurate estimation of rice acreage is becoming more and more important. Decomposition of mixed pixels method based on Maximum likelihood classification and K-means clustering in this study provided reliable rice acreage estimation after compared with the ground survey data and can be applied to other rice-producing provinces in China or other countries in Asia to generate an updated continental database of paddy rice agriculture.
This research results also demonstrate the China Environment Satellite HJ-1A/B has great potential in the development of an operational system for monitoring rice crop growth and
estimating rice crop acreage in southern China. If microwave sensor data on board HJ-1-C satellite is available later, the HJ constellation will have large scale and all-weather imaging capability, which will be a powerful data source for earth observation.
ACKNOWLEDGEMENTS
The work in this paper was supported by the National Natural Science foundation of China (41071277), the Key Research Program of the Chinese Academy of Sciences (KZZD-EW-08-05) and the project (00-Y30A02-9001-12/13-2-2). The authors also thank Hunan Province Land and Resources Planning Institute for providing the land-use mapping data.
REFERENCES
Chen, J., Huang J., and Hu, J., 2011. Mapping rice planting areas in southern China using the China Environment Satellite data. Mathematical and Computer Modelling, 54(3), pp.1037-1043.
Eerens, H., 2004. GLIMPSE: Global Image Processing Software user manual. VITO in house document, Belgium.
Fang, H. L., 1998. Rice crop area estimation of an administrative division in China using remote sensing data. International Journal of Remote Sensing, 19(17), pp.3411-3419.
Fang, H. L., Wu, B. F., Liu H. Y., and Huang, X., 1998. Using NOAA AVHRR and landsat TM to estimate rice area year-by-year. International Journal of Remote Sensing, 19(3), pp. 521-525.
Friedl, M. A., McIver, D. K., Hodges, J. C. F., et al, 2002. Global land cover mapping from MODIS: algorithms and early results. Remote Sensing of Environment, 83(1), pp.287-302.
Goward, S. N., Markham, B., Dye, D. G., Dulaney W. and Yang, J. L., 1991. Normalized difference vegetation index measurements from the advances very high resolution radiometer. Remote Sensing of Environment, 35(2), pp.257-277.
Guo, H., 2012. China’s earth observing satellites for building a digital earth. International Journal of Digital Earth, 5(3), pp.185-188.
Han, L., Pan, J., Jia, B., Zhu, X., Liu, L., Wang S., and Zhang J., 2007. Acquisition of paddy rice coverage based on multi-temporal IRS-P6 satellite AWIFS RS-data. Transactions of the Chinese Society of Agricultural Engineering, 23(5), pp.137-143.
Kamthonkiat, D., Honda, K., Turral, H., Tripathi N. K. and Wuwongse, V., 2005. Discrimination of irrigated and rainfed rice in a tropical agricultural system using SPOT VEGETATION NDVI and rainfall data. International Journal of Remote Sensing, 26(12), pp.2527-2547.
Koppe, W., Gnyp, M. L., Hütt, C., Yao, Y., Miao, Y., Chen X. and Bareth, G., 2013. Rice monitoring with multi-temporal and dual-polarimetric TerraSAR-X data. International Journal of Applied Earth Observation and Geoinformation, 21, pp.568-576.
Liu, J., Tian, Q., Huang Y. and Du, L., 2012. Crop extraction based on multi-temporal HJ satellite CCD Data in Jiaxiang County. Remote Sensing information, (2), pp.67-70.
Lobell D. B.andAsner, G. P., 2004. Cropland distributions from temporal unmixing of MODIS data. Remote Sensing of Environment, 93(3), pp.412-422.
Maclean, J. L., Dawe, D. C., Hardy B. and Hettel, G. P., 2002. Rice almanac: Source Book for the Most Important Economic Activity on Earth. Int. Rice Res. Inst..
Okamoto K. and Kawashima, H., 1999. Estimating of rice-planted area in the tropical zone using a combination of optical and microwave satellite sensor data. International Journal of Remote Sensing, 20(5), pp.1045-1048.
Pan, Y., Li, L., Zhang, J., Liang, S., Zhu X. and Sulla-Menashe, D., 2012. Winter wheat area estimation from MODIS-EVI time series data using the Crop Proportion Phenology Index. Remote Sensing of Environment, 119, pp.232-242.
Peng, D., Huete, A. R., Huang, J., Wang F. and Sun, H., 2011. Detection and estimation of mixed paddy rice cropping patterns with MODIS data. International Journal of Applied Earth Observation and Geoinformation, 13(1), pp.13-23.
Sakamoto, T., Shibayama, M., Kimura A. and Takada, E., 2011. Assessment of digital camera-derived vegetation indices in quantitative monitoring of seasonal rice growth. ISPRS Journal of Photogrammetry and Remote Sensing, 66(6), pp.872-882.
Toan, T. Le, Ribbes, F., Wang, L., Floury, N., Ding K. and Kong, J., 1997. Rice crop mapping and monitoring using ERS-1 data based on experiment and modeling results. Geoscience and Remote Sensing, IEEE Transactions on, 35(1), pp.41-56.
Vermote, E. F., Tanré, D., Deuzé, J. L., Herman M. and Morcrette, J. J., 1997. Second Simulation of the Satellite Signal in the Solar Spectrum, 6S: an overview. Geoscience and Remote Sensing, IEEE Transactions on, 35(3), pp.675-686.
Wang, Q., Wu, C., Li Q., and Li, J., 2010. Chinese HJ-1A/B satellites and data characteristics. Science China Earth Sciences, 53(1), pp.51-57.
Xiao, X., Boles, S., Frolking, S., Li, C., Babu, J. Y., Salas W. and Moore, B., 2006. Mapping paddy rice agriculture in South and Southeast Asia using multi-temporal MODIS images. Remote Sensing of Environment, 100(1), pp.95-113.
Xiao, X., Boles, S., Liu, J., Zhuang D. and Liu, M., 2002. Characterization of forest types in Northeastern China, using multi-temporal SPOT-4 VEGETATION sensor data. Remote Sensing of Environment, 82(2), pp.335-348.
Yang, X. H. 2007. Study on the remote sensing information extraction of rice based on neural network and support vector machine. Zhejiang University.