A BOX-COUNTING METHOD TO CHARACTERIZE DEGREES OF FOLIAGE
CLUMPING USING AIRBORNE AND SIMULATED LIDAR DATA
M. van Leeuwen a, *, J.A.N. van Aardt a, T. Kampeb, K. Krauseb a
Rochester Institute of Technology (RIT), Chester F. Carlson Center for Imaging Science, 54 Lomb Memorial drive, 14623, Rochester, New York, USA – (vanleeuwen, vanaardt)@cis.rit.edu
b
National Ecological Observatory Network (NEON), 1685 38th Street, 80301, Boulder, Colorado, USA – (tkampe, kkrause)@neoninc.org
KEY WORDS: LiDAR, leaf area index, foliage clumping, fractal dimension, box counting
ABSTRACT:
Monitoring forest productivity and health is key to sustainable ecosystem management and informed decision making. A key parameter used in monitoring forest resources is the leaf area index (LAI), which is defined as the one-sided leaf area per unit ground area and is used to describe the canopy radiation regime, among other forest biophysical dynamics. Traditional optics-based methods to estimate LAI rely on the measurement of canopy transmission and foliage clumping. Extending optical methods to LiDAR data has been challenging and studies have reported effective LAI assessments, with no further quantification of foliage clumping. This study investigates the use of the box-counting method to assess the fractal dimension of point cloud data for contrasting forest types and along a gradient of foliage dispersal. We demonstrate the box-counting method on simulated ‘range-to-hit’, as well as acquired airborne discrete LiDAR data. Coherent results obtained from the different test cases hint at the potential of the box-counting fractal dimension to characterize foliage clumping and bode well for the use of clumping assessments in support of airborne, wall-to-wall estimates of LAI.
*
Corresponding author.
1. INTRODUCTION
The clumping of foliage is an important aspect of canopy architecture and regulates the distribution of light across leaves and with canopy depth. It is used in the computation of the leaf area index (LAI), that is defined as the half-sided leaf area per unit ground area, and finds broad use in ecological and silvicultural models (Gower et al. 1999; Chen and Black, 1992). Despite its importance, the measurement of foliage clumping relies on field-based optical methods and has proved difficult to scale to the landscape.
Traditional methods to estimate LAI rely on some form of knowledge on the behaviour of radiative (light) transfer through the canopy. Nilson (1971) proposed the application of Beer’s law to estimate LAI using data related to the transmission of light through the canopy. The model considers exponential decay of light transmission with path length, based on the assumptions that leaves are infinitely small and leaf positions and orientation angles are both uniformly distributed (Sinoquet et al. 2005). Modifications to Beer’s law have been proposed that provide for LAI to be estimated for plant canopies with finite leaf sizes (Thanisawanyangkura et al. 1997) and for canopies where leaves are clumped around branches (Chen and Black, 1992). The latter introduced a clumping parameter/index in the exponent of Beer’s law, which slows down exponential decay of radiation with canopy depth. Traditional methods to measure this clumping index rely on the measurement of gap size distributions using a photodiode assembly that is moved along a linear transect underneath the canopy (Chen and Black, 1992). However, this constrains such measurements to fine scales only, as opposed to more synoptic remote sensing modalities.
Remote sensing approaches are ideally suited for the characterization of canopy architecture across broad scales. Previous studies have investigated correlations between LAI and canopy reflectance or range data. The latter is acquired using Light Detection and Ranging (LiDAR) scanners that provide for three-dimensional characterization of stand structure, including tree position and terrain elevation, as well as for measurement of light transmission through plant canopies. The data are generally captured as discrete-return point clouds, or as full-waveform digitization of backscattered energy. A waveform LiDAR signal represents a convolution of the emitted laser pulse with canopy elements exposed along the laser beam path. Such data hold more information than what is stored in discrete LiDAR returns and have been used to derive denser point clouds and for radiometric calibration to obtain apparent reflectance (Jupp et al. 2008). Studies using discrete LiDAR data typically have explored the use of summary statistics about return height information and correlations between these and field-measured LAI (e.g. Lefsky et al. 2005; Korhonen et al. 2011; Richardson et al. 2009; Morsdorf et al. 2006). Studies using full-waveform LiDAR data have typically explored information embedded in the transmission of light with range or canopy depth. For example, Jupp et al. (2008) used full-waveforms from a tripod-mounted system to describe gap probability as a function of range and estimated both leaf area and vertically-resolved foliage density profiles. More recently, Armston et al. (2013) and NiMeister et al. (2010) derived canopy gap probabilities from airborne full-waveform LiDAR data for LAI and biomass estimation.
observed canopy transmission as if the foliage were distributed uniformly (Jupp et al. 2008). However, significant deviations from exponential light decay can occur at the scale of individual trees or traditional inventory plots. To provide for improved leaf area estimates from remote sensing modalities, research is needed to address the characterization of canopy architectures into a condensed set of properties that captures the variation in leaf area density across a range of different scales.
Fractal analysis has become a popular field of research that studies scale-invariant features and self-similarity in object space. Iterative function systems (Sinoquet et al. 2005) or L-systems (Lindenmayer Systems; Prusinkiewicz and Lindenmayer, 2004) have gained traction as algorithms to construct graphics that exhibit self-similarity across a range of scales. L-systems have been widely used in plant modelling and are well suited to the study of light transport in heterogeneous media (Sinoquet et al. 2005, 2007; Da Silva et al. 2006; Cote et al. 2011). The fractal dimension of these forms can either be derived from theory (Sinoquet er al. 2005) or measurement. Sinoquet et al. (2007) have investigated the use of the box-counting method to compute variance in foliage density across a range of scales, and related these estimates to lacunarity, a measure of the porosity of media, and foliage dispersion. Hereto, points along the fractal geometries were sampled and a hierarchy of grids were built that divided the three-dimensional space into homogeneous boxes of decreasing size, and for each hierarchical tier the number of boxes was counted that contained any surface points. For fractal objects, the relationship between the logarithm of the box count and the logarithm of the box size is linear, so that the slope of the regression line defines the fractal dimension. Box counting has also been applied to real plant canopies using point cloud data from digitizer wands (Sinoquet et al. 2005, 2007) and using hemispherical photography (Jonckheere et al. 2006), but to the authors’ knowledge, its application to airborne LiDAR data remains underexplored.
This paper therefore investigates the use of the box-counting method in three dimensions using simulated ‘range-to-hit’ and airborne LiDAR data and investigates the potential to characterize various degrees of foliage clumping.
2. METHODS
2.1. Study area
The study area is located in California, and comprises two sites, described in detail in Kampe et al. (2013). The first is the San Joaquin Experimental Range (SJER), about 32 km north of Fresno, California, USA. This site is a woodland savannah dominated by blue oak (Quercus douglasii), interior live oak (Quercus wislizeni) and grey pine (Pinus sabiniana), and the ground is continuously covered with herbaceous vegetation. The climate is Mediterranean, with wet cool winters and dry hot summers, while annual precipitation is about 486 mm and mean monthly temperatures range from 4 to 10 °C in winter and between 24 and 27 °C in summer.
The second study site is Soaproot Saddle (SOAP), which is located about 30 km east from SJER, and approximately 5 km south of Shaver Lake at an altitude of approximately 1100 m. This site is composed of a mixed deciduous/conifer forest and is dominated by ponderosa pine (Pinus ponderosa) and incense cedar (Calocedrus decurrens). The canopy is open and the
forest floor is densely covered with a variety of shrubs, including mountain misery (Chamaebatia australis).
2.2. Data collection
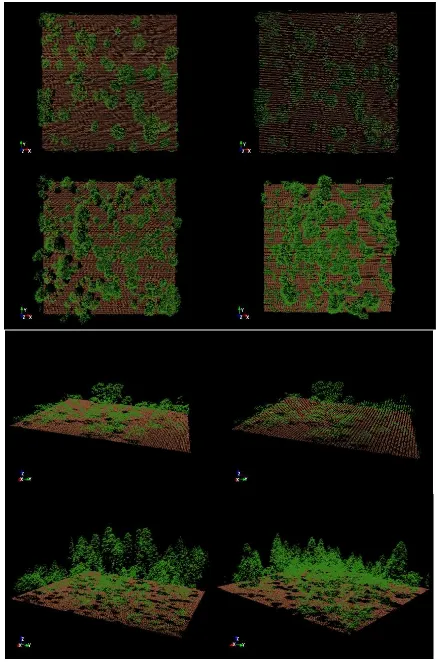
Data were collected on June 12 and 13, 2013 using the National Ecological Observatory Network (NEON) Airborne Observatory Platform (AOP) that features a full-waveform Optech Gemini small-footprint LiDAR and an imaging spectrometer based on the AVIRIS Next-Generation (AVIRISng) instrument. The LiDAR system records both discrete and full-waveform returns and operates in the 1064 nm waveband (Kampe et al. 2010). From the flight line data, three 120 x 120 m plots were selected, with one in the San Joaquin Experimental Range (site AOP116), and two in Soaproot Saddle (AOP143, and AOP299). Site AOP116 was represented in two flight lines (i.e., numbered 3 and 12); hence, both flight lines were used in our analysis, resulting in two point clouds for site AOP116. Figure 2 shows illustrations of the point clouds, as classified into vegetation and ground returns.
Figure 2: Selected LiDAR point clouds from the NEON AOP system, shown in nadir and oblique view. The two panels show the four plots in corresponding order. Top left:
SJER, site AOP116, flight line 3; Top right: SJER, site AOP116, flight line 12; Bottom left: SOAP, site AOP143, flight line 10; Bottom right: SOAP, site AOP299, flight line
7. Each plot represents 200 x 200 m. Note the distinct horizontal and vertical structural differences between the
2.3. Data simulation
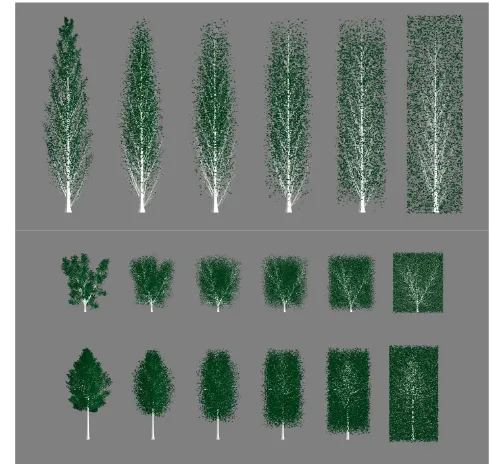
Virtual scenes for data simulation were generated using Arbaro (Weber and Penn, 1995), a tree regeneration software written in Java that provides for the three-dimensional modelling of a wide variety of shrubs and trees using a set of intuitive inputs that defines parameters such as stem lengths, orientation, and number of splits, for up to three branching orders. Three trees were selected from the standard template library (http://sourceforge.net/projects/arbaro/) and were used for subsequent analysis. The trees were placed in scenes, and an axis-aligned bounding box was used to tightly enclose each scene. A total of four scenes were generated, comprising three trees and a mixed stand. For each scene, a range of foliage dispersions was generated (Figure 3 and 4). Hereto, individual leaves, comprised of a fixed number of facets, were labelled and a uniform distribution S of n points, equal to the number of
leaves, was created within the scene’s bounding box. Linear transects were computed between each leaf and a randomly chosen point in S, and leaves were moved along these transects. For each scene, six different degrees of foliage dispersal were created, so that in each step along this gradient, leaves moved 20% of the distance towards their randomly assigned point in S.
From the ceiling of the scene-bounding box, rays were projected into the scene and intersections with scene elements were computed using SRT (Van Leeuwen et al. 2013). The bounding box was used as a periodic boundary, so that rays would cyclically re-enter the scene until they either intersected a tree element or hit the scene floor. Using a density of 30 rays m-2, under an incidence angle of 1 rad from zenith, each of the 24 scene-dispersion combinations resulted in a three-dimensional point cloud that was used for box-counting analysis.
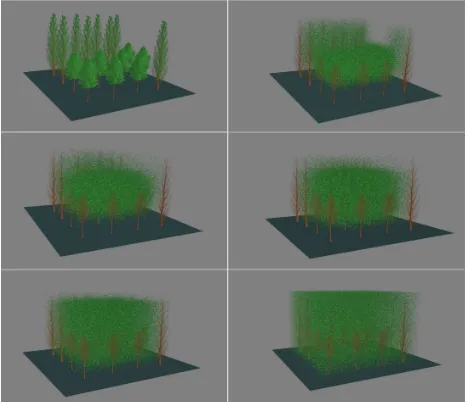
Figure 4: Different degrees of foliage dispersion for a constructed mixed virtual scene, representing poplar and aspen species.
2.4. Box-counting design
For each point cloud, P, derived from the virtual scene-dispersal combinations or AOP LiDAR data, the box-counting method was used to compute a fractal dimension. For scenes comprising a single tree, a hierarchy of box sizes was created by iteratively dividing the scene-bounding box into smaller units, so that the number of boxes exponentially grew as i3, for i = 1, 2, 3, …, 8. For the stand-level point cloud data, lengths, r, were measured in meters, since plot size is an arbitrary measure. The range of box sizes (r) was 5 to 50 m for NEON sites SJER and SOAP, and 1 to 10 m for the simulated stand, due to its smaller size. In each hierarchical tier, the number N of boxes was counted that consisted of one or more points in P. For a range of scales, e.g., greater than a leaf, clumped canopies were expected to have lower fractal dimension, while more uniform foliage distributions were expected to have higher fractal dimensions. The fractal dimension was computed from the slope of the regression line between Log N and Log r-1.
The efficacy of the box-counting method to estimate foliage clumping was assessed from the change in fractal dimension with clumping degree. For the simulated data, the degree of clumping was directly assessed from the range of translation of
leaves along their randomly assigned line transects. No use of TRAC (Chen and Black, 1992) or hemispherical photography was made at this stage to characterize foliage clumping at the two NEON sites; we wanted to first establish the theoretical validity of the approach before its extension to field measurement efforts.
3. RESULTS
Figure 6: Relationship between the number of boxes enclosing LiDAR returns and the reciprocal of the box size, shown on logarithmic axes (box size, r, in meters). The slope of regression lines equates to the fractal dimension.
Figure 7: Distribution in range-to-first hit for different degrees of foliage clumping for the virtual mixed stand. The histograms show a transition from a bimodal distribution towards a negative exponential distribution, according to a change
Figure 8: Relationship between the box count and the reciprocal box size for simulated point clouds from individual trees. Box size was chosen as an integer division of the scene-bounding box. The fractal dimension (slope) increases as clumping is
reduced towards more uniform foliage distributions.
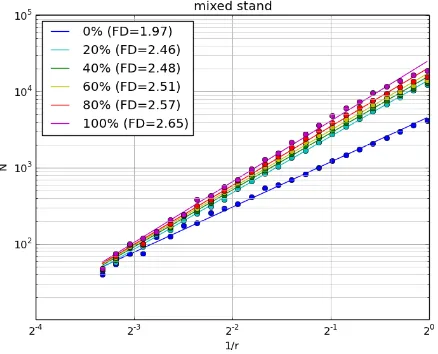
Box-counting analysis shows that the decrease in fractal dimension is consistent with the degree of foliage dispersal that was applied to the scenes (Figure 8 and 9). The fractal dimension (slope) increases as clumping is reduced and the foliage distribution becomes more uniform. For individual trees, the scale of box sizes was defined as an integer division of the scene’s bounding box, hence the fractal dimensions of the individual trees have a slightly different interpretation than the fractal dimension of the mixed scene. While the fractal dimensions of individual trees relate solely to crown architecture, patterns in the mixed scene relate, in addition, to the clumping of the stand into crowns, which for this study was based on a regular spacing. Nevertheless, a marked linearity in the logarithmic relationship was observed, as well as in the variation of the fractal dimension for the range of foliage dispersals considered and for box sizes ranging between 1 and 10 m.
Figure 9: Box-counting analysis of point cloud data simulated for the mixed stand.
4. CONCLUSION
The box-counting method was used to assess the fractal dimension of point clouds obtained from simulated
range-to-first hit and discrete LiDAR data. Airborne discrete LiDAR data showed a consistent variation in slope of the regression line between log N and log r-1 between sites. Fractal patterns of vegetation were more clearly observed at the scales of individual trees; however, a linear relationship between Log N
and Log r-1 also was observed at the stand level. These results hint at the value of the box-counting method for deriving information related to foliage clumping from range data. Further research is needed to link these observations to the site-specific clumping index, as measured via hemispherical photography or TRAC (Chen and Black, 1992) and to investigate effects of beam width and pulse duration that potentially could obscure some of these fractal patterns.
ACKNOWLEDGEMENTS
This material is based upon work supported by the National Science Foundation’s National Ecological Observatory Network (NEON) under grant #1029808/1010-234-000. Any opinions, findings, and conclusions or, recommendations expressed in this material are those of the author(s) and do not necessarily reflect the views of the National Science Foundation. We would also like to acknowledge the NEON field and airborne crews for collecting data over the San Joaquin and Soaproot Saddle research sites.
BIBLIOGRAPHY
Armston, J., Disney, M., Lewis, P., Scarth, P., Phinn, S., Lucas, R., Bunting, P., Goodwin, N., 2013. Direct retrieval of canopy gap probability using airborne waveform lidar. Remote Sensing of Environment, 134, pp. 24-38.
Chen, J.M., Black, T.A., 1992. Foliage area and architecture of plant canopies from sunfleck size distributions. Agricultural and Forest Meteorology, 60, pp. 249-266.
Da Silva, D., Boudon, F., Godin, C., Puech, O., Smith, C., Sinoquet, H., 2006. A critical appraisal of the box counting method to assess the fractal dimension of tree crowns. In: Advances in Visual Computing, G. Bebis et al. (Eds.), Springer-Verlag, Berlin, Heidelberg, pp. 751-760.
Gower, S.T., Kucharik, C.J., Norman, J.M., 1999. Direct and indirect estimation of leaf area index, fAPAR, and net primary production of terrestrial ecosystems. Remote Sensing of Environment, 70, pp. 29-51.
Jonkheere, I., Nackaerts, K., Muys, B., van Aardt, J., Coppin, P., 2006. A fractal dimension-based modeling approach for studying the effect of leaf distribution on LAI retrieval in forest canopies. Ecological Modelling, 197, pp. 179-195.
Jupp, D.L.B., Culvenor, D.S., Lovell, J.L., Newnham, G.J., Strahler, A.H., Woodcock, C.E., 2008. Estimating forest LAI profiles and structural parameters using a ground-based laser called ‘Echidna’. Tree Physiology, 29, pp. sites in California. NEON.DOC.001298, http:// http://www.neoninc.org/sites/default/files/biblio-files/TM-005.pdf
Kampe, T.U., Johnson, B.R., Kuester, M., Keller, M., 2010. NEON: the first continental-scale ecological observatory with airborne remote sensing of vegetation canopy biochemistry and structure. Journal of Applied Remote Sensing, 4, article no. 043510.
Korhonen, L., Korpela, Heiskanen, J., Maltamo, M. (2011) Airborne discrete-return LIDAR data in the estimation of vertical canopy cover, angular canopy closure and leaf area index. Remote Sensing of Environment, 115, pp. 1065-1080.
Lefsky, M.A., Hudak, A.T., Cohen, W.B., Acker, S.A., 2005. Geographic variability in LiDAR predictions of forest stand structure in the Pacific Northwest. Remote Sensing of Environment, 95, pp. 532-548.
Morsdorf, F., Kotz, B., Meier, E., Itten, K.I., Allgower, B., 2006. Estimation of LAI and fractional cover from small footprint airborne laser scanning data based on gap fraction. Remote Sensing of Environment, 104, pp. 50-61.
Ni-Meister, W., Lee, S., Strahler, A.H., Woodcock, C.E., Schaaf, C., Yao, T., Ranson, K.J., Sun, G., Blair, J.B., 2010. Assessing general relationships between aboveground biomass and vegetation structure parameters for improved carbon estimate from lidar remote sensing. Journal of Geophysical Research, 115, article no. G00E11.
Nilson, T., 1971. A theoretical analysis of the frequency of gaps in plant stands. Agricultural meteorology, 8, 25-38. Prusinkiewicz, P., Lindenmayer, A., 2004. The algorithmic
beauty of plants. Retrieved from: http://algorithmicbotany.org/papers/abop/abop.pdf Richardson, J.J., Moskal, L.M., Kim, S.-H., 2009.
Modeling approaches to estimate effective leaf area index from aerial discrete-return LIDAR. Agricultural and Forest Meteorology, 149, pp. 1152-1160.
Sinoquet, H., Sonohat, G., Phattaralerphong, J., Godin, C., 2005. Foliage randomness and light interception in 3-D digitized trees: an analysis from multiscale discretization
of the canopy. Plant, Cell and Environment, 28, pp. 1158-1170.
Sinoquet, H., Stephan, J., Sonohat, G., Lauri, P.E., Monney, Ph., 2007. Simple equations to estimate light interception by isolated trees from canopy structure features: assessment with three-dimensional digitized apple trees. New Phytologist, 175, pp. 94-106.
Thanisawanyangkura, S., Sinoquet, H., Rivet, P., Cretenet, M., Jallas, E., 1997. Leaf orientation and sunlit leaf area distribution in cotton. Agricultural and Forest Meteorology, 86, pp. 1-15.
Van Leeuwen, M., Coops, N.C., Hilker, T., Wulder, M.A., Newnham, G.J., Culvenor, D.S., 2013. Automated reconstruction of tree and canopy structure for modelling the internal canopy radiation regime. Remote Sensing of Environment, 136, pp. 286-300.