Non-linear cortico – cortical interactions modulated by
cholinergic afferences from the rat basal forebrain
Alessandro E.P. Villa
a,*
,1, Igor V. Tetko
a,b, Pierre Dutoit
a, Guido Vantini
aaLaboratoire de Neuroheuristique,Institut de Physiologie,Uni
6ersite´ de Lausanne,Rue du Bugnon7, CH-1005Lausanne,Switzerland
bBogomoletz Institute of Physiology,National Academy of Sciences of Ukraine,Kie
6,Ukraine
Abstract
In the adult rat most of basal forebrain cholinergic neurons (BFCN) express the low-affinity p75 nerve growth factor receptor (NGFr). The immunotoxin 192 IgG-saporin (SAP) provokes a selective loss of NGFr-positive BFCN, somewhat similar to the loss of integrity of BFCN associated with human senile dementia of Alzheimer’s type, whereas NGF exerts a trophic action on BFCN. Cortico – cortical interactions are modulated by cholinergic projections of BFCN and it is proposed that alterations of these projections by SAP and by NGF produce opposite effects. This hypothesis was tested by recording multiple local field potentials (LFPs) in the rat temporal cortex and applying bispectral analysis to measure phase-coupled frequencies, somewhat analogous to frequencies of resonance. Choline acetyltransferase (ChAT) activity was measured in the septal area in order to assess the effects of the treatments. NGF-treatment increased ChAT activity by 45% and frequencies of non-linear coupling were shifted towards frequencies higher than 70 Hz, thus suggesting the presence of increased functional interactions in the short range. By contrast, SAP provoked a decrease of nearly 40% in ChAT activity and an increase of phase-coupling in the low frequencies (B50 Hz), being interpreted as a decreased functional cortico – cortical interaction. Bispectral analysis revealed features of the effect of BFCN on cortical activity that could not be observed by other means and offers as a valuable tool of study that could be extended to the EEG of Alzheimer’s patients. © 2000 Elsevier Science Ireland Ltd. All rights reserved.
Keywords:Bispectral analysis; 192 IgG-saporin; rhNGF; Alzheimer’s disease cortico – cortical interactions; Temporal cortex; Rat basal forebrain
www.elsevier.com/locate/biosystems
1. Introduction
Basal forebrain cholinergic neurons (BFCN) are distributed throughout the ventral pallidum and substantia innominata (Mesulam et al., 1983). These neurons receive afferences from several ar-eas, including the midbrain, peripenducular nu-cleus, hypothalamus and amygdala and have a * Corresponding author. Tel.:+41-21-6925532; fax:+
41-21-6925505.
E-mail address: [email protected] (A.E.P. Villa).
1http://www.lnh.unil.ch
wide pattern of projections to neocortex, hippocampus, amygdala, olfactory bulbs, thala-mus and brainstem (Lamour et al., 1982; Parent et al., 1988; Chen and Bentivoglio, 1993).
Immunohistochemical and in situ hybridization studies have colocalized on the surface of BFCN (Gibbs and Pfaff, 1994) a low affinity neuro-trophin receptor (p75NGFR) and a high affinity
receptor (TrkA) that bind to nerve growth factor. Nerve growth factor (NGF, Calissano et al., 1984), a member of the neurotrophin family (Thoenen, 1991), is known to exert a trophic action on BFCN (Honegger and Lenoir, 1982). In the adult rat NGF is expressed in specific areas of the forebrain that overlap to a large extent the regions innervated by BFCN (Korsching et al., 1985). It has been shown that in brain regions innervated by BFCN, the intracerebroventricular (ICV) administration of NGF induces a dose-de-pendent, long-lasting increase of the synthetic en-zyme choline acetyltransferase (ChAT) activity (Fusco et al., 1990) and an enhancement of high-affinity choline uptake, acetylcholine (ACh) syn-thesis and release (Rylett et al., 1993). Therefore, a prominent and specific activation of BFCN transmission in vivo is likely to be one of the main mechanisms underlying the effects induced by NGF in the adult brain.
Experimental studies indicate that BFCN may be involved in the control of shifting attention to potentially relevant sensory stimuli that predict an event of importance for the individual (Chiba et al., 1995). Interestingly, a hallmark of Alzheimer’s Disease (AD) is a decrease in number and func-tion of BFCN (Davies and Maloney, 1976). Hu-man patients affected by AD are characterized by complex cognitive deficiences including impaired ability to shift visuospatial attention (Terry and Katzman, 1983; Scinto et al., 1994). In other mammalian species disruption of several cognitive functions has also been associated with loss of integrity of BFCN functions (Whishaw et al., 1985). In addition to these findings recent studies about pathological amyloid metabolism associ-ated to AD (Growdon, 1997; Lin et al., 1999) sustain the hypothesis that changes of the cholin-ergic system associated to primary dysfunction of BFCN might be a main cause responsible of AD
(Coyle et al., 1983; Gallagher and Colombo, 1995).
Cholinergic basal forebrain lesions can be used to study the role of the cholinergic system in cortical arousal and normal cognitive function. The selectivity of these lesions is crucial and has been achieved using a specific immunotoxin (Wi-ley, 1992), which is a monoclonal antibody (192 IgG) directed against the low affinity neuro-trophin receptor (p75NGFR) linked to a
ribosome-inactivating cytotoxic protein (saporin). Injections of the 192 IgG-saporin (SAP) provoke selective lesions of NGFR-positive BFCN and decrease of ChAT activity in widespread areas of the neocor-tex and hippocampus that allow an animal model to mimic some key features of AD.
to increased BFCN activity, thus giving rise to lower frequencies of resonance.
2. Materials and methods
2.1. Subjects and surgical procedures
Adult female Long – Evans rats (n=17, Etab-lissements Janvier, Le Genest-St-Isle, France), weighing 215 – 295 g, were used in compliance with Swiss guidelines for the care and use of laboratory animals and after receiving veterinary governmental approval. The animals were subdi-vided into control (n=6), 192 IgG-saporin treated (n=7) and NGF treated groups (n=4). Two animals received no lesions and contributed to the control group. Nine animals received a unilateral ICV injection of either 5.4 mg of 192 IgG-saporin (Chemicon International Inc., item no. MAB390 — 25 mg), 0.9 mg/ml dissolved in sterile PBS containing 0.05% sodium azide (n=7 subjects in the SAP group), or either an equiva-lent volume of vehicle (n=2 in the control group). The injections were performed via a 10-ml Hamilton syringe in the left lateral ventricle, at about 1.2 mm lateral and 0.8 mm posterior from bregma.
Six animals were implanted with an infusion cannula in the left lateral ventricle and then con-nected to a miniosmotic pump (Alzet, model 2002) either for NGF delivery (n=4 in the NGF group) following a procedure described elsewhere (Williams et al., 1986; Fusco et al., 1989) or for cytochrome c delivery, a protein that has similar physicochemical properties as NGF but lacks its biological activity (n=2 in the control group). Recombinant human NGF (60 mg per pump rhNGF, Genentech Inc.) or cytochromec, diluted with artificial cerebrospinal fluid, was infused at the dose of about 4.3 mg per day for 2 weeks. Surgery for ICV injections or pump implantation was performed under barbiturate anesthesia (Nembutal, 40 mg/kg, IP). All operated rats were injected s.c. with Bactrim (1 ml/kg) the day of surgery and then for the following 2 days.
2.2. Postmortem procedures
Electrolytical lesions for reconstruction of recording sites were made at known depths by passing a current of about 8 mA for 10 s. Upon completion of the recording session, animals were sacrified by cervical dislocation under deep anes-thesia (Nembutal, 120 mg/kg body weight, IP). The brains were rapidly removed and a slice, about 1.5 mm thick, was obtained by coronal sections of the forebrain between the level of the rostral part of genu corpus callosum (at about 10.5 mm from the interaural line) and the optic chiasm (at about 9 mm from the interaural line). The medial septal area was dissected from this slice and stored at −80°C until biochemical as-says of ChAT were performed. In eight animals we dissected also samples of the neocortex (fron-tal/parietal) anterior to the recording sites. The activity of ChAT, which is a marker of BFCN, was measured (Vantini et al., 1989) to validate the effectiveness of the NGF treatment protocol used in this study of activating forebrain cholinergic neurons. The part of the brain caudal to the optic chiasm was postfixed during 2 weeks (4% paraformaldehyde in phosphate buffer 0.1 M, pH 7.3) and used for histology. Reconstruction of the electrode tracks was performed on standard cresyl violet-stained brain coronal sections, 50 mm thick.
2.3. Electrophysiological procedures
LFPs were recorded from the temporal cortical regions by mean of four independently driven glass-coated platinum-plated tungsten microelec-trodes (impedance in the range 0.5 – 2 MV at 1 kHz) which were advanced by 5mm steps (Villa et al., 1999). Two electrodes were inserted into the cortex via one guide cannula, and were approxi-mately 200 mm apart from each other, and ap-proximately 1000 mm from the two other electrodes. High and low pass filter settings for LFPs were 7 – 100 Hz, respectively, with a 50 Hz notch filter. Several sites were sampled across the entire cortical depth, but not the underlying white matter.
2.4. Analysis of local fields potentials
Power spectra were computed by Fast Fourier Transforms of 512 points. Data points were sam-pled at the rate of 512 samples/s and we selected epochs of LFPs lasting 1 s. Thus, the frequency resolution of our analysis was 1 Hz. In addition to this analysis we used the third order cumulant analysis of the LFPs. This analysis was used to measure the phase-coupled frequencies corre-sponding to non-linear coupling of spectral fre-quency components, somewhat analogous to frequencies of resonance. In brief, this analysis can be described as follows. Firstly, let us con-sider a case study where an analog signal from a single channel, e.g. a local field potential x(t), is recorded duringNepochs of equal duration, such that x(t)=SN (a+b+ab) where a(t)=cos(2p f1t+va) and b(t)=cos(2pf2t+vb) and f1, andf2
represent two frequencies of periodic processes andva andvbare phases randomly changed, i.e. uniformly distributed in [0, 2p], for each epoch. Notice the non-linear interaction is represented by the term ab.
The spectral representation of this signalX(f) is obtained by the Fourier transform X(f)=
SNx(t) e−it2pf. The power spectrum is
Pxx(f)=
X(f)2 and its shape will show peaks
corresponding to frequenciesfl,f2andf3=f1+f2.
This is not sufficient to determine if the peak at frequency f3 corresponds to a genuine non-linear
interaction produced by the two oscillatory pro-cesses that interact — and generate a third
com-ponent — or if it corresponds to an independent frequency. In order to resolve this ambiguity we compute the bispectrum. Bxxx=
NX(f
1)X(f2)
X*(f1+f2), that will be near 0 in case of
indepen-dence, and for the peaks in the bispectrum we estimate the value of the interaction by the bico-herence
In the case study x(t) an interaction exists between f1, and f2-represented by the term ab-so
that a significant value of the bicoherence is ob-served for bifrequencies (f1, f2).
Let us now consider another signal y(t), recorded on a different channel, such thaty(t)=
SN(c
+d+cb) where c(t)=cos(2pf1t+vc) and
d(t)=cos(2pf2t+vd) and f1, andf2represent the
same frequencies of signalx(t) andvcandvdare phases randomly changed in [0, 2p] for each epoch. Notice the non-linear interaction repre-sented by the term cb The power spectra Pxx(f)
and Pyy(f) are identical but in the case y(t) no
interaction can be detected by the bispectrumByyy
because the term of interaction includes the com-ponentb with a phase,vb, that is absent from its linear components cand d.
The previous analysis can be extended to a bivariate case where x(t) and y(t) are recorded simultaneously. In the cross-channel analysis the interactions are not symmetrical and one should consider the influence of the generator processes of x(t) on y(t) and vice versa. Thus, for the interaction xy we compute the cross-bispec-trum Bxyx=SNX(f1)Y(f2)X*(f1+f2) and the
The non-linear interaction term of x(t) is ab and it is independent from the linear terms of y(t). Then, no significant peaks will be detected in the crossbispectrum Bxyx. The quantitiesByxyand
Cyxy are derived in a similar way for the
estima-tion of the interacestima-tionyx. In the case study the interaction term cb contains the term b of x(t) and consequently the cross-bispectrum Byxy
the significant interactions at couples of frequen-cies f1 and f2, we tested the hypothesis that the
bispectrum was equal to zero (Huber et al., 1971; Brillinger and Irizarry, 1998) at the 99% confi-dence limit. Phase-coupled frequencies f3=f1+f2
were determined for corresponding significant bis-pectral analysis at couples of frequenciesf1andf2.
3. Results
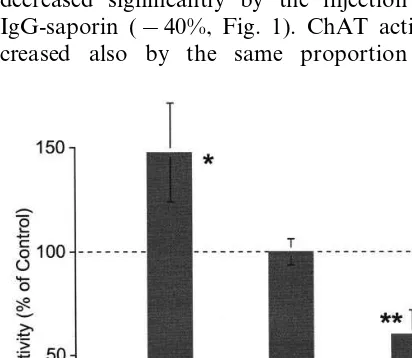
Radioenzymatic ChAT assays were performed to assess the effect of the treatments. Samples of medial septal area of equal weight (17.9 mg on average) were analyzed and the ChAT activity in controls was equal to 21.191.3 mmol/h (aver-age9S.E.M.) per 100 mg of protein. In agree-ment with previous reports (Fusco et al., 1990; Rylett et al., 1993; Villa et al., 1996), the NGF administration elicited a significant increase of ChAT activity (+48%, Fig. 1). On the opposite, the level of ChAT activity in the septum was decreased significantly by the injection of 192 IgG-saporin (−40%, Fig. 1). ChAT activity de-creased also by the same proportion in the
neocortex samples (79.0 mg on average) of the SAP-treated rats compared with controls (4.59 0.9 vs. 6.990.3 mmol/h per 100 mg of protein, two-tailed t-test 2 PB0.05). The decreased corti-cal ChAT activity is in line with data reported elsewhere in the literature related to the use of the same type of commercial 192 IgG-saporin in simi-lar doses (Rossner et al., 1995). The radiochemical detection of ChAT activity indicates that both NGF- and SAP-protocols used in the present study were highly effective in altering the function of BFCN.
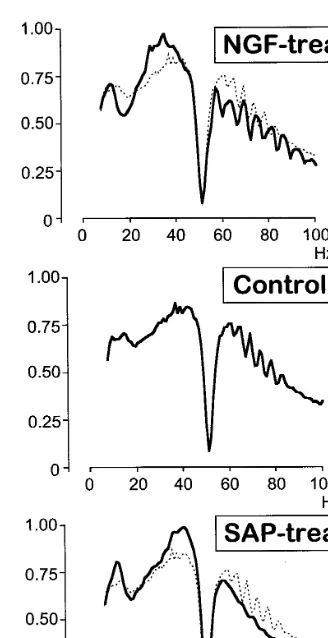
We recorded four LFPs simultaneously from 24, 20 to 28 different sites in controls, NGF- and SAP-treated animals, respectively. The recordings analyzed here were obtained under steady-state anesthetized condition in the absence of external sensory stimulation, a condition often referred to as spontaneous (or background) activity. At each location, the recorded time analyzed here varied between 6 and 8 min, which represents a total time corresponding to more than eight consecu-tive hours for all groups of animals. The power spectrum was computed in the range 7 – 100 Hz for each LFP over the duration of the recording at one location. The number of spectra computed in each group was n=112, 72, 117 for controls, NGF- and SAP-treated animals, respectively. All power spectra of brain signals recorded in one group of animals were grouped together and then normalized in order to have 100% density in the range 7 – 100 Hz (Fig. 2). All power spectra densi-ties were characterized by the effect of notch filtering centered on 50 Hz.
NGF treatment provoked a decrease in 15 – 20 Hz power whereas the injection of 192 IgG-sa-porin provoked an increase of lower frequencies with a peak at 13 Hz. Interstingly, both treat-ments increased the relative power in the 20 – 50 Hz frequency range and decreased at higher fre-quencies, but with a very distinct pattern. An increase between 29 and 35 Hz was observed in the cortical activity of NGF-treated animals, whereas SAP-treated were characterized by an increase in power in the 38 – 42 Hz range. The main changes observed at high frequencies (\50 Hz) were not related to the change in relative power, but rather by the quasi-sinusoidally modu-Fig. 1. ChAT activity expressed as percent of control (n=6) in
Fig. 2. Averaged power spectrum densities for each group of animals. The bin size of the histogram is 1 Hz. The vertical scale is in arbitrary units normalized to the highest bin in the distributions. The dotted lines in the uppermost and lower-most panels correspond to the averaged power spectrum of the control group.
representative data from all recording sites and to avoid that a limited number of recordings, charac-terized by a larger number of very significant bicoherencies, would bias the grand average anal-ysis. The values of the bicoherence for single-channel calculations, wheref1andf2 are observed
in the same signal, were larger in controls than in treated rats (median values equal to 8.1 versus 4.5 and 3.7 in NGF- and SAP-treated, respectively). The 2-D plot of the bicoherences for cross-chan-nel calculations (Fig. 3) has a complex shape due to the symmetry properties of bispectral analysis (Brillinger, 1965; Nikias and Raghuveer, 1987). Values of cross-bicoherence tended to be 40% lower than in single-channel bicoherence, but the same difference in magnitude remained between controls and treated rats. The data for single- and cross-bicoherence were pooled together and the distribution off3in the three groups of animals is
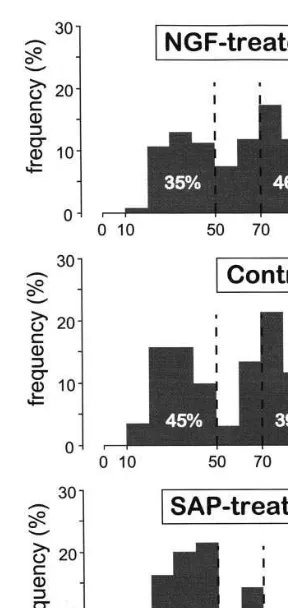
illustrated in Fig. 4. The effect of the treatment was higly significant (Kruskal – Wallis nonpara-metric test, PB0.001). The high frequencies val-ues (\70 Hz) were increased after NGF treatment and accounted for 46% of the distribu-tion. Conversely, the effect of 192 IgG-saporin was clear-cut towards the opposite direction, with predominant low frequencies (61% were less than 50 Hz) and few high frequencies.
Fig. 3. Bicoherence analysis across two channels. The bicoher-ence peaks (represented by circle) of phase coupled frequencies f1 and f2 are plotted for frequency ranges 7 – 100 Hz at a
resolution of 1 Hz. If pairs of frequences corresponding to significant non-linear interactions observed at distinct record-ing sites, coincided exactly the overlap, is graphically shown by bigger circles, whose radius is proportional to the number of overlapping points.
lated spectral envelopes (ripples) observed in this band. The ripple frequency in the controls was equal to 11 cycles per octave. NGF treatment slowed the ripple frequency down to nine cycles per octave but did not alter its amplitude (near 1 dB). Conversely, in the SAP-treated animals the amplitude of the ripples was reduced to 0.1 dB but its frequency remained the same as in controls.
For each recording site we selected up to ten phase-coupled frequencies f3=f1+f2
Fig. 4. Relative distribution of the non-linearly coupled fre-quencies f3=f1+f2 in the three groups of animals during
spontaneous activity. Bispectral and cross-bispectral results were pooled together. The bin size of the histogram is 10 Hz. Note the majority of frequencies higher than 70 Hz in NGF-treated animals compared with the frequencies lower than 50 Hz in SAP-treated rats.
fore, we assume that our manipulations allowed us to modify the acticity of BFCN and to study the effect of these projections on functional con-nectivity at the cortical level.
Some degree of synchronization between the activity of cortical units must exist in order to generate the relatively slow (up to 100 Hz) electric brain activity typical of LFPs (Elul, 1972). Each cortical neuron can be viewed as a generator contributing its fraction to the UP, hence this electric potential is the summed activity of all generators around the electrode tip. Different sites within the same cortical area can show various degrees of synchronous activity in the time do-main and of coupling of frequency components in the power spectra depending on the way, how information is processed. Far-away structures are expected to contribute some common pattern of waveform to all the recording sites. Such patterns could be generated by deep nuclei (e.g. the thala-mus, the basal forebrain) that spread their effect over large cortical areas. In addition, the summed activity of many seemingly uncorrelated local pro-cesses contributes to the LFP (Abeles, 1982). The detection of synchronous activity becomes difficult if the activity is organized in groups of neurons synchronized among each other, but with the activity of anyone such group that is uncorre-lated with that of any other group.
Signal analysis functions are subdivided into classes derived from their relationship with the statistical moments and cumulant series. Second order cumulant class includes correlation, power spectrum density and coherence. As second order cumulant statistics decompose the signal into a linear combination of mutually uncorrelated fre-quency components (Huber et al., 1971), they can be applied only to stationary Gaussian signals and are not used to detect signal components which are in non-linear, phase dependent, rela-tionships (Nikias and Raghuveer, 1987). Recent studies about the effect of NGF and 192 IgG-sa-porin on rat EEG (Holschneider et al., 1997, 1999) used these techniques and showed that de-creased ChAT activity was associated with in-crease in low frequency power, whereas inin-creased ChAT activity was positively correlated with b2
power. Our results show the same tendency but 4. Discussion
There-the frequency ranges appear to be shifted to higher values in our study with respect to the previously reported data (Holschneider et al., 1997, 1999). This difference could be due to the different type of signal (i.e. EEG) that was recorded on the scalp in those studies with com-parison to the LFP recorded directly inside the cerebral cortex.
Third order cumulant statistics are based on skewness. They can detect if the signal deviates from normality, i.e. is non-Gaussian (Brillinger, 1965; Huber et al., 1971; Nikias and Raghuveer, 1987). Third order cumulant analysis include the bicorrelation, the bispectrurn and the bicoher-ence. They keep the phase relationship between the signal components and thus can detect if some of them are non-linearly coupled. Bicoher-ence is a normalization method, which compares the actual bispectrurn with a zero phase bispec-trum, i.e. a bispectrum with the highest degree of phase coupling. It shows the degree of phase coupling between frequency components of one or more signals. In brain electric activity, such non-linearities would occur when two frequency components are in harmonic resonance or if two brain electric waves interact and generate a new energy component at a frequency which is the sum of the frequencies of its source components. Such particular second order coupling, called Quadratic Phase coupling, can be detected by third order spectral (i.e. bispectral) analysis be-cause the phase of the generated components is also the sum of the phase of its source compo-nents (Nikias and Raghuveer, 1987). This tech-nique was applied only in few experimental studies to EEG (Boeijinga and da Silva, 1989; Ning and Bronzino, 1993) and LFPs (Schanze and Eckhorn, 1997).
The phase couplings observed after NGF treat-ment tended to occur at frequencies higher than in controls, whereas phase couplings at high fre-quencies greatly decreased after 192 IgG-saporin treatment. Resonances occur as a result of inter-ference between waves traveling in different direc-tions that combine to form standing wave patterns (Nunez, 1995). This phenomenon re-quires that each neural mass has a relatively large number of synapses so that signals are transferred
between two locations in a time roughly propor-tional to the distance between the two locations. In one-dimensional standing waves, a spatial fre-quency corresponds to each frefre-quency of reso-nance. In multidimensional waves likely to be generated in a complex structure such as the cerebral cortex, the concept of spatial frequency is not precise but the general idea that high spa-tial frequencies correspond to high temporal fre-quencies is preserved (Nunez, 1995). Thus, the non-linear interactions occurring at high frequen-cies after NGF treatment suggest that resonance might be due to a spread of activity over a smaller area within the cortex. Conversely, the immunotoxin provoked a marked increase of non-linear interactions occurring at low frequen-cies, thus suggesting that resonance might be due to a spread of activity over a wider area within the cortex with respect to controls. These results extend previous reports based on coherence anal-ysis showing that cholinergic inputs affected pri-marily brain electrical transmission within, in contrast to between hemispheres (Holschneider et al., 1999).
Acknowledgements
We thank Abdellatif Najem and Jan Eriksson for their participation to some experimental ses-sions, David Brillinger for his advice to the method of data analysis and Christian Eriksson, Christian Haeberli, Michel Jade´ and Andre´ Singy for their technical assistance. This study was par-tially supported by European CHRX-CT93-0269, INTAS-OPEN 0168 and INTAS-OPEN 97-0173 and Swiss OFES 93.0241 grants.
References
Abeles, M., 1982. Local Cortical Circuits. Springer, Berlin. Boeijinga, P., da Silva, F.H.L., 1989. A new method to
estimate time delays between EEG signals applied to b
activity of the olfactory cortical areas. Electroencephalogr. Clin. Neurophysiol. 73, 198 – 205.
Brillinger, D.R., 1965. An introduction to polyspectra. Ann. Math. Stat. 36, 1351 – 1374.
Brillinger, D.R., Irizarry, R.A., 1998. An investigation of the second- and higher-order spectra of music. Signal Process-ing 65, 161 – 179.
Calissano, P., Cattaneo, A., Biocca, S., Aloe, L., Mercanti, D., Levi-Montalcini, R., 1984. The nerve growth factor, estab-lished findings and controversial aspects. Exp. Cell. Res. 154, 1 – 9.
Celesia, G.G., Jasper, H.H., 1966. Acetylcholine released from cerebral cortex in relation to state of activation. Neurology 16, 1053 – 1063.
Chen, S., Bentivoglio, M., 1993. Nerve growth factor receptor-containing cholinergic neurons of the basal forebrain pro-ject to the thalamic reticular nucleus in the rat. Brain Res. 606, 207 – 212.
Chiba, A.A., Bucci, D.J., Holland, P.C., Gallagher, M., 1995. Basal forebrain cholinergic lesions disrupt increments but not decrements in conditioned stimulus processing. J. Neu-rosci. 15, 7315 – 7322.
Coyle, J.T., Price, D.L., DeLong, M.R., 1983. Alzheimer’s disease: a disorder of cortical cholinergic innervation. Sci-ence 219, 1184 – 1190.
Davies, P., Maloney, A.J., 1976. Selective loss of central cholinergic neurons in Alzheimer’s disease. Lancet 2 (8000), 1403.
Dickson, C.T., Trepel, C., Bland, B.H., 1994. Extrinsic modu-lation of theta field activity in the enthorinal cortex of the anesthetized rat. Hippocampus 4, 37 – 51.
Elul, R., 1972. The genesis of eeg. Int. Rev. Neurobiol. 15, 227 – 272.
Fusco, M., Oderfeld-Nowak, B., Vantini, G., Schiavo, N., Gradkowska, M., Zaremba, M., Leon, A., 1989. Nerve growth factor affects uninjured adult rat hippocampal cholinergic neurons. Neuroscience 33, 47 – 52.
Fusco, M., Tria, M.A., Schiavo, N., Leon, A., Vantini, G., 1990. Nerve growth factor induces a marked and long-last-ing enhancement of choline acetyltransferase activity in septohippocampal neurons of uninjured adult rats. Neu-rosci. Res. Commun. 77, 97 – 103.
Gallagher, M., Colombo, P.J., 1995. Ageing: the cholinergic hypothesis of cognitive decline. Curr. Opin. Neurobiol. 5, 161 – 168.
Gibbs, R.B., Pfaff, D.W., 1994. In situ hybridization detection ofTrkAmRNA in brain: distribution, colocalization with p75NGFR and upregulation by nerve growth factor. J.
Comp. Neurol. 341, 324 – 339.
Growdon, J.H., 1997. Muscarinic agonists in Alzheimer’s dis-ease. Life Sci. 60, 993 – 998.
Holschneider, D.P., Leuchter, A.F.Y.N., Scremin, O.U., Trei-man, D.M., 1997. Changes in cortical EEG and cholinergic function in response to NGF in rats with nucleus basalis lesions. Brain Res. 765, 228 – 237.
Holschneider, D.P., Waite, J.J., Leuchter, A.F., Walton, N.Y., Scremin, O.U., 1999. Changes in electrocortical power and coherence in response to the selective cholinergic im-munotoxin 192 IgG-saporin. Exp. Brain Res. 126, 270 – 280.
Honegger, P., Lenoir, D., 1982. Nerve growth factor (NGF) stimulation of cholinergic telencephalic neurons in aggre-gating cell cultures. Dev. Brain Res. 3, 229 – 238. Huber, P.J., Kleiner, B., Gasser, T., Dumermuth, G., 1971.
Statistical methods for investigating phase relations in stationary stochastic processes. IEEE Trans. Audio Elec-troac. AU 19, 78 – 86.
Korsching, S., Auburger, G., Heumann, R., Scott, J., Thoe-nen, H., 1985. Levels of nerve growth factor and its mRNA in the central nervous system of the rat correlate with cholinergic innervation. EMBO J. 4, 1389 – 1393. Lamour, Y., Dutar, P., Jobert, A., 1982. Topographic
organi-zation of basal forebrain neurons projecting to the rat cerebral cortex. Neurosci. Lett. 34, 117 – 122.
Lii, K.S., Helland, K.N., 1981. Cross-bispectrum computation and variance estimation. ACM Trans. Math. Softw. 7, 284 – 294.
Lin, L., Georgievska, B., Mattsson, A., Isacson, O., 1999. Cognitive changes and modified processing of amyloid precursor protein in the cortical and hippocampal system after cholinergic synapse loss and muscarinic receptor acti-vation. Proc. Natl. Acad. Sci. USA 96, 12108 – 12113. Mesulam, M.M., Mufson, E.J., Wainer, B.H., Levey, A.I.,
1983. Central cholinergic pathways in the rat: an overview based on an alternative nomenclature (Chl – Ch6). Neuro-science 10, 1185 – 1201.
Nikias, C.L., Raghuveer, M.R., 1987. Bispectrum estimation: a digital signal processing framework. Proc. IEEE 75, 869 – 891.
Ning, T., Bronzino, J.D., 1993. Nonlinear analysis of the hippocampal subfields of CA1 and the dentate gyrus. IEEE Trans. Biomed. Eng. BM 40, 870 – 876.
Parent, A., Pare, D., Smith, Y., Steriade, M., 1988. Basal forebrain cholinergic and noncholinergic projections to the thalamus and brainstem in cats and monkeys. J. Comp. Neurol. 277, 281 – 301.
Rae-Grant, A., Blume, W., Lau, C., Hachinski, V.C., Fisman, M.H.H.M., 1987. The electroencephalogram in Alzheimer-type dementia. A sequential study correlating the elec-troencephalogram with psychometric and quantitative pathologic data. Arch. Neurol. 44, 50 – 54.
Rossner, S., Schliebs, R., Ha¨rtig, W., Bigl, V., 1995. 192 IgG-saporin-induced selective lesion of cholinergic basal forebrain system: neurochemical effects on cholinergic neu-rotransmission in rat cerebral cortex and hippocampus. Brain Res. Bull. 38, 371 – 381.
Rylett, R.J., Goddard, S., Schmidt, B.M., Williams, L.R., 1993. Acetylcholine synthesis and release following contin-uous intracerebral administration of NGF in adult and aged fischer-344 rats. J. Neurosci. 13, 3956 – 3963. Schanze, T., Eckhorn, R., 1997. Phase correlation among
rhythms present at different frequencies: spectral methods, application to microelectrode recordings from visual cortex and functional implications. Int. J. Psychophysiol. 26, 171 – 189.
Scinto, L.F., Daffner, K.R., Castro, L., Weintraub, S., Vavrik, M., Mesulam, M.M., 1994. Impairment of spatially di-rected attention in patients with probable Alzheimer’s dis-ease as measured by eye movements. Arch. Neurol. 51, 682 – 688.
Terry, R.D., Katzman, R., 1983. Senile dementia of the Alzheimer type. Ann. Neurol. 14, 497 – 506.
Thoenen, H., 1991. The changing scene of neurotrophic fac-tors. Trends Neurosci. 14, 165 – 170.
Vantini, G., Schiavo, N., Martino, A.D., Polato, P., Triban, C., Callegaro, L., Toffano, G., Leon, A., 1989. Evidence for a physiological role of nerve growth factor in the central nervous system of neonatal rats. Neuron 3, 267 – 273.
Villa, A.E.P., Bajo, V.M., Vantini, G., 1996. Nerve growth factor (ngf) modulates information processing in the audi-tory thalamus. Brain Res. Bull. 39, 139 – 147.
Villa, A.E.P., Tetko, I., Dutoit, P., de Ribaupierre, Y., de Ribaupierre, F., 1999. Corticofugal modulation of func-tional connectivity within the auditory thalamus of rat, guinea pig and cat revealed by cooling deactivation. J. Neurosci. Meth. 86, 161 – 178.
Whishaw, I.Q., O’Connor, W.T., Dunnett, S.B., 1985. Disrup-tion of central cholinergic systems in the rat by basal forebrain lesions or atropine: effects on feeding, sensorimo-tor behavior, locomosensorimo-tor activity and spatial navigation. Behav. Brain Res. 17, 103 – 115.
Wiley, R.G., 1992. Neural lesioning with ribosome-inactivat-ing proteins: suicide transport and immunolesionribosome-inactivat-ing. Trends Neurosci. 15, 285 – 290.
Williams, L.R., Varon, S., Peterson, G.M., Wictorin, K., Fischer, W., Bjorklund, A., Gage, F., 1986. Continuous infusion of nerve growth factor prevents basal forebrain neuronal death after fimbria fornix transection. Proc. Natl. Acad. Sci. USA 83, 9231 – 9235.