Vol. 18 No. 3 Desember 2011
Abstrak
Dalam rangka pengembangan korelasi antara kecepatan rambat gelombang geser vs dan tahanan penetrasi
standar N-SPT untuk tanah Indonesia, hasil dari uji penetrasi standar dan uji seismic downhole dari tiga lokasi di daerah Jakarta dikumpulkan dan dianalisis. Fokus dari makalah ini adalah tanah tersementasi. Hasil dari kedua jenis pengujian digunakan untuk mengembangkan korelasi vs – N-SPT. Korelasi tersebut kemudian
dibandingkan dengan korelasi yang terdapat di dalam literatur.
Kata-kata Kunci: Kecepatan rambat gelombang geser, uji penetrasi standar, tanah tersementasi.
Abstract
To initiate the development of shear-wave velocity vs and standard penetration resistance N-SPT correlations of
soils from Indonesia, the results of standard penetration tests and seismic down hole tests from three locations in Jakarta area are compiled and analyzed. The focus of the present paper is on cemented soils. The results of the tests are used to develop a vs – N-SPT correlation. The results and the associated correlation are then compared
to existing correlations available in the literature.
Keywords: Shear-wave velocity, standard penetration test, cemented soils.
Technical Notes
Shear-Wave Velocity of Cemented Soils of Jakarta
Widjojo A. Prakoso
Civil Engineering Department, Universitas Indonesia, Depok 16424, E-mail: [email protected] Jurnal Teoretis dan Terapan Bidang Rekayasa Sipil
Jurnal Teoretis dan Terapan Bidang Rekayasa Sipil
1. Introduction
The shear-wave velocity of soils plays an important role in the design of geotechnical structures under dynamic loads. It is used mostly for determining the seismic site categories (e.g., BSN 2002) and for an ini-tial reference value for large strain problems related to seismic loading. In Indonesia, the shear-wave velocity is typically measured using the seismic down hole test and multi-channel analysis of surface waves (MASW) test. However, the equipment is not widely available and, consequently, the test is generally too expensive to perform for most construction projects. On the other hand, the standard penetration test method (SPT) is one of the most common in-situ tests because its equipment is widely available and it is easy to perform.
A study to develop correlations among penetration test results and shear-wave velocity for soils from Indonesia is currently being conducted. Prakoso (2010) proposes a correlation between the resistance obtained from cone penetration tests (CPT) and shear-wave velocity. This present paper focuses on the develop-ment of a correlation between the resistance obtained from SPT and shear-wave velocity for cemented soils from Jakarta area. The database of the two parameters and the analysis conducted are described, followed by a discussion on the proposed correlation.
2. Test Program
The test program considered in this study was conducted in three locations; in each location a series of standard penetration tests and a series of shear-wave velocity measurements performed using the seismic down hole test method were conducted in one bore-hole. The locations were in Tanjung Priok area, Universitas Indonesia Depok campus, and MH Thamrin street area.
The SPT was performed in accordance with ASTM D1586 (2008). The SPT was performed by dropping a 623 N, cable-hoisted, donut hammer a distance of 760 mm to impact the top of the sampling rods. The blows required to drive the 51 mm diameter split spoon sampler for each of three 150 mm intervals were counted. The N-SPT value is the sum of the number of blows required to drive the sampler through the second and third intervals.
coupling spikes developed by the Geophysics Laboratory of Universitas Indonesia.
3. Test Results
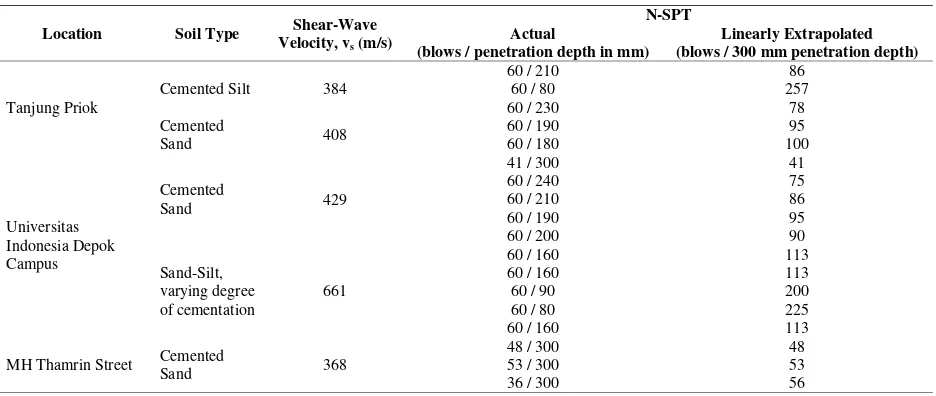
3.1 Location: Tanjung Priok
The soil descriptions, shear-wave velocity vs, and
N-SPT values from the borehole in Tanjung Priok area are shown in Figure 1. Cemented soils were found at depth ranges of 17.0 m to 22.0 m and 25.0 m to 28.0 m. For the first depth range, the vs was interpreted as 384
m/s, and the N-SPT values varied from 60 blows for 230 mm penetration to 60 blows for 70 mm penetra-tion. For the second depth range, the vs was interpreted
as 408 m/s, and the N-SPT values varied from 60 blows for 190 mm penetration to 60 blows for 180 mm pene-tration. Further discussion on this location can be found in Prakoso et al. (2011).
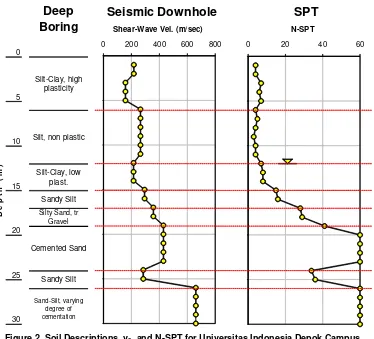
3.2 Location: Universitas Indonesia Depok Campus
The soil descriptions, N-SPT values, and shear-wave velocity vs from the borehole in Universitas Indonesia
Depok campus are shown in Figure 2. Cemented soils were found at depth ranges of 19.0 m to 25.0 m and 26.0 m to 30.5 m (end of boring). For the first depth range, the vs was interpreted as 429 m/s, and the N-SPT
values varied from 41 blows/0.3m to 60 blows for 190 mm penetration. For the second depth range, the vs was
interpreted as 661 m/s, and the N-SPT values varied from 60 blows for 160 mm penetration to 60 blows for 80 mm penetration. Further discussion on this location can be found in Prakoso et al. (2011).
3.3 Location: MH Thamrin Street
The soil descriptions, N-SPT values, and shear-wave velocity vs from the borehole in MH Thamrin street
area are shown in Figure 3. Cemented soils were found at a depth range of 25.0 m to 31.0 m. The vs was
inter-preted as 368 m/s, and the N-SPT values varied from 36 blows/0.3m to 53/0.3m.
4. Correlation Development and Discussion
The database of cemented soils described above con-sists of only eighteen (18) pairs of shear-wave velocity, vs and N-SPT value. The vs varied from 368 m/s to 661
m/s, and the N-SPT values varied from 36 blows/0.3m to 60 blows for 70 mm penetration; all data are summarized in Table 1. It is noted that, following the approach proposed by Sun et al. (2008), in the case of N-SPT value 60 blows for penetration depth less than 300 mm, the N-SPT values were extrapolated linearly into corresponding 300 mm penetration depth. The database was then compared to the available vs –
N-SPT databases and correlations available in the literature; there are only four (4) vs – N-SPT
correlations clearly developed by including N-SPT values greater than 50 blows/0.3 m. Those correlations are as follows:
vs = 97.0 (N-SPT)0.314
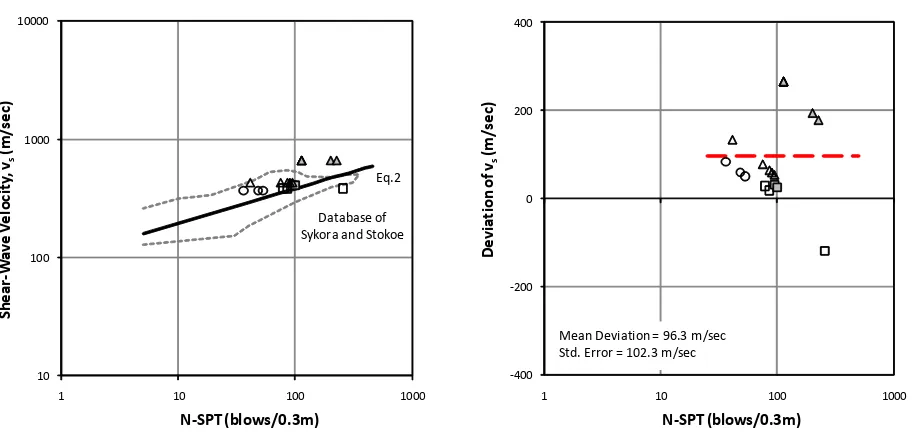
Figure 4a compares the present database to the database of Imai and Tonouchi 1982 (in Hasancebi and Ulusay 2007); both databases are in the same general range. Figure 4b shows the deviation of the present database to the correlation of Imai and Tonouchi 1982 (Equation 1). The present database tends to be greater than their correlation; the mean deviation is 66.9 m/s, and the standard error is 103.9 m/s. Figure 5a compares the present database to the database of Sykora and Stokoe 1983 (in Hasancebi and Ulusay 2007); both databases again are in the same general range. Figure 5b shows the deviation of the present database to the correlation of Sykora and Stokoe 1983 (Equation 2). The present database tends to be greater than their correlation; the mean deviation is 96.3 m/s, and the standard error is 103.9 m/s.
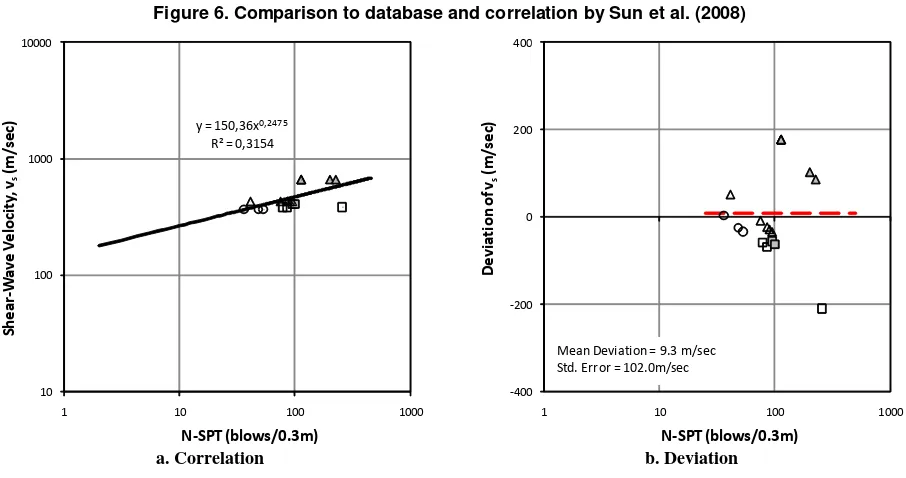
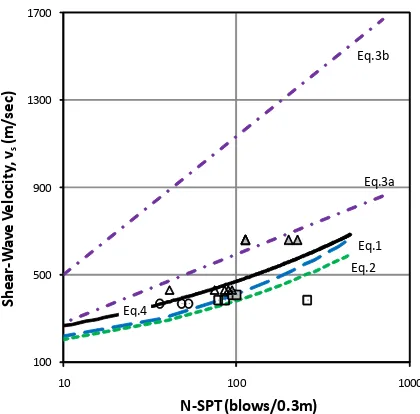
Figure 6a compares the present database to the database of Sun et al. (2008); both databases are in the same general range. Figure 6b shows the deviation of the present database to the correlation for sandy weathered residual soils (Equation 3). The present database tends to be greater than this correlation; the mean deviation is 60.4 m/s. and the standard error is 104.3 m/s. Figure 6c shows the deviation of the present database to the correlation for sandy weathered rocks (Equation 2). The present database tends to be less than this correlation; the mean deviation is -258.1 m/s, and the standard error is 146.4 m/s.
A simple regression analysis was subsequently performed, taking the shear-wave velocity vs as the
dependent parameter and the N-SPT values as the independent parameter. As also shown in Figure 7, the following correlation has been derived for cemented soils of Jakarta:
Vol. 18 No. 3 Desember 2011
Figure 1. Soil Descriptions, vs, and N-SPT for Tanjung Priok
Location Soil Type Shear-Wave Velocity, vs (m/s)
N-SPT Actual
(blows / penetration depth in mm)
Linearly Extrapolated (blows / 300 mm penetration depth)
Tanjung Priok
Cemented Silt 384
60 / 210 86
MH Thamrin Street Cemented
Sand 368
48 / 300 48 53 / 300 53 36 / 300 56
Table 1. Summary of all data
in which vs in m/s and N-SPT in blows/0.3m, and the
standard error is 102.0 m/s. The r2 value is 0.315; this value is low, suggesting that a better correlation should be developed in the future. In addition to the low r2 value, it is noted that the two measured parameters are inherently different, and the linear extrapolation approach for the N-SPT value carries an additional uncertainty. In conclusion, the nature of the proposed vs – N-SPT correlation is approximate, and it
should be used for rough estimates of vs for
preliminary studies and/or noncritical projects.
0
Sand-Silt, varying degree of cementation
30 25
Sandy Silt 20
Cemented Sand Sandy Silt
Silty Sand, tr Gravel
Silt-Clay, low plast. 15
10 5
D e
p
t h
( m
)
Silt-Clay, high plasticity
Silt, non plastic
Deep
Boring
SPT
Seismic Downhole
0 20 40 60
N-SPT
0 200 400 600 800
Shear-Wave Vel. (m/sec)
Figure 2. Soil Descriptions, vs, and N-SPT for Universitas Indonesia Depok Campus
0
Silt, clayey non-plast
40
Silt-Clay, high plast. 35
Cemented Sand 30
Sandy Silt
25
Silt-Clay, high plast. 15
20 5
Silty Sand
D
e p t
h
( m
)
Fill Material
10
Deep Boring
SPT Seismic Downhole
0 20 40 60
N-SPT
0 200 400 600 800
Shear-Wave Vel. (m/sec)
Vol. 18 No. 3 Desember 2011 Imai & Tonouchi
Eq.1
a. Database and correlation (Equation 1) b. Deviation of present data to Equation 1
Figure 4. Comparison to database and correlation by Imai and Tonouchi (1982)
Sykora and Stokoe
Eq.2
Figure 5. Comparison to database and correlation by Sykora and Stokoe (1983)
a. Database and correlation (Equation 2) b. Deviation of present data to Equation 2
5. Conclusions
1. Shear-wave velocity vs and standard penetration
resistance N-SPT data of cemented soils from three locations in Jakarta area were evaluated.
2. Though limited in number, the present database is within ranges of existing databases available in the literature.
3. Based on the results, a simple regression equation correlating measured N-SPT to vs for cemented
soils was developed. From comparisons to existing correlations, the proposed correlation appears to be
greater than existing ones for soils. The proposed vs – N-SPT correlation can be used for rough
estimates of vs, particularly for preliminary studies
and/or noncritical projects are under consideration.
6. Acknowledgment
a. Database and correlation (Equations 3 and 4)
‐400
b. Deviation of present data to Equation 3
‐800
Mean Deviation = ‐258.1 m/sec Std. Error = 146.4 m/sec
c. Deviation of present data to Equation 4
Figure 6. Comparison to database and correlation by Sun et al. (2008)
a. Correlation b. Deviation
Vol. 18 No. 3 Desember 2011
References
American Society for Testing and Materials, 2008, Standard Test Method for Penetration Test and Split-Barrel Sampling of Soils (D1586), Philadelphia: Annual Book of Standards, Vol. 04.08, ASTM.
American Society for Testing and Materials, 2008, Standard Test Methods for Downhole Seismic Testing (D7400), Philadelphia: Annual Book of Standards, Vol. 04.08, ASTM.
Badan Standarisasi Nasional (BSN), 2002, Standar Perencanaan Ketahanan Gempa Untuk Struktur Gedung, 62 p.
Hasancebi, N. and Ulusay, R., 2007, Empirical correlations between shear-wave velocity and penetration resistance for ground shaking assessments, Bulletin of Engineering Geology and Environmental 66:203-213.
Prakoso, W.A., 2010, Development of qc – vs
correlation for Depok silt-clay. Jurnal Teknik Sipil ITB 17 (3) : 205-210.
100 500 900 1300 1700
10 100 1000
Sh
e
a
r
‐
Wa
v
e
V
e
lo
city
,
vs
(m
/s
e
c)
N‐SPT (blows/0.3m)
Eq.3b
Eq.3a
Eq.2 Eq.1
Eq.4