111
POWER AND SIZE OF NORMAL DISTRIBUTION AND ITS APPLICATIONS
Budi Pratikno
Department of Mathematics, Faculty Mathematics and Natural Sciences Jenderal Soedirman University
Jajang
Department of Mathematics, Faculty Mathematics and Natural Sciences Jenderal Soedirman University
Setianingsih
Department of Mathematics, Faculty Mathematics and Natural Sciences Jenderal Soedirman University
R. Sudarwo
Open University, UPBJJ-UT, Purwokerto, Indonesia
ABSTRACT. The research studied power and size of normal distribution and its applications on linear regression model. The power and size formulas are derived, and the unrestricted test (UT), restrcited test (RT) and pre-test test (PTT) are used. The recommendation of the test is given by choosing maximum power and minimum size, and also graphical analysis. The result showed that the power and size for large standard deviation ( ) tend to be identical and flat. In simulation study, the graphs of the UT, RT, and PTT are still similar to the previous research (Pratikno, 2012), where the PTT tend to lie between UT and RT.
Keyword: power, linear regression model, and size.
ABSTRAK. Riset ini mengkaji power dan size distribusi normal dan aplikasinya pada
model regresi linier. Formula power dan size diturunkan, dan unrestricted test (UT), restrcited test (RT) dan pre-test test (PTT) digunakan. Rekomendasi uji tersebut diberikan dengan memilih power maksimum dan size minimum, dan juga analisis grafik. Hasilnya menunjukkan bahwa power and size untuk simpangan baku besar ( ) cenderung identik dan mendatar. Dalam kajian simulasi, grafik UT, RT, dan PTT masih mirip dengan riset sebelumnya (Pratikno, 2012), di mana PTT cenderung berada di antara UT dan PTT.
1. Introduction
Normal distribution is often called as Gaussian distribution. The
probability density function (pdf) of variabel random X with parameter mean ( )
and variance (2
To compute the pdf and cumulativie distribution function (cdf) in the equation (1),
R-code is used. Due to this difficulties, here, the values of the power for rejecting
null hypothesis (H0) under alternatif hypothesis (H1) is also computed using
R-code.
The power and size in term of univariate normal distribution havel already
studied by many authors, such as Pratikno (2012), Khan (2005) and Yunus
(2010). Moreover, Pratikno (2012) used the power to compute the values of the
power of the tests: unrestricted test (UT), restricted test (RT) and pre-test test
(PTT) in testing intercept using non-sample prior information (NSPI) on model
regression linear model. Many authors have already contributed in developing this
research area especially in estimation area, such as Khan (2005, 2008), Khan and
Saleh (1997, 2005, 2008), Khan and Hoque (2003), and Saleh (2006).
The values of the power and size are very significance criteria in testing
UT, RT and pre-test test (PTT) on regression model (RM). Therefore, we used
power and size to test UT, RT dan PTT by choosing maximum power and
minimum size of them. Furthermore, this research is focused to derive fromula of
the power and size of the normal distribution and compute them using R-code. To
more clear, we also did graphical analysis of the power and size the UT, RT and
PTT.
The research presented the introduction in Section 1. The reconstruction of
the power and size formula of the normal distribution are given in Section 2. A
simulation study and their (power and size) applications on the multivariate
simple regression model (MSRM) model are presented in Section 3, and Section 4
2. Power and Size Normal Distribution
Cummulative distribution function (cdf) of the normal distribution with
parameter and for and random vaiable X is given as
To compute the equation (2), R-code is used. This is due to the probability integral
of the cdf of the equation (2) is difficult. Here, we need numerical analysis and
theory of the Maclourin series. To compute the values of the power and size for
two-side hypothesis versus , the cdf is used. The power
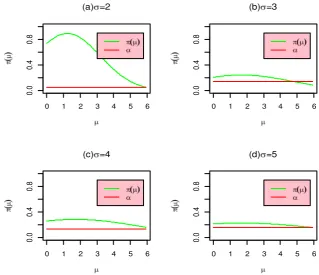
(π(µ)) and size (α ) formulas are then given as, respectively,
Similarly, the value of the size under H0 for is 0,1609764. Furthermore,
0 1 2 3 4 5 6
Figure 1. The graphs of power and size of the normal distribution for some selected
Figure 1. showed that the power tend to be close to size for to 6,
on and when the values of the increases. The graphs are similar
to the curve of the normal distribution, i.e. the curve tend to be leptocurtic for
large the , and they will be flat for small the .
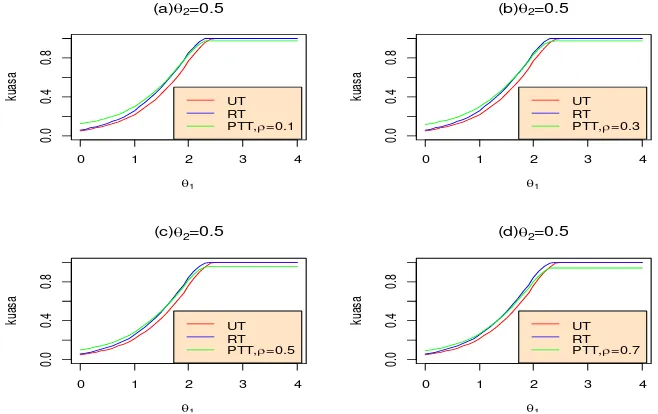
3. A Simulation Study of the Power dan Size on Generate Data
Following Pratikno (2012), then the power and size of the UT, RT and
PTT on multivariate simple regression model (MSRM) for 4 dependent variables,
namely , , and , with level of
significance 0,05 in two-side hypothesis H0:0i 0 versus H0:0i 0, the
0 1 2 3 4
From Figure 2., we see that PTT lies between UT and RT, it means the PTT
can be an alternative choice of the test. In the contect of maksimum power, the
PTT still follows the previous research, Pratikno (2012). Similarly, we also got
that the alternative choice of the mminimu size of under H0.
4. Conclusion
identical and flat. In simulation study, the graphs of the UT, RT, and PTT are still
similar to the previous research, i.e. the PTT tend to lie between UT and RT.
References
Khan, S., Estimation of Parameters of The Multivariate Regression Model with
Uncertain Prior Information and Student-t Errors, Journal of Statistical
Khan, S., Shrinkage Estimators of Intercept Parameters of Two Simple
Regression Models with Suspected Equal Slopes, Communications in
Statistics-Theory and Methods, 37 (2008), 247-260.
Khan, S. and Saleh, A. K. Md. E., Shrinkage Pre-test Estimator of The Intercept
Parameter for A Regression Model with Multivariate Student-t Errors,
Biometrical Journal, 39 (1997), 1-17.
Khan, S. and Hoque, Z., Preliminary Test Estimators for The Multivariate Normal
Mean Based on The Modified W, LR and LM Tests, Journal of Statistical
Research, 37 (2003), 43-55.
Khan, S. and Saleh, A. K. Md. E., Estimation of Intercept Parameter for Linear
Regression with Uncertain Non-Sample Prior Information, Statistical
Papers, 46 (2005), 379-394.
Khan, S. and Saleh, A. K. Md. E., Estimation of Slope for Linear Regression
Model with Uncertain Prior Information and Student-t Error,
Communications in Statistics-Theory and Methods, 37(16) (2008),
2564-2581.
Pratikno, B., Tests of Hypothesis for Linear Regression Models with Non Sample
Prior Information, Dissertation, University of Southern Queensland,
Australia, 2012.
Saleh, A. K. Md. E., Theory of Preliminary Test and Stein-Type Estimation with
Applications, John Wiley and Sons, Inc., New Jersey, 2006.
Yunus., R. M., Increasing Power of M-test through Pre-testing, Unpublished