The Effect Structure of Assets, Liquidity, Firm Size and Profitability of
Capital Structure (Empirical Study on Manufacturing Companies Listed
on Indonesia Stock Exchange)
Nur Indah Kartika Saria, Kartika Hendra Titisarib, Siti Nurlaelab
a
College Student, Study Program : Economic Accounting. Surakarta, Central Java 57147, Indonesia b
Faculty of Economics. Islamic University of Batik, Surakarta, Central Java 57147, Indonesia e-mail: [email protected]
Abstract: This study aimed to examine the effect structure of asset, liquidity, firm size, and profitability of capital structure at manufacturing companies listed on Indonesia Stock Exchange. This study uses secondary data, which is data obtained from
Indonesian Capital Market Directory 2015 (ICMD 2015), with purposive sampling
method obtained as many as 156 samples of the company during 2014 and 2015. Data analysis technique used is multiple linear regression analysis. The results of descriptive analysis indicate that the structure of assets, firm size and profitability does not affect the capital structure. Meanwhile, if seen from the significance of liquidity variables affect the capital structure significantly. The results of this study indicate that (1) there are variables of asset structure and firm size that have no effect on capital structure (2) liquidity variables and profitability affecting capital structure, (3) structure of asset, liquidity, firm size, and profitability effect on DER while 41,3% influenced by other factor not examined in this research.
Keywords: Structure of Asset, Liquidity, Firm Size, Profitability, and Capital Structure.
1. INTRODUCTION
Basically the company needs funds to run its business. Riyanto (2001) states that the fulfilment of these funds comes from internal sources (internal source)
and from external sources (external source). The capital of the creditor is a debt to the company concerned which is often referred to as foreign capital. Therefore, every financial manager needs to determine the decision of capital structure that is related to determining whether the company's fund needs are met with their own capital or foreign capital. The capital structure itself is the proportion of usage between debt and equity. Management as a company
manager must be able to balance the use of debt and equity to achieve optimal capital structure. In realizing the optimal capital structure, financial managers must consider many things that affect the capital structure. Factors that can affect the capital structure conducted in this study include the structure of assets, liquidity, firm size, and profitability.
Research on the influence of capital structure has been done both in Indonesia and abroad. Research Rahmawati, et al (2017) shows that the structure of assets, liquidity, and size of the company have a positive and significant impact on the capital structure of the company. While profitability has a significant negative
effect on capital structure of the company. While profitability variable has no significant effect to capital structure. Suhendra (2014) found asset structure and liquidity with significant negative correlation to capital structure. While firm size, and profitability have no significant effect on capital structure. Ahmad, et al (2017) showed empirical asset structure and firm size have a positive and significant effect on capital structure, while liquidity and profitability have negative and significant effect to capital structure. Rambe & Putry (2017) presents empirical evidence of Asset Structure and Return on Assets has significant influence on capital structure while Current Ratio and Firm Size have
no effect on capital structure in the future. Research Marfuah & Nurlaela (2017) the results show that firm size variables significantly influence the capital structure while profitability has significant effect on capital structure. Sari, et al (2015) shows that the structure of assets and firm size have a positive effect on capital structure, while profitability has a negative effect on capital structure. Research Yoshendy, et al (2015) showed a significant positive relationship between asset structure and capital structure, while profitability variable has no effect on capital structure. Kanita (2014) finds the asset structure has no significant effect on capital structure, while profitability has a significant influence on capital structure. Mikrawardhana, et al (2015) shows liquidity and profitability have a significant influence on capital structure.
Based on previous empirical results that are still contradictory and varied in
measuring the factors that affect the capital structure and the importance of this concept in influencing company policy in shaping investor confidence. In addition, this research is conducted on manufacturing companies for two periods, namely 2014 and 2015 which is a company with large-scale production or has a large trading volume and requires capital or large funds also to develop products that will affect the capital structure or funding a company. Thus , the purpose of this study is to determine the effect of asset structure, liquidity, firm size, and profitability of capital structure.
2. RESEARCH METHOD
Data used in this study using quantitative secondary data obtained from the manufacturing company's financial statements listed on Indonesia Stock Exchange year period 2014-2015 was obtained through ICMD (Indonesian Capital Market Directory) or site (www.idx.co.id). The sample is chosen by
purposive sampling method of judgment sampling amounted to 156 manufacturing companies for two periods according to the criteria used in this study.
2.1 RESEARCH VARIABLES AND MEASUREMENT
b. The independent variable is the variable that influences the incidence of the dependent variable. The independent variables used in this study are as follows:
1) Asset Structure, according to asset structure can be calculated by Weston, et al (1997) the formula:
2) The main liquidity is
Current Ratio which can be calculated by the formula :
3) Company size, according to Sheikh & Wang (2011), can be calculated by the formula :
4) Profitability, according to Sheikh & Wang (2011), can be calculated by the formula:
2.2 DATA ANALYSIS METHOD a. Descriptive statistical
analysis
Descriptive statistical analysis provides an overview or description of the dependent variable and the independent variables of mean value (mean), standard deviation, maximum value, and minimum value.
b. Classic assumption test 1) Normality test
Normality test using
Kolmogorov-Smirnov test (KS
test) using statistical program aid.
2) Multicollinearity Test
The multicollinearity test identifies statistically to indicate whether or not multicollinearity symptoms can be performed by looking at the VIF (Variance Inflation
Factor) value. Indication of multicollinearity is if VIF more than 10. Conversely if VIF value less than 10, hence not happened multicollinearity.
3) Autocorrelation Test
The autocorrelation test is used to determine whether in a linear regression model there is a correlation between errors in period t and period t-1. Detection of whether or not autocorrelation can be done in various ways one of them by using Durbin-Watson.
4) Heteroscedasticity Test
Examine the presence or absence of heteroscedasticity using the glejser test, by regressing the residual absolute value of the independent variable. If the probability of significance is above the 5% confidence level, then it does not contain heteroscedasticity.
c. Multiple Linear Regression Test Analysis
analysis is to know the direction of relationship between independent variable with dependent variable. The model of multiple linear regression equation is:
DER = α + β1SA + β2CR + β3 SIZE + β4ROA + e
Information :
DER = Debt to Equity Ratio
α = Constants SA = Asset
Structure
CR = Current Ratio
SIZE = Company Size
ROA = Return On Asset
β1, β2, β3, β4 =
Regression Coefficient
e = Error Term d. Hypothesis Test (t test)
T test is used to find out how far the influence of independent variable (X) to dependent variable (Y). Hypothesis testing will be done by using a significance level of 0.05 (a = 5%).
3 RESULT AND DISCUSSION
Pursuant to purposive sampling method, the sample obtained counted 78 company manufacturing thereafter in Indonesia Stock Exchange in the period 2014-2015, so the data obtained as much as 156.
3.1 Analysis Descriptive Statistics Table 1. Descriptive Statistics
Min. Max. Mean
Std. Deviation
Constant
DER 0,07 7,99 1,0415 1,05410 SA 0,04 1,14 0,3654 0,18380 CR 45,03
1335,0 0
267,900
7 243,70606 SIZE 5,13 8,39 6,3468 0,71998 ROA 0,04 40,18 7,9360 7 ,90049
Based on table above, The Capital Structure (DER) has a minimum value of 0,07 and a maximum value of 7,99. an average value of 1,0415 and a standard deviation of 1,05410. The Asset Structure variable (SA) has a minimum value of 0,04 and a maximum value of 1,14, the average value of 0,3654 and the standard deviation of 0,18380. The Liquidity Variable (CR) has a minimum value of 45,03 and max value of um 1335,00 the average value of 267,9007 and a standard deviation of 243,70606. Variable Company Size (SIZE) has a minimum value of 5,13 and a maximum value of 8,39 average value of 6, 3468 and standard deviation of 0,71998. The Profitability (ROA) variable has a minimum value of 0,04 and a maximum value of 40,18 average value of 7,9360 and standard deviation of 7,90049.
3.2 Research Result Classic Assumption Test Normality test
Variables Sig Std Conclusion Unstandardized
Residual
0.240 > 0.05 Normal Distribution
Table 2.Normality Test ( Kolmogorov-Smirnov)
From the above table it can be seen that the value of Kolmogorov Smirnov
(KS) significance is 0.240, meaning that the value is greater than 0.05 which means that the data is normally distributed.
Multicollinearity Test
The multicollinearity test identifies statistically to indicate whether or not multicollinearity symptoms can be performed by looking at the VIF (Variance Inflation Factor) value. Indication of multicollinearity is if VIF more than 10. Conversely if VIF value less than 10, hence not happened multicollinearity.
Variables
Collinearity Statistics
Conclusion Toleranc
e VIF
SA 0.763 1,311 There is no multicollinearity CR 0.743 1.347 There is no
multicollinearity SIZE .898 1,114 There is no
multicollinearity ROA 0.913 1.095 There is no
multicollinearity
Table 3.Multicollinearity test
Based on the multicollinearity test in the above table, the results show that all independent variables have VIF value ≤ 10, so it can be concluded that the regression model in this study did not occur multicollinearity and regression model is feasible to use.
Autocorrelation Test
The autocorrelation test is used to determine whether in a linear regression model
there is a correlation between errors in period t and period t-1. Detection of whether or not autocorrelation can be done in various ways one of them by using Durbin-Watson.
Model Durbin
Watson Conclusion
1 2,069 No
autocorrelation
Table 4.Autocorrelation test
From the table above can be seen the calculation of Durbin-Watson value of 2.069 which means the value between the values 1.55 to 2.46 this indicates no autocorrelation.
Heteroscedasticity Test
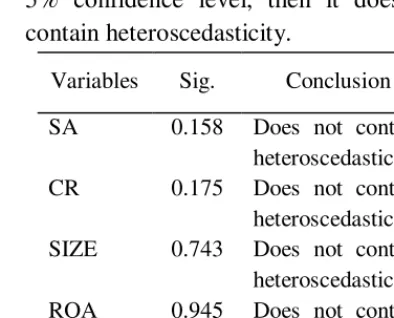
Examine the presence or absence of heteroscedasticity using the glejser test, ie by regressing the residual absolute value of the independent variable. If the probability of significance is above the 5% confidence level, then it does not contain heteroscedasticity.
Variables Sig. Conclusion
SA 0.158 Does not contain heteroscedasticity CR 0.175 Does not contain heteroscedasticity SIZE 0.743 Does not contain heteroscedasticity ROA 0.945 Does not contain heteroscedasticity
Table 5.Heteroscedasticity Test
shows that all independent variables have significance value > 0,05. So it can be concluded that the regression model does not contain heteroscedasticity.
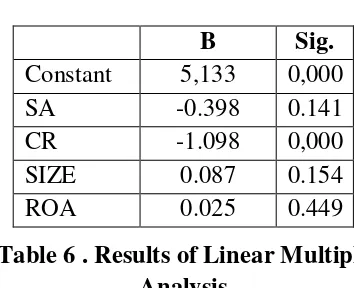
Multiple Linear Analysis Method Multiple linear regression analysis is a linear relationship between two or more independent variables with the dependent variable. This analysis is to know the direction of relationship between independent variable with dependent variable.
B Sig. Constant 5,133 0,000 SA -0.398 0.141 CR -1.098 0,000 SIZE 0.087 0.154 ROA 0.025 0.449
Table 6 . Results of Linear Multiple Analysis
Thus, the model of multiple linear regression equations is: DER = 0,095 – 0,014 SA – 0,003 CR + 0,063 SIZE – 0,016 ROA
a. Constant value of 0,095 which states that the structure of assets, liquidity, firm size, and profitability of capital structure, then the average magnitude of the policy is 0,095.
b. Asset structure variable has regression coefficient with negative direction equal to -0,014. It is related that any increase of one percent of the variable structure of the assets will cause the variable capital structure decreased by -0,014 percent.
c. Liquidity variable has regression coefficient with negative direction of -0,003. It is related that any increase of
one percent of the liquidity variable will cause the variable capital structure decreased by -0,003 percent. d. Firm size variable has regression
coefficient with positive direction equal to 0,063. It is related that every one percent increase then the capital structure will increase by 0,063 percent.
e. Profitability variable has regression coefficient with positive direction equal to -0,016. It is related that any increase of one percent of the variable profitability will cause the variable capital structure decreased by -0,016 percent.
Model Feasibility Test (F Test)
Model Feasibility Test (F Test) is used to determine whether all independent or independent variables included in the model have a mutual influence on the dependent or dependent variable.
Variables F
count F table Sig. Std Conclusion
1 55,999 1,36 0,000 <0,05 Decent Model
Table 7. Model Feasibility Test (F Test)
Hypothesis Test (t test)
Variables t count t table Sig. Std Information
SA -0.141 1.655 0.888 0.05 H1 is rejected
CR -12.194 1.655 0,000 0.05 H2 accepted
SIZE 0.926 1.655 0.356 0.05 H3 rejected ROA -2,561 1.655 0.011 0.05 H4 accepted
Table 8. Hypothesis Test (t test)
1) The structure of assets affects the capital structure.
Based on the table of multiple linear regression test results obtained regression coefficient value of -0,014. Asset structure variable has t count equal to -0,141 < t table equal to 1,655 with significance equal to 0,888 > 0,05. Then it can be concluded that the structure of assets does not affect the capital structure, so the first hypothesis is
rejected.
2) Liquidity (CR) has an effect on capital structure.
Based on the table of multiple linear regression test results obtained regression coefficient value of -0.003. Liquidity variable has t count equal to -12,194 < t table equal to 1,655 with significance equal to 0,000 < 0,05. Then it can be concluded that liquidity affect the capital structure, so the second hypothesis
accepted.
3) Company size (SIZE) affect the capital structure.
Based on the results table of multiple linear regression test obtained regression coefficient value of 0,063. Variable size of company have t count equal to 0,926 < t table equal to 1,665 with significance
equal to 0,356 > 0,05. Then it can be concluded that the size of the company does not affect the capital structure, so the third hypothesis is rejected.
4) Profitability (ROA) affect the capital structure.
Based on the results table of multiple linear regression test obtained regression coefficient value of -0,016. Profitability variable has t count equal to -2,561 < t table equal to 1,665 with significance equal to 0,011 < 0,05. Then it can be concluded that profitability affect the capital structure, so the fourth hypothesis is accepted.
Test Coefficient of determination (R²) The coefficient of determination (R²) essentially measures the extent of the model's ability to explain the variation of the dependent variable.
Model R Square Adjusted R Square
Regression 0.597 0.587
Table 9. Determination Coefficient Test
influenced by the structure of assets, liquidity, firm size, and profitability of 58.7%, while the remaining 41.3% is influenced by other factors not examined in this study.
3.3 Discussion
a. Influence of Asset Structure to Capital Structure
The result of static analysis shows that the asset structure has no effect on capital structure. This shows the higher the company's asset structure, the company will tend to reduce the use of external funding company. The use of external funding sources or debt is only used when internal funding is insufficient. In accordance with pecking order theory , companies with high profits will tend to use their internal funds first to meet the needs of the company, because internal funds are cheaper than external funds. The results of this study are in line with Kanita (2014) which states that the asset structure has no significant effect on capital structure. But contrary to the research Rahmawati, et al (2017) states that the structure of assets affect the capital structure. b. Influence Liquidity to Capital
Structure
The result of static analysis shows that liquidity effect on capital structure.
Appropriate Pecking Order Theory stating that the company would prefer to use internal funding by using its current assets to meet its funding needs. So companies that have a high level of liquidity tend to choose the funding that comes from internal funds of the company first before using financing originating from external form of debt.
The results of this study are in line with Suhendra (2014), Mikrawardhana, et al (2015), and Ahmad, et al (2017) which states that liquidity affects the capital structure. But contrary to the research Yoshendy, et al (2015) and Rambe, et al (2017) stated that liquidity has no significant effect on capital structure.
c. The Influence of Company Size on Capital Structure
small, will use a more secure source of funding first (funding internally) instead of using external sources of funds. In addition, supported by unstable economic conditions, each company has its own policy in determining its capital structure for short or long term.
The results of this study are in line with Suhendra (2014), Yoshendy, et al (2015), Rambe, et al (2017) states that firm size has no effect on capital structure. However, contrary to research by Sari, et al (2015), Rahmawati, et al (2015), and Ahmad, et al (2017) stated that firm size affects the capital structure. d. Effect of Profitability on
Capital Structure
The result of static analysis shows that profitability effect on capital structure. This is because, the higher the profitability of the company, the company will prefer to use funding from internal sources that is using the profits obtained by the company and will use a relatively small debt because the high rate of return allows the company to finance most of its funding with internal funds. In accordance with the theory of capital structure
Pecking Order Theory which explains the company will prefer internal funding sources rather than having to use
external sources of funding or debt. The use of external funding sources or debt is only used when internal funding is insufficient.
The results are consistent with Kanita (2014), Sari, et al (2015), Yoshendy, et al (2015), Mikrawardhana, et al (2015), Rahmawati, et al (2017), Ahmad, et al (2017), Marfuah, et al (2017), and Rambe, et al (2017) states that profitability affects the capital structure. But contrary to Suhendra (2014) states that profitability does not affect the capital structure.
4 CONCLUSIONS
The purpose of this research is to know and analyze the influence of asset structure, liquidity, firm size and profitability to capital structure. This study used a sample of 156 companies in 2014 and 2015 through multiple linear regression analysis.
Based on the test results, hypothesis 1 which states the asset structure does not affect the capital structure is supported by empirical evidence. Hypothesis 2 and Hypothesis 4 proposed in this study which states that liquidity and profitability affect the capital structure is supported by empirical evidence. Hypothesis 3 proposed in this study which states that firm size has no effect on capital structure supported by empirical evidence.
and firm size which have no effect on capital structure (2) liquidity and profitability variables affecting capital structure, (3) asset structure, liquidity, firm size, and profitability influence on
DER while 41.3% is influenced by other factors not examined in this study. The results of this study are in line with previous research Kanita (2014) which states that the asset structure has no effect on capital structure, but contrary to the research Rahmawati, et al (2017). In Ahmad, et al (2017) which states that liquidity and profitability have an effect on capital structure, contradict with research of Suhendra (2014) which stated that firm size variable has no effect to capital structure .
5 ACKNOWLEDGEMENTS
Dean of the Faculty of Economics and Head of Accounting Study Program Faculty of Economics, Islamic University of Batik Surakarta.
Kartika Hendra Ts, SE, M.si, Akt, CA, CSRS and Dra. Siti Nurlaela, SE, M. Si, Akt, CA as mentor.
6 REFERENCES
Ahmad, Nazir Gatot., Lestari, Ripa., & Dalimunthe, Sholatia. (2017). Analysis Of Effect Of Probability, Assets Structure, Size Of Companies, And Liquidity To Capital Structures In Mining Companies Listed In Indonesia Stock Exchange Period 2012-2015. Jurnal Riset Manajemen Sains Indonesia (JRMSI), 8 (2).
Brigham, & Houston. (2011). Dasar-dasar Manajemen Keuangan Buku 2
(11 ed.). Jakarta: Salemba Empat.
Kanita, Ghia Ghaida. (2014). Pengaruh Struktur Aktiva dan Profitabilitas terhadap Struktur Modal Perusahaan Makanan dan Minuman. 13, 127– 135.
Marfuah, Safitri Ana., & Nurlaela, Siti. (2017). Pengaruh Ukuran Perusahaan, Pertumbuhan Assets, Profitabilitas dan Pertumbuhan Penjualan terhadap Struktur Modal Perusahaan Cosmetics and Household di Bursa Efek Indonesia.
Jurnal Akuntansi dan Pajak, Vol. 18, No. 01.
Mikrawardhana, M. R., Hidayat, R. R., & Azizah, D. F. (2015). Pengaruh Profitabilitas dan Likuiditas terhadap Struktur Modal Perusahaan Multinasional (Studi Empiris pada Perusahaan Multinasional yang Terdaftar di Bursa Efek Indonesia Tahun 2010-2013). Jurnal Administrasi (JAB), 28 (2).
Rahmawati, Ali, M., Alam, S., & Pahlevi, C. (2015). Faktor-faktor yang Mempengaruhi Struktur Modal dan Nilai Perusahaan Consumers Goods yang tercatat di Indonesia.
Jurnal Publikasi Ilmiah dan Penelitian Internasional www.ijsrp.org, Vol. 5.
Bursa Efek Indonesia. Jurnal Internasional Ilmu dan Ilmu Pengetahuan Sosial , 5 (9), 3918-3927.
Riyanto, Bambang. (2001). Dasar-dasar Pembelajaran Perusahaan.
Yogyakarta: BPFE.
Sari, Mila Diana., Djumahir, & Djazuli, A. (2015, Maret). Pengaruh Profitabilitas, Ukuran Perusahaan, Pertumbuhan Penjualan, Struktur Aset, Non-Debt Tax Shield Dan Usia Perusahaan Terhadap Struktur Modal (Studi Pada Perusahaan Makanan Dan Minuman Di BEI). 1-52.
Sheikh, N. A., & Wang, Z. (2011). Determinants of Capital Strucuture : An Empirical Study of Firms In Manufacturing Industry of Pakistan.
Managerial Finance , 37 (2), 117-133.
Suhendra, Euphrasia Susy. (2014). Faktor-Faktor yang Mempengaruhi Struktur Modal. International Conference On Eurasian Economies.
Weston, J. F., & Copeland, T. E. (1977).
Manajemen Keuangan (Sembilan ed.). Jakarta: Bina Aksara.
Yoshendy, Andi., Achsani, Noer A., & Maulana, T. N. (2015). (Yoshendy, et al., 2015) tahun 2002 – 2011.