JEMMA, Volume 1 Nomor 1, Maret 2018 1
JURNAL OF ECONOMIC, MANAGEMENT
AND ACCOUNTING
- JEMMA
-
Fakultas Ekonomi Universitas Andi Djemma Jl. Dahlia No Kota Palopo
FORECASTING MODEL WITH BOX-JENKINS METHOD TO PREDICT TOURISTS WHO VISIT TOURISM PLACE IN TORAJA
Penulis Info Artikel
1Didiharyono
Universitas Andi Djemma Email: [email protected]
2Bakhtiar
Universitas Andi Djemma Email: [email protected]
p-ISSN : 2615-1871 e-ISSN : 2615-5850
Volume 1 Nomor 1, Maret 2018
ABSTRACT
This study aims to determine forecasting model with Box-Jenkins method and obtain results of data forecasting the number of tourists who visit tourism in Toraja the future period. Research method used is applied research with quantitative data. Research procedures include identification of model, parameter estimation in model, verification and forecasting with using Minitab computer software. Based on the research obtained four models used in forecasting the number of tourists in Toraja the future period is ARIMA(1,1,1), ARIMA(2,1,1), ARIMA(1,2,1) and ARIMA(2,2,1). The correct criteria in selecting the best model is the model that has the smallest Mean Square (MS) value. In this case the time series model with the smallest MS value is ARIMA(2,2,1) that is 736062253. Thus, this model will used in forecasting is ARIMA(2,2,1) with equations 𝑍𝑡 = 1,2167𝑍𝑡−1+ 0,2605𝑍𝑡+ 0,1711𝑍𝑡−3+ 0,3061𝑍𝑡−4+ 𝑎𝑡− 1,0323𝑎𝑡−1. The forecasting results for January to December 2021 is 149985, 193099, 207559, 202903, 222426, 229294, 239108, 250921, 260701, 271895, 283037 and 294221.
Keywords: Forecasting, Box-Jenkins Method and Tourists.
INTRODUCTION
Forecasting is one of the most important elements in decision-making in various aspects. Basically forecasting is done based on historical data that is analyzed using certain ways. Such historical data is collected, analyzed and studied to be linked over time. The forecasting model is very different for each issue depending on the various factors that influence it. Although, in the forecasting will not be obtained accuracy with value of one hundred percent. However, this does not necessarily mean that forecasting is not necessary, this forecasting can at least provide a picture of a situation or event that may occur in the future, so that it can assist the decision-making process and preparation for future improvement.
JEMMA, Volume 1 Nomor 1, Maret 2018 2 comfort for the visitors. Therefore, the visitors number who come to the tourist attractions depends on the comfort of place for visitors.
Tourist attractions in Toraja which includes two districts of Tanah Toraja district and North Toraja district including Ma'nene Traditions, Rambu Solo ceremony, Kete Kesu, Londa, Batutumonga, Bori Parinding and Pohon Tarra, Ranteallo, Ne’ Gandeng Museum, Pallawa, Sarambu Assing Waterfall, Lolai and others. The existence of these attractions is very potential in an effort to increase economic growth in the two districts and must get special attention in improving the condition of existing attractions in Toraja.
Based on data from the Tourism Office of South Sulawesi Province The visitation rate in Toraja continues to increase from time to time and the most visit in December because at that time there was a very spectacular event that was attended by tourists from various countries, the event is known as "lovely December".
Increasing the number of tourists both local tourists and foreign tourists who continue to increase from time to time not only as something just as beneficial area. But also it can only be something that happens more often in the absence of services that are less satisfactory service and infrastructure will be a disappointment for foreign tourists, resulting in a decrease in the number of tourists visiting the Toraja region and this is very detrimental to Indonesia generally and Toraja especially as a tourist destination.
One of method that can be used in predicting the number of tourists in future is forcasting model time series analysis with Box-Jenkins method or also known as ARIMA method. This method can be used with studied the pattern of previous tourist data with regard to stationary and non stationary concept, autocovariance, autocorrelation function, partial autocorrelation function, backshiff operators and different operators. So time series analysis is used in this forecast because the pattern in the past will affect the pattern in the future.
The general model representing the non-stationary time series is Autoregressive Integrated Moving Average model or ARIMA (p,d,q) with p, d, q is the level for the autoregressive process, differencing and moving average. Wei (2006) ARIMA (p,d,q) model can be written in the general form,
(1 − 𝜙1𝐵 − 𝜙2𝐵2− ⋯ − 𝜙𝑝𝐵𝑝)(1 − 𝐵)𝑑𝑧̃𝑡 = (1 − 𝜃1𝐵− ⋯ − 𝜃𝑞𝐵𝑞)𝑎𝑡
where, 𝜙1⋯ 𝜙𝑝 : parameter of AR model, (1-B)d : differencing level, 𝑍𝑡 : forecast value periode
t, 𝜃1⋯ 𝜃𝑞 : Parameter MA model, and 𝑎𝑡 : residual value period t.
This method also uses iterative approach in identifying the best model. The advantage of this method in general is that it can analyze all time series data. The ARIMA model is said to be precise if the residual between the forecasting model with small historical data points, distributed randomly and independently of each other. Research with ARIMA model is also used by Sarpong (2013), Paul et al (2013), Steve (2014), Eni and Adeyeye (2015) which focuses its research on different cases. The use of ARIMA methods in predicting or forecasting data on the number of tourists coming to Toraja in visiting all tourism places in Toraja the future period, so that local governments can prepare as early as possible good services and infrastructure necessary in preserving the attractions in providing comfort for the visitors.
JEMMA, Volume 1 Nomor 1, Maret 2018 3 about the number of tourists both local tourists and foreign tourists who visit the tourism in Toraja and can respond to the number of tourists by providing better service from year to year.
RESEARCH METHODS
The type of research used is applied research with quantitative data. The data used from the Central Statistics agency (BPS) of Tana Toraja and North Toraja for 60 periods from January 2012 to December 2016. Aswi and Sukarna (2008) the research procedure is
1. Identification of model includes (a). Perform data plots with graphs. (b). Stationary data checking with ACF and PACF,
2. Differences data if non-stationar happens at the data, and used ACF and PACF analysis for stationary data.
3. The parameter estimation model includes (a). Determine the model coefficients, (b). Estimation the model and (c). Temporary model selection.
4. Verification and forecasting phases include (a). Determination of the smallest Mean Square (MS) model, (b). Selection of the best model and (c) forecasting.
RESULTS AND DISCUSSION Identification of Model
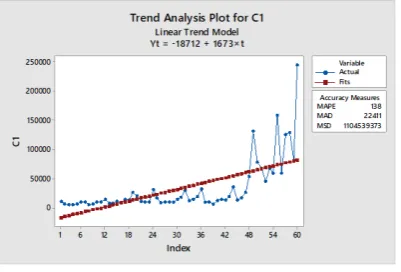
The number of tourists visiting Toraja for monthly data is presented from January 2012 to December 2016, where the total period is 60 (months). Based on the research data, the graph is as follows,
Figure 1. Trend graph a data
Based on the data plot and trend graph of data analysis in Figure 1 it can be seen that tourist visits have increased every time and the actual value is still far from linear lines and has a large variance, so this trend graph including time series that is not stationary in the average, though without seeing ACF and PACF.
In Figure 1 it shows 15 lags, in minitab if the number of lags is not requested it will automatically show the lag as much as the observation (n) ≤ 240, in this case the number of observations is 60 so 60/4 = 15 lag. In the identification of the original data is not yet formed model so that required first difference data to determine the stationary data.
Differences of Data
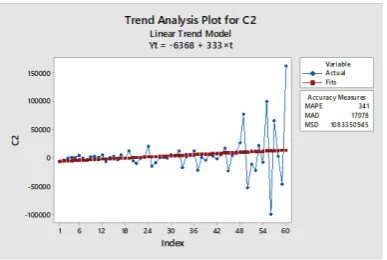
JEMMA, Volume 1 Nomor 1, Maret 2018 4 Figure 2. Graph of data analysis after differences
Based on Figure 4 we can see that the data is stationary, since the average does not move freely in a given time and has a fairly small variance and the actual value is close to a linear line. Box-Jenkins forecasting model is identified by observing the Autocorrelation Function (ACF) and Partial Autocorrelation Function (PACF)value.
Figure 3. ACF Graph after differences Next, determine PACF graph is as follows,
Partial Autocorrelation Function: C2
JEMMA, Volume 1 Nomor 1, Maret 2018 5 Figure 4. PACF graph after differences
Graph ACF in figure 3 looks data is stationary because the graphics dies down so it can be directly predicted the model and 𝜌𝑘cut off after lag-10 or lag-q for highest level moving average. While, the PACF graph in Figure 4 is seen following the sine graph and exponential dies down graph, with 𝜙𝑘𝑘value cut off at white noise after lag-1 and possibly on lag-2 or lag-p for highest level autoregresif.
So the approximate model is ARIMA (1,1,1) or AR (1) because the ACF graph exponential dies down and PACF is cut off on lag-1, differences 1 time, MA (1) because the ACF graph cut off at lag-1 and PACF exponentially dies down (sinusoidally), so general form ARIMA (1,1,1) can be written
𝑍𝑡 = (1 + 𝜙1)𝑍𝑡−1− 𝜙1𝑍𝑡−2+ 𝑎𝑡− 𝜃1𝑎𝑡−1
And also possible model estimation is ARIMA (2,1,1) or AR (2) because the ACF graph exponential dies down and PACF is cut off on lag-2, differences 1 time, MA (1) because the ACF graph cut off at lag-1 and PACF exponentially dies down (sinusoidally), so general form ARIMA (2,1,1) can be written
𝑍𝑡 = (1 + 𝜙1)𝑍𝑡−1+ (𝜙2− 𝜙1)𝑍𝑡−2 − 𝜙2𝑍𝑡−3+ 𝑎𝑡− 𝜃1𝑎𝑡−1
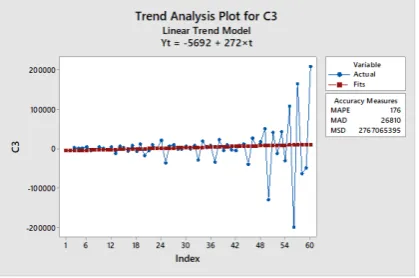
Furthermore, second difference is done with the aim of looking at the comparison between Mean Square value with the first difference result. The graph is as follows.
Figure 5. Graph of data analysis after second differences
Based on figure 7 shows that data is already stationary because the number of production is almost the same and not moving freely in a certain time, the value of variance is also quite small and the average actual value is close to linear line. Next is determined the value of ACF and PACF.
JEMMA, Volume 1 Nomor 1, Maret 2018 6
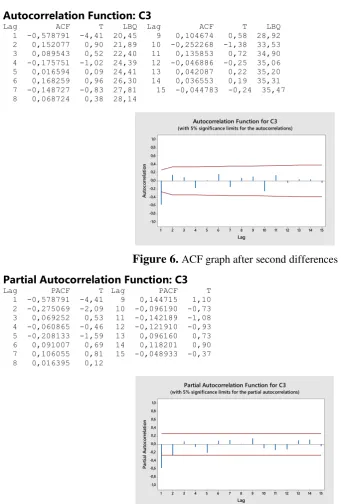
Figure 6. ACF graph after second differences Partial Autocorrelation Function: C3
Lag PACF T Lag PACF T
Figure 7. PACF graph after second differences
Graph ACF in figure 6 looks data is stationary because the graphics exponentially dies down (sinusoidally) and 𝜌𝑘cut off after lag-10 or lag-q for highest level moving average. While, the PACF graph in Figure 4 is seen following the sine graph and exponential dies down graph, with
𝜙𝑘𝑘value cut off at white noise after lag-1 and possibly on lag-2 or lag-p for highest level autoregresif.
So the approximate model is ARIMA (1,2,1) or AR (1) because the ACF graph exponential dies down and PACF is cut off on lag-1, differences 2 time, MA (1) because the ACF graph cut off at lag-1 and PACF exponentially dies down, so general form ARIMA (1,2,1) can be written
𝑍𝑡 = (2 + 𝜙1)𝑍𝑡−1− (1 + 2𝜙1)𝑍𝑡−2+ 𝜙1𝑍𝑡−3+ 𝑎𝑡− 𝜃1𝑎𝑡−1 (with 5% significance limits for the autocorrelations)
JEMMA, Volume 1 Nomor 1, Maret 2018 7 And also possible model estimation is ARIMA (2,2,1) or AR (2) because the ACF graph exponential dies down and PACF is cut off on lag-2, differences 2 time, MA (1) because the ACF graph cut off at lag-1 and PACF exponentially dies down (sinusoidally), so general form ARIMA (2,2,1) can be written
𝑍𝑡 = (2 + 𝜙1)𝑍𝑡−1− (1 + 2𝜙1 + 𝜙2)𝑍𝑡−2 + (𝜙1+ 2𝜙2)𝑍𝑡−3− 𝜙2𝑍𝑡−4+ 𝑎𝑡− 𝜃1𝑎𝑡−1
Parameter Estimation
After identifying the data and differences of data then the next step to determine parameter estimation of data.
1. Model ARIMA (1,1,1)
Based on Minitab calculation results obtained ARIMA (1,1,1) model with parameter 𝜙1= -0,3868 and 𝜃1= 0,4915, then the equation model is obtained
𝑍𝑡 = (1 + 𝜙1)𝑍𝑡−1− 𝜙1𝑍𝑡−2+ 𝑎𝑡− 𝜃1𝑎𝑡−1
𝑍𝑡 = (1 − 0,3868 )𝑍𝑡−1+ 0,3868 𝑍𝑡−2+ 𝑎𝑡− 0,4915𝑎𝑡−1
𝑍𝑡= 0,6132𝑍𝑡−1+ 0,3868 𝑍𝑡−2+ 𝑎𝑡− 0,4915𝑎𝑡−1
With Mean Square (MS) value at first differences is 783047339. 2. Model ARIMA (2,1,1)
Based on Minitab calculation results obtained ARIMA (2,1,1) model with parameter 𝜙1= -0,319,
𝜙2= -0,0834 and 𝜃1= 5572, then the equation model is obtained
𝑍𝑡 = (1 + 𝜙1)𝑍𝑡−1+ (𝜙2− 𝜙1)𝑍𝑡−2 − 𝜙2𝑍𝑡−3+ 𝑎𝑡− 𝜃1𝑎𝑡−1
𝑍𝑡 = (1 − 0,319)𝑍𝑡−1+ (−0,0834 + 0,319)𝑍𝑡−2+ 0,0834𝑍𝑡−3+ 𝑎𝑡− 0,5572𝑎𝑡−1
𝑍𝑡 = 0,681𝑍𝑡−1+ 0,2356𝑍𝑡−2+ 0,0834𝑍𝑡−3+ 𝑎𝑡− 0,5572𝑎𝑡−1
With Mean Square (MS) value at first differences is 795928310. 3. Model ARIMA (1,2,1)
Based on Minitab calculation results obtained ARIMA (1,2,1) model with parameter 𝜙1= -0,6801 and 𝜃1= 0,9586, then the equation model is obtained
𝑍𝑡 = (2 + 𝜙1)𝑍𝑡−1− (1 + 2𝜙1)𝑍𝑡−2+ 𝜙1𝑍𝑡−3+ 𝑎𝑡− 𝜃1𝑎𝑡−1
𝑍𝑡 = (2 − 0,6801)𝑍𝑡−1− (1 + 2(−0,6801))𝑍𝑡−2− 0,6801𝑍𝑡−3 + 𝑎𝑡− 0,9586𝑎𝑡−1
𝑍𝑡 = 1,3199𝑍𝑡−1+ 0,3602𝑍𝑡−2− 0,6801𝑍𝑡−3+ 𝑎𝑡− 0,9586𝑎𝑡−1
With Mean Square (MS) value at first differences is 839223359. 4. Model ARIMA (2,2,1)
Based on Minitab calculation results obtained ARIMA (2,2,1) model with parameter 𝜙1= -0,7833,
JEMMA, Volume 1 Nomor 1, Maret 2018 8
𝑍𝑡 = (2 + 𝜙1)𝑍𝑡−1− (1 + 2𝜙1 + 𝜙2)𝑍𝑡−2 + (𝜙1+ 2𝜙2)𝑍𝑡−3− 𝜙2𝑍𝑡−4+ 𝑎𝑡− 𝜃1𝑎𝑡−1
𝑍𝑡 = (2 − 0,7833)𝑍𝑡−1− (1 − 2 (0,7833) − 0,3061)𝑍𝑡−2+ (0,7833 − 2(0,3061)𝑍𝑡−3
+ 0,3061𝑍𝑡−4 + 𝑎𝑡− 1,0323𝑎𝑡−1
𝑍𝑡 = 1,2167𝑍𝑡−1+ 0,2605𝑍𝑡+ 0,1711𝑍𝑡−3+ 0,3061𝑍𝑡−4+ 𝑎𝑡− 1,0323𝑎𝑡−1
With Mean Square (MS) value at first differences is 736062253. Verification and Forecasting
This stage aims to examine the best model that is by finding the smallest MS (Mean Square) value based on the result of parameter estimation that is as follows
- ARIMA (1,1,1) model has Mean Square value of 783047339 - ARIMA (2,1,1) model has Mean Square value of 795928310 - ARIMA (1,2,1) model has Mean Square value of 839223359 - ARIMA (1,1,1) model has Mean Square value of 736062253
Based on these four ARIMA models, it can be concluded that ARIMA (2,2,1) model has the smallest MS value. Thus the appropriate model for predicting tourist data is the ARIMA (2,2,1) model with equations as follows,
𝑍𝑡 = 1,2167𝑍𝑡−1+ 0,2605𝑍𝑡+ 0,1711𝑍𝑡−3+ 0,3061𝑍𝑡−4+ 𝑎𝑡− 1,0323𝑎𝑡−1
ARIMA (2,2,1) model is the most suitable model for modeling time series data and forecasting future periods of data on the number of tourists coming to visit Tourism in Toraja. With the results of forecasting,
Forecasts from period 60 95% Limits
Period Forecast Lower Upper Actual 61 149985 96799 203172
62 193099 139016 247182 63 207559 147641 267477 64 202903 138044 267763 65 222426 154848 290004 66 229294 158182 300406 67 239108 165308 312908 68 250921 174731 327111 69 260701 182277 339124 70 271895 191568 352222 71 283037 200990 365085 72 294221 210649 377793
The above forcast table shows that for the period (t) after the next 60 months from January to December 2021 there is a significant increase each month with 95% limits lower and limit upper of actual data.
CONCLUSION
Based on the research results can be obtained conclusion is as follows,
1. The results obtained four time series models used in forcasting the number of tourists in Toraja in future period is ARIMA(1,1,1), ARIMA(2,1,1), ARIMA(1,2,1) and ARIMA(2,2,1). The correct criteria in selecting the best model is the model that has the smallest Mean Square (MS) value. In this case the time series model with the smallest MS value is ARIMA(2,2,1) that is 736062253. Thus, this model used in forecasting is ARIMA(2,2,1) with the general form
JEMMA, Volume 1 Nomor 1, Maret 2018 9 2. The forecasting results number of tourists in Toraja for January to December 2021 is 149985,
193099, 207559, 202903, 222426, 229294, 239108, 250921, 260701, 271895, 283037 and 294221.
RECOMMENDATIONS
Results forcasting the number of tourists visiting from January to December from year to year increased. Thus, expected that the local government, especially the tourism office can formulate an ideal policy in the maximum service or best service of tourists who visit tourism places in Toraja. Local government should also be more serious to develop the existing tourist attractions there because with the increasing number of tours that visit it can automatically provide income for the improvement of the regional economy.
BIBLIOGRAPHY
Aswi dan Sukarna. (2008). Analisis Deret Waktu, Teori dan Aplikasi. Makassar: Andhira Publisher.
Didiharyono, D., Marsal, M., & Nasruddin, N. (2017). Multivariate Regression Analysis With KICC Method In Measuring of Society Welfare In South Sulawesi. Journal of Math Sciences, 2(2), 5-13.
Eni, Daniel and Fola J. Adeyeye. (2015). Seasonal ARIMA Modeling and Forecasting of Rainfall in Warri Town, Nigeria. Journal of Geoscience and Environment Protection. Vol. 3. August 2015, 91-98
Mondal, Prapanna; Labani Shit and Saptarsi Goswami. (2014). Study of Effectiveness of Time Series Modeling (ARIMA) In Forecasting Stock Prices. International Journal of Computer
Science, Engineering and Applications (IJCSEA). Vol.4, No.2, 13-40
Paul, Jiban Chandra; Shahidul Hoque and Mohammad Morshedur Rahman. (2013). Selection of Best ARIMA Model for Forecasting Average Daily Share Price Index of Pharmaceutical Companies in Bangladesh: A Case Study on Square Pharmaceutical Ltd. Global Journal of
Management and Business Research Finance. Volume 13, Issue 3, 14-25
Sarpong, Smart A. (2013). Modeling and Forecasting Maternal Mortality; an Application of ARIMA Models. International Journal of Applied Science and Technology. Vol. 3 No. 1, 19-28
Steve, Nwankwo. (2014). Autoregressive Integrated Moving Average (ARIMA) Model for Exchange Rate (Naira to Dollar). Academic Journal of Interdisciplinary Studies. Vol. 3. No. 4, 429-433