Advanced
Transport
Systems
Milan Janić
Advanced Transport Systems
Analysis, Modeling, and Evaluation
of Performances
Milan Janic´
Transport and Planning Department Faculty of Civil Engineering
and Geosciences
Delft University of Technology Delft
The Netherlands
ISBN 978-1-4471-6286-5 ISBN 978-1-4471-6287-2 (eBook) DOI 10.1007/978-1-4471-6287-2
Springer London Heidelberg New York Dordrecht
Library of Congress Control Number: 2013955907
Springer-Verlag London 2014
This work is subject to copyright. All rights are reserved by the Publisher, whether the whole or part of the material is concerned, specifically the rights of translation, reprinting, reuse of illustrations, recitation, broadcasting, reproduction on microfilms or in any other physical way, and transmission or information storage and retrieval, electronic adaptation, computer software, or by similar or dissimilar methodology now known or hereafter developed. Exempted from this legal reservation are brief excerpts in connection with reviews or scholarly analysis or material supplied specifically for the purpose of being entered and executed on a computer system, for exclusive use by the purchaser of the work. Duplication of this publication or parts thereof is permitted only under the provisions of the Copyright Law of the Publisher’s location, in its current version, and permission for use must always be obtained from Springer. Permissions for use may be obtained through RightsLink at the Copyright Clearance Center. Violations are liable to prosecution under the respective Copyright Law. The use of general descriptive names, registered names, trademarks, service marks, etc. in this publication does not imply, even in the absence of a specific statement, that such names are exempt from the relevant protective laws and regulations and therefore free for general use.
While the advice and information in this book are believed to be true and accurate at the date of publication, neither the authors nor the editors nor the publisher can accept any legal responsibility for any errors or omissions that may be made. The publisher makes no warranty, express or implied, with respect to the material contained herein.
Printed on acid-free paper
Preface
The transport system has, is, and will continue to be a foundation of the economy of each country/nation, as well as that of the world. In particular, in the twenty-first century, it will further strengthen its role in integrating and globalizing economic activities, and will thus also influence the quality of people’s lives. In the past, transport demand in terms of both the number of passengers and the volumes of freight/goods shipments has been constantly growing in the medium- to long-term period(s) despite being affected, from time to time, by the local and global economic and political crises. This demand has been satisfied by the capacity of the transport system generally consisting of the transport infrastructure, transport means/vehicles, and workforce. Material, energy, and labor has been consumed in order to provide transport services according to the specified internal organization containing operating rules and procedures, and under given external regulation and constraints. On the one hand, such developments have produced the above-mentioned positive contributions to the national economies and social welfare. On the other, they have affected the environment and society in terms of land use/take for expanding the transport infrastructure, energy consumption from non-renewable sources (coal, crude oil, and natural gas) and related emissions of Green House Gases (GHG), local noise, congestion, and safety (traffic incidents and accidents), Since both passenger and freight transport demand are predicted to double over the next 20 and triple over the next 50 years, solutions for serving them more efficiently and effectively while mitigating impacts on the environment and society need to be provided. Therefore, in addition to creating transport policies and monitoring schemes aiming to reduce physical transport demand (i.e., telecommuting) and implementing advanced transport planning and operating tools and techniques, potential solutions also lie in developing advanced technologies individually and/or in combination with advanced operational concepts. Generally, this implies providing: (i) sufficiently capacitated and environmentally friendlier, i.e., more energy/fuel efficient, cleaner, quieter, and safer, technologies based on an increased use of renewable energy/fuel sources (such as, for example, biomass fuels (liquid) hydrogen, wind and solar energy), nanotechnologies, and information technologies; and (ii) the advanced organizational and operational forms and concepts of using transport infrastructure, transport means/vehicles, and accompanied resources.
Experience so far indicates that commercialization, i.e., development and implementation, of the advanced components—technologies and related
operational concepts—of the transport system has been an evolutionary rather than a revolutionary process. The main reasons include: (i) a rather long time for maturing up to full commercialization; (ii) an inherent threat from confronting existing and forthcoming even stricter institutional/policy regulation/constraints; (iii) relatively high development costs; (iv) frequently uncertain long-term overall commercial and social feasibility; and (v) a relatively long path for obtaining operational certification implying full environmental and societal/policy acceptance. Under such circumstances, most such transport technologies and operational concepts, except a couple of futuristic ones, have been mostly gradually updated and improved, usually based on the closest previous counterparts. In the given context, this justifies deeming them ‘‘innovative’’ or ‘‘advanced’’ rather than completely ‘‘new’’. In this book, the attribute ‘‘advanced’’ is used for all such technologies and operational concepts.
The book describes analysis, modeling, and evaluation of performances of the selected advanced transport systems. Some of them have already been commer-cialized, i.e., implemented and operationalized, and/or are planned to be so, while others are still at the conceptual level waiting for further elaboration. Their performances are considered as derived from the technical/technological design and solutions of the infrastructure, transport means/vehicles, and supporting facilities and equipment used according to the specified operational rules and procedures, and economic, environmental, social, and policy conditions/constraints.
Analysis and modeling implies examination of their infrastructural, technical/ technological, operational, economic, environmental, social, and policy performances. Evaluation based on a Strengths, Weaknesses, Opportunities and Threats (SWOT)-like analysis implies assessment of the advantages and disadvan-tages of these systems. In such context, Strengths and Opportunities are considered as advantages, while Weaknesses and Threats are considered disadvantages. Both are considered from the aspects of academics/researchers, but also from those of par-ticular actors/stakeholders involved such as users of transport services–passengers and freight/goods shippers/receivers, transport infrastructure and service providers/ operators, investors, policy makers at different institutional levels (local, national, international), and members of the local community/society.
Particular advanced transport systems have been selected according to the following criteria: (i) the level of advancement of particular performances; (ii) representativeness through transport modes (rail, road, air, water/sea, inter-modal); (iii) their spatial scale (area) of operation (urban and inter-urban); (iv) category of demand served (passengers, freight/goods); (v) availability/ accessibility of relevant information (from science-based and publically-accessible relevant sources); and (vi) the level of systematic scientific elaboration as compared to that used in this book.
The widely dispersed and in some cases scarce material collected from the various available sources such as research (including my own), literature (books and papers in scientific and professional journals), and websites is presented from the traffic and transport engineering and planning and design perspective. Most facts and issues are scientifically supported and accurate regarding the funda-mental relationships between particular variables (parameters). Nevertheless, some of them, particularly those related to futuristic concepts, contain a level of fuzzi-ness in the absolute terms, which, however, does not compromise their relevance in the given context. As such, the book aims to be informative as much as possible but by no means exhaustive—to the contrary, it intends to provide academics, researchers, consultants, policy/decision makers, and professionals from the transport industry and related fields with material for current and future research and development of the transport system.
The author gratefully acknowledges the support of organizations and individuals in getting this book into publishable form.
Firstly, I would like to thank very much the Transport Institute of Delft University of Technology (Prof. Bart van Arem—Director, and Dr. Arjan van Binsbergen—Secretary) (TU Delft, Delft, The Netherlands) for some financial support in finalizing the work on the book. Secondly, I benefited greatly from the valuable discussions, materials, exhibits, and data provided by Mr. John P. Christy, Lead Engineer—Operations Airport Technology, Boeing and Ms. Mary E. Kane, Trademark and Copyright Licensing, Boeing Intellectual Property Management (Boeing Company/Commercial Airplanes, Seattle, Washington, USA).
Thirdly, I give my special gratitude to Mr. Andrej Grah Whatmough for his excellent help polishing the language.
On the personal side, the great effort of writing this book was continuously supported and inspired by my wife Vesna and my son Miodrag, doctor of medi-cine, who was at the same time also working enthusiastically on his Ph.D. thesis.
Milan Janic´
Contents
1 Advanced Transport Systems: General. . . 1
1.1 Definition . . . 1
1.2 Classification . . . 2
1.2.1 Attributes/Criteria Related to Advanced Components . . . 3
1.2.2 Attributes/Criteria Related to Level of Commercialization . . . 4
1.3 Performances . . . 4
1.3.1 Definition. . . 4
1.3.2 Analyzing, Modeling, and Evaluation . . . 8
1.4 Composition of the Book . . . 8
References . . . 9
2 Advanced Transport Systems: Operations and Technologies . . . 11
2.1 Introduction . . . 11
2.2 Bus Rapid Transit Systems . . . 12
2.2.1 Definition, Development, and Use. . . 12
2.2.2 Analyzing and Modeling Performances . . . 14
2.2.3 Evaluation . . . 40
2.3 High Speed Tilting Passenger Trains . . . 42
2.3.1 Definition, Development, and Use. . . 42
2.3.2 Analyzing and Modeling Performances . . . 43
2.3.3 Evaluation . . . 61
2.4 Advanced Subsonic Commercial Aircraft . . . 62
2.4.1 Definition, Development, and Use. . . 62
2.4.2 Analyzing and Modeling Performances . . . 63
2.4.3 Evaluation . . . 78
References . . . 79
3 Advanced Transport Systems: Operations and Economics. . . 83
3.1 Introduction . . . 83
3.2 Advanced Freight Collection/Distribution Networks. . . 84
3.2.1 Definition, Development, and Use. . . 84
3.2.2 Analyzing and Modeling Performances . . . 86
3.2.3 Evaluation . . . 110
3.3 Road Mega Trucks . . . 111
3.3.1 Definition, Development, and Use. . . 111
3.3.2 Analyzing and Modeling Performances . . . 112
3.3.3 Evaluation . . . 125
3.4 Long Intermodal Freight Train(s) . . . 126
3.4.1 Definition, Development, and Use. . . 126
3.4.2 Analyzing Performances . . . 127
3.4.3 Modeling Performances . . . 132
3.4.4 Evaluation . . . 144
3.5 Large Commercial Freight Aircraft . . . 145
3.5.1 Definition, Development, and Use. . . 145
3.5.2 Analyzing and Modeling Performances . . . 147
3.5.3 Evaluation . . . 161
References . . . 162
4 Advanced Transport Systems: Technologies and Environment. . . . 165
4.1 Introduction . . . 165
4.2 Advanced Passenger Cars . . . 167
4.2.1 Definition, Development, and Use. . . 167
4.2.2 Analysis and Modeling Performances . . . 168
4.2.3 Evaluation . . . 185
4.3 Large Advanced Container Ships. . . 186
4.3.1 Definition, Development, and Use. . . 187
4.3.2 Analyzing and Modeling Performances . . . 188
4.3.3 Evaluation . . . 214
4.4 Liquid Hydrogen-Fuelled Commercial Air Transportation . . . 216
4.4.1 Definition, Development, and Use. . . 216
4.4.2 Analysis and Modeling Performance . . . 217
4.4.3 Evaluation . . . 228
References . . . 229
5 Advanced Transport Systems: Infrastructure, Technologies, Operations, Economics, Environment, and Society/Policy . . . 235
5.1 Introduction . . . 235
5.2 High Speed Transport Systems . . . 236
5.2.1 Definition, Development, and Use. . . 236
5.2.2 Evaluation . . . 274
References . . . 275
6 Advanced Transport Systems: Future Concepts . . . 277
6.1 Introduction . . . 277
6.2 Personal Rapid Transit Systems. . . 279
6.2.2 Analyzing and Modeling Performances . . . 281
6.2.3 Evaluation . . . 303
6.3 Underground Freight Transport Systems. . . 305
6.3.1 Definition, Development, and Use. . . 305
6.3.2 Analyzing and Modeling Performances . . . 306
6.3.3 Evaluation . . . 319
6.4 Evacuated Tube Transport System. . . 322
6.4.1 Definition, Development, and Use. . . 323
6.4.2 Analyzing and Modeling Performances . . . 325
6.4.3 Evaluation . . . 340
6.5 Advanced Air Traffic Control Technologies and Operations for Increasing Airport Runway Capacity . . . 341
6.5.1 Definition, Development, and Use. . . 341
6.5.2 Analyzing Performances . . . 342
6.5.3 Modeling Performances . . . 354
6.5.4 Evaluation . . . 363
6.6 Advanced Supersonic Transport Aircraft . . . 364
6.6.1 Definition, Development, and Use. . . 364
6.6.2 Analyzing and Modeling Performances . . . 366
6.6.3 Evaluation . . . 386
References . . . 388
7 Advanced Transport Systems: Contribution to Sustainability . . . . 391
7.1 Introduction . . . 391
7.2 Contribution . . . 391
7.3 Some Controversies . . . 394
7.3.1 Technical Productivity . . . 394
7.3.2 Energy/Fuel Consumption and Emissions of GHG . . . 396
7.3.3 Safety . . . 397
Reference . . . 398
About the Author . . . 399
ABD Additional breaking device ACN Aircaft classification number AGV Automotice grande vitesse AMT Automatic manual transmission ANA Air Nippon Airways
APT Air passenger transport APU Auxiliary power unit ASM Available seat mile ATA Air Transport Association ATAG Air Transport Action Group ATC Air traffic control
ATMS Automated manual system AVL Automatic vehicle location atm Atmosphere
ATMS Automated manual system BAU Business as usual
BEV Battery electric vehicle BR Bypass ratio
BRT Bus rapid transit
CAD Computer aided dispatching CDA Continuous descent approach CDB Central business district
CEN Comité Européen de Normalisation CIA Central Intelligence Agency CIFT Commercial intermodal freight train CNG Compressed natural gas
CO Carbon monoxide
CSS Carbon capture and storage DC Direct-current
DM Decision making (maker) DPF Diesel particulate filter
DWT Deadweight tonnage
EADS European Aeronautic Defense and Space Company EAT Economic analysis technique
EBHA Electrical backup hydrostatic actuators EC European Commission
ECB European Central Bank EDS Electro dynamic suspension EEC Electronic engine controller EEDI Energy efficiency design index EEOI Energy efficiency operational indicator EET Evacuated tube transport
EFB Electronic flight bag EGR Exhaust gas recirculation EHA Electro-hydrostatic actuators EMS Electromagnetic suspension EPNL Equivalent perceived noise level EPS Enhanced permissible speed ETCS European train control system
ETOPS Extended range twin-engine operational performances EU European Union
FAA Federal Aviation Administration FAME Fatty acid methyl ester
FL Flight level
FMS Flight management system g Gravitational acceleration
GAO Government Accountability Office (US) GDP Gross domestic product
GHG Green house gases
GIS Geographic information system GS Glide slope
GPS Global positioning satellite Gt Giga ton
HFCV Hydrogen fuel cell vehicle HFO Heavy fuel oil
hp Horse power
HPC High pressure compressor HPT High pressure turbine HS High speed
HSs Hub-and spoke(s) (network) HSR High speed rail
HV Hydrogen vehicle
IATA International Air Transport Association ICAO International Civil Aviation Organization ICE Inter-city-express
ICEV Internal combustion engine vehicle ICT Information communication technologies IFR Instrument flight rules
ILS Instrument landing system IMA Integrated modular avionics IMC Instrument metrological conditions IMF International monetary fund IMO International Maritime Organization INA Integrated noise area
IPC Intermediate pressure compressor IPT Intermediate pressure turbine ITS Intelligent transport systems
JAXA Japan Aerospace eXploration Agency km Kilometer
Kn Kilo-Newton
kts Knot
kW Kilowatt kWh Kilowatt-hour
l Liter
LAPCAT Long-Term Advanced Propulsion Concepts and Technologies lb Pound-mass
LCA Life cycle analysis LCC Low cost carrier LEM Linear electric motor LH2 Liquid hydrogen
LIFT Long intermodal freight train LIM Linear induction motor LNG Liquefied natural gas
LPP Lean premixed pre-vaporized (concept) L/R Line or ring (network)
LSM Linear synchronous motor LU Loading unit
m Meter
M Mixed (network) MAGLEV MAGnetic levitation MCA Multi criteria analysis
MEPC The Marine Environment Protection Committee MFD Multi-functional display
MJ Mega joule
MLS Microwave landing system MLW Maximum landing weight MS Manual system
MTOW Maximum take-off weight MW Mega watt
MWh Mega watt hour
MZFW Maximum zero fuel weight
NASA National Aeronautics and Space Administration NextGen Next generation (air transport system)
nm Nautical mile
NSS Network systems server NOx Nitrogen oxide
OMs Overall emission(s) OEW Operating empty weight
Pa Pascal
PDE Pulse detonated engine PEM Polymer electrolyte membrane P–P Point-to-point (network) PS Permissible speed
RFID Radio frequency identification PR Priority
PRT Personal rapid transit RAT Ram air turbine RNAV aRea navigation
ROL Rich-burn/quick-quench/lean-burn RPK Revenue passenger kilometer rpm Rotations per minute
RTK Revenue ton-kilometer
SAW Simple additive weighting (method) SBSP Space-based solar power
SCMR Specific maximum continuous rating SCR Selective catalytic reduction
SESAR Single European Sky ATM Research SEEMP Ship energy efficiency management plan SFC Specific fuel consumption
SN Specific noise
STA Supersonic Transport Aircraft
TCD Trunk line with collecting/distribution forks (network) TEN Trans-European Transport Network
TEU Twenty foot equivalent unit TGV Train à grande vitesse
TOPSIS Technique for order preference by similarity to ideal solution (method)
TOW Take-off weight TRM Transrapid maglev
TSFC Thrust specific fuel consumption TTW Tank-to-wheel
TU Transport unit
TVM Transmission voie-machine (transmission track-machine)
UFT Underground freight transport UIC International Union of Railways ULD Unit load device
U.S. United States VFR Visual flight rules
VMC Visual meteorological conditions VOCs Volatile organic compound(s) WSC World Shipping Council WHRS Waste heat recovery system WIF Water in fuel
Chapter 1
Advanced Transport Systems: General
1.1 Definition
The transport system can be considered as a physical entity for the mobility of persons and physical movements of freight/goods shipments between their (ulti-mate) origins and destinations. The entity consists of infrastructure, transport means/vehicles, supporting facilities and equipment, workforce, and organizational forms of their use. Energy/fuel is consumed to build/manufacture and operate the infrastructure, transport means/vehicles, and facilities and equipment. The transport system includes different forms/modes such as rail, road, water, air, and their sensible/wise combinations operating as intermodal or multimodal transport service networks. Depending on the volumes and intensity of passenger and freight/goods demand, each mode has different self-contained components distinguished mainly with respect to the type of technologies, resources used, and concepts of providing transport services. Consequently, in the remaining text, the term ‘‘systems’’ is used for these rather complex components of the transport system.
The above-mentioned systems operated by different transport modes provide services in urban, suburban, and interurban regions, thus covering different spatial/ geographical scales implying short, medium, and long transport distances, respectively. These systems include both conventional and advanced elements. In the remaining text, those with predominantly advanced elements as compared to their preceding counterparts are referred to as ‘‘advanced systems.’’ The attribute ‘‘advanced’’ implies that the given system is superior compared to its closest preceding counterpart(s) in the same or different transport mode(s), with respect to one, a few, and/or all infrastructural, technical/technological,1and/or operational
1 A specific advancement in technical/technological performances is made by use of new
materials (composites) based on the elements of nanotechnology. This is the science and engineering of examining, monitoring, and modifying materials at nanoscale (atomic and/or molecular level). By changing the structure of materials in terms of their physical, mechanical, electrical, magnetic properties, heat conduction, and light reflection, this approach will also be able to produce improved and/or new generation of concrete, steel, aluminum, etc., materials currently widely used in construction of transport infrastructure and transport means/vehicles (Khan2011).
M. Janic´,Advanced Transport Systems,
DOI: 10.1007/978-1-4471-6287-2_1,Springer-Verlag London 2014
performances. In many cases, economic, environmental, and social/policy per-formances are also taken into account to refer to such systems as ‘‘advanced.’’
Similar to their conventional counterparts, advanced transport systems consist of physical infrastructure, transport means/vehicles, workforce/labor, and supporting facilities and equipment. An important part of the latter is ITS (Intelligent Transport Systems),2which, with components such as sensors and microchips, have already become and will increasingly continue to be an unavoidable part of the transport system. In addition, advanced transport systems consume energy/fuel to perform their primary function of transporting persons and freight/goods shipments according to the specified organization of transport services based on the given operational rules and procedures. In such context, they are designed to provide safe/ secure, efficient, effective, environmentally, and socially friendlier services then their conventional (‘‘non-advanced’’) counterparts. The first implies the lack of incidents and accidents due to known reasons. The second refers to the lower total, average, and marginal costs of services offered to users/passengers and freight/ goods shippers/receivers. In particular, lower average costs per unit of output (p-km and/or t-km) (p-km—passenger kilometer; t-km—ton-kilometer) can make these systems commercially more feasible then their conventional counterparts. The third implies the quality of transport services provided to users/passengers and freight/ goods shippers/receivers—attributed to the improved accessibility, regularity, punctuality, reliability, and shorter travel/service time, higher riding comfort, etc. The last includes, on the one hand, lower absolute and relative impacts on the environment and society in terms of land use (take), energy consumption and related emissions of GHG (Green House Gases),3local noise, congestion, and waste, and on the other, greater contribution to social welfare such as employment and GDP (Gross Domestic Product) on the local, regional, national, and global scale.
1.2 Classification
Advanced transport systems can be classified with respect to different attributes/ criteria. Some relate to their advanced components and some to the level of their commercialization.
2 The ITS enable collecting, processing, and distribution of information about the system states
and operations thanks to tracking and telematics applications, scheduling services/operations, informing/notification of users/passengers and freight/goods shippers/receivers, monitoring security, and detecting potential all kind of threats.
3 The U.S. (United Sates) and EU (European Union) have set up the targets for reducing
emissions of GHG (Green House Gases) from transport sector for about 20 and 50 % by the year 2020 and 2050, respectively, as compared to the year 1990. In addition, some research suggests that if the scenario of the economic and social development continues as BAU (Business As Usual), the world’s total emissions of GHG in terms of CO2from transport sector will reach about
1.2.1 Attributes/Criteria Related to Advanced Components
Advanced transport systems can be classified depending on a single and/or com-bination of dominant (prevailing) advanced components and related performances of their infrastructure, technics/technologies of transport means/vehicles and supporting facilities and equipment, energy/fuel used, pattern of operations, eco-nomic/business model, and impacts/effects on the environment and society. Consequently, in this book, advanced transport systems are ultimately distin-guished and elaborated, independently on the transport mode, as follows:
• Systems with advanced technics/technologies of transport means/vehicles often
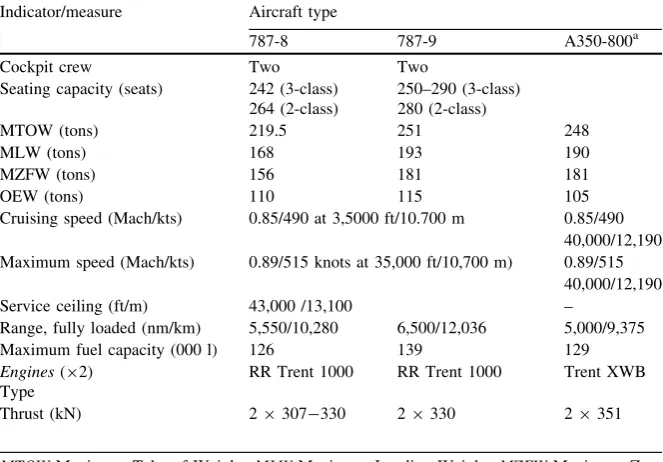
implying modified operations and in some specific cases infrastructure such as high-speed tilting passenger trains, road mega trucks, large commercial freight aircraft, and advanced commercial aircraft (for example, the most recent Boeing B787-8 and the forthcoming Airbus A350);
• Systems with sometimes slightly modified technics/technologies of transport
means/vehicles and advanced operations aiming at improving the efficiency and effectiveness of transport services such as the BRT (Bus Rapid Transit) System systems, advanced freight collection/distribution networks, LIFTs (Long Inter-modal Freight Train(s)) (in Europe), and the APT (Air Passenger Transport) system;
• Systems with advanced technics/technologies of transport means/vehicles and
energy/fuel contributing to the consequent environmental effects/impacts, including advanced passenger cars, large advanced container ships, LH2(Liquid
Hydrogen)-fuelled commercial subsonic aircraft and advanced STA (Supersonic Transport Aircraft); the latter two are alternatives to their current counterparts using crude-oil derivatives-petrol/diesel and kerosene, respectively; and
• Systems with advanced infrastructure, technics/technologies of transport means/
vehicles, and consequently operations and business model such as HSR (High-Speed Rail), TRM (TransRapid MAGLEV (MAGnetic LEVitation)) system, PRT (Personal Rapid Transit) and UFT (Underground Urban Freight) systems in urban areas, and the long-distance ETT (Evacuated Tube Transport) system; additionally, the advanced technologies and procedures in the ATC (Air Traffic Control) system for increasing the airport runway capacity can be categorized in this category.
1.2.2 Attributes/Criteria Related to Level
of Commercialization
Advanced transport systems are usually developed in five phases reflecting the level of their commercialization as follows:
• Exploratory research delivering ideas and concepts;
• Applied research resulting in understanding and further elaboration of the
par-ticular ideas and concepts;
• Pre-industrial development resulting in prototypes and carrying out pilot
oper-ational trials;
• Industrialization resulting in production/manufacturing; and
• Commercialization implying physical implementation and operationalization.
Consequently, advanced transport systems can be categorized into four cate-gories as follows:
• Category I includes systems that have passed all five phases and are fully
commercialized;
• Category II includes systems that have passed all five phases but have been
commercialized on a very limited scope and scale;
• Category III includes systems that have passed two or at most three of the
above-mentioned (five) phases, implying that they are still waiting for or just undergoing pilot operational trials and industrialization; and
• Category IV includes systems in the exploratory phase waiting for the ‘‘green
light’’ in order to pass to subsequent phase(s).
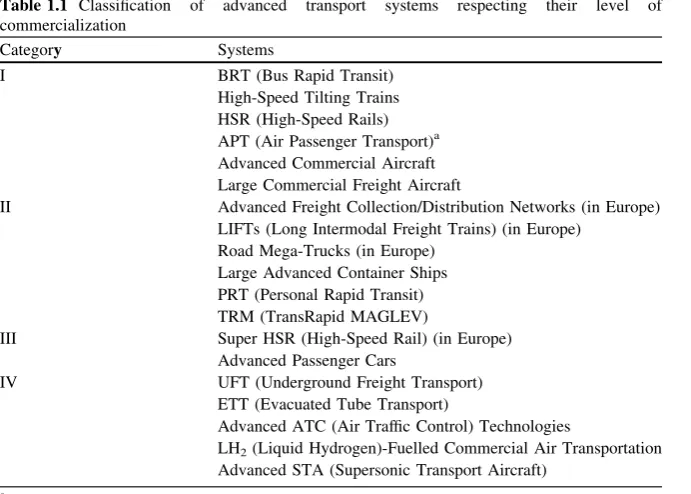
This book considers advanced transport systems categorized according to the level of their commercialization as given in Table1.1.
1.3 Performances
Dealing with advanced transport systems usually raises the question of their performances, i.e., their ability to satisfy current and prospective needs and expectations of particular actors/stakeholders involved. Such an approach requires analyzing, modeling, and evaluating particular performances.
1.3.1 Definition
• Infrastructural and technical/technological performancesmainly reflect
physi-cal, constructive, techniphysi-cal, and technological features of infrastructure, trans-port means/vehicles, and suptrans-porting facilities and equipment, respectively, enabling them to carry out the specified transport operations serving the spec-ified volumes of passenger and freight/goods demand under given conditions.
• Operational performances imply quantitative and qualitative capabilities to
serve given volumes of passenger and freight/goods demand.
• Economic performances reflect the efficiency of serving given volumes of
passenger and freight/goods demand expressed by costs of services covered by the relevant charges (prices).
• Environmental and social performances reflect the intensity and scale of
physical impacts on the environment and society. If monetized, these impacts are considered as externalities.
• Policy performances reflect compliance with current and future medium- to
long-term transport policy regulations and specified targets.
Although these performances are usually considered independently, they are inherently strongly dependent and interactive with each other as shown in Fig.1.1. In the ‘‘top-down’’ consideration, infrastructural performances influence tech-nical/technological performances and consequently create mutual influence
Table 1.1 Classification of advanced transport systems respecting their level of commercialization
Category Systems
I BRT (Bus Rapid Transit)
High-Speed Tilting Trains HSR (High-Speed Rails) APT (Air Passenger Transport)a
Advanced Commercial Aircraft Large Commercial Freight Aircraft
II Advanced Freight Collection/Distribution Networks (in Europe) LIFTs (Long Intermodal Freight Trains) (in Europe)
Road Mega-Trucks (in Europe) Large Advanced Container Ships PRT (Personal Rapid Transit) TRM (TransRapid MAGLEV)
III Super HSR (High-Speed Rail) (in Europe) Advanced Passenger Cars
IV UFT (Underground Freight Transport) ETT (Evacuated Tube Transport)
Advanced ATC (Air Traffic Control) Technologies
LH2(Liquid Hydrogen)-Fuelled Commercial Air Transportation
Advanced STA (Supersonic Transport Aircraft)
a ‘‘The Wright Brothers created the single greatest cultural force since the invention of writing.
between these and all other performances. In the ‘‘bottom-up’’ consideration, social/policy performances influence infrastructural and technical/technological performances and consequently also create mutual influence of these and all other performances.
For example, the technical/technological performances of transport means/ vehicles and supporting facilities and equipment can require completely new infrastructure and consequently pattern of operations, which can influence the economic, environmental, and social performances. Some examples include HSR (High-Speed Rail), TRM (TransRapid MAGLEV (MAGnetic LEVitation)), and ETT (Evacuated Tube Transport). In some other cases, the economic performances can strongly influence the operational performances. Examples of this include advanced freight collection/distribution networks, long intermodal freight trains, and road mega trucks in Europe, as well as large commercial freight aircraft. In addition, the technical/technological performances may directly influence the operational and indirectly the economic performances of particular advanced transport systems using the existing infrastructure. Examples include the BRT (Bus Rapid Transit) System system in urban areas, high-speed tilting passenger trains, large advanced container ships, advanced commercial subsonic and supersonic passenger aircraft, and advanced ATC (Air Traffic Control) technolo-gies aimed at increasing the airport runway capacity. Last but not least, the required environmental and/or social performances can speed up development and commercialization of completely technically/technologically new systems such as advanced passenger cars (that use electricity and/or LH2 (Liquid Hydrogen)
instead of the currently used crude oil-based petrol/diesel), the PRT (Personal Rapid Transit) and UFT (Underground Freight Transport) system (that uses electricity), and advanced STA (Supersonic Transport Aircraft) (that uses LH2
instead of the crude-oil derivative kerosene (JP-1)).
Infrastructural Technical / technological
Operational
Economic
Social / Policy Environmental
Bottom-up Top-down
The main actors/stakeholders involved in dealing with advanced transport systems include:
• Investors, constructors/manufacturers of infrastructure, transport
means/vehi-cles, supportive facilities and equipment, and suppliers of raw material energy/ fuel;
• Providers and operators of transport infrastructure and services, respectively; • Users of transport services (passengers and freight/goods shippers/receivers); • Policy/decision makers at local, regional, national, and international level and
related associations; and
• The local population both benefiting and being affected by the given systems.
Their interests and individual objectives can coincide or be in conflict with each other. For example, investors generally prefer to see a return on their investments over the specified/planned period of time. Suppliers of raw material and energy, and all related manufacturers prefer growth of these systems bringing them eco-nomic benefits. In this case, the objectives and interests coincide and influence each other downstream the chain of commercialization of the given advanced transport system(s). Providers and operators of transport infrastructure prefer its utilization at least at the level of covering operational and maintenance costs under the given pricing policy. Transport operators prefer efficient, effective, and safe transport means/vehicles providing services attractive to their users. Users/pas-sengers and freight/goods shippers/receivers have the same preferences as trans-port operators, but from the perspective of experiencing the expected quality, safety, and security of the consumed services at reasonable/acceptable prices. Policy/decision makers and related associations at the particular institutional/ organizational levels prefer efficient, effective, and safe advanced transport sys-tems fully satisfying the overall user, social, and policy needs. In certain respects, these preferences and objectives, particularly those related to the policy, may be in direct conflict with those of transport infrastructure and service providers, and in indirect conflict with those of raw materials’ suppliers and system manufacturers. Local communities usually have two sets of conflicting preferences. On the one hand, acting as prospective users they prefer advanced transport systems with the maximal availability in space (as close as possible and easily physically accessi-ble) and time (frequent services). On the other, due to their proximity, the same people often complain about the impacts of these systems such as local air pol-lution, noise, induced road congestion, and compromised/demolished landscape. Consequently, these last mentioned preferences are essentially conflicting with the preferences of all other actors/stakeholders involved including those they them-selves experience as users of the systems.
1.3.2 Analyzing, Modeling, and Evaluation
Analyzing the performances of advanced transport systems implies gaining insight into their characteristics and the main influencing factors.
Modeling the performances of advanced transport systems implies defining the indicators and measures of performances and establishing the analytical/quanti-tative relationships between them and the main influencing factors. This enables sensitivity analysis to be carried out systematically by providing a range of inputs for planning and designing the considered system(s). In addition, modeling pro-vides the opportunity to check the quality of particular models/methodologies by using the inputs from the considered cases and comparing their outputs/results with their real-life counterparts. Last but not least, modeling provides input for planning and design of particular system’s performances according to the ‘‘what-if’’ scenario approach. Consequently, this enables their further evaluation according to the given set of attributes/criteria, chosen according to their relevance to the particular actors/stakeholders involved.
Evaluation of performances of advanced transport systems can generally be qualitative and quantitative. Qualitative evaluation implies identification of advantages (Strengths and Opportunities) and disadvantages (Weaknesses and Threats) of the particular advanced system perceived by the current and pro-spective actors/stakeholders, i.e., applying a simplified SWOT analysis. Quanti-tative evaluation implies choosing the preferable among the specified set of alternatives with respect to the specified attributes/criteria reflecting their perfor-mances relevant for the DM (Decision Maker) by using one of the multicriteria evaluation methods. This enables ranking and calculating the scores of the available alternatives and then choosing the one with the highest score as the preferred option.
1.4 Composition of the Book
In addition to this introductory chapter, the book consists of six chapters, each consisting of sections (subchapters) elaborating on a particular advanced transport system. At the beginning of each section, bullet-like historical milestones in development of the given system are provided. At the end of each section, a qualitative evaluation of this system is presented by emphasizing its presumed advantages and disadvantages viewed by the particular actors/stakeholders involved.
Chapter 2elaborates the advanced operational and technological performances of the BRT (Bus Rapid Transit) Systems high-speed tilting passenger train(s), and advanced commercial subsonic aircraft.
Intermodal Freight Trains) (in Europe), as well as large commercial freight aircraft.
Chapter 4 elaborates the technical/technological and environmental perfor-mances of advanced passenger cars, large advanced container ships, and the LH2
(Liquid Hydrogen)-fuelled commercial air transport system.
Chapter 5 deals with the multicriteria ranking of different HS (High-Speed) passenger transport systems—HSR (High-Speed Rail), APT (Air Passenger Transport), and TRM (TransRapid Maglev)—with respect to their infrastructural, technical/technological, operational, economic, and environmental, and social/ policy performances.
Chapter 6elaborates performances of the future systems such as: PRT (Personal Rapid Transit) and UFT (Underground Freight Transport) as urban and/or sub-urban passenger and freight transport systems, respectively; ETT (Evacuated Tube Transport) as a very high-speed long-distance intercontinental transport system for both passengers and freight/goods; advanced Air Traffic Control (ATC) technol-ogies and operations aimed at increasing the airport runway capacity; and advanced long-haul STA (Supersonic Transport Aircraft).
The last Chap. 7 summarizes the potential contribution of the advanced transport systems to sustainability, i.e., greening, of the transport sector above-mentioned.
References
EC. (2010).EU Transport GHG: Routes to 2050?—Towards the Decarbonisation of the EU’s Transport Sector by 2050. Brussels: European Commission DG Environment.
Hawksworth, J. (2008).The word in 2050: Can rapid global growth be reconciled by moving to a low carbon economy?. London, UK: Pricewaterhose Coopers LLP, Economics.
Advanced Transport Systems: Operations
and Technologies
2.1 Introduction
This chapter describes BRT (Bus Rapid Transit) as an advanced mature public transport system operating in many urban and suburban areas round the world, high-speed tilting passenger trains operating along medium- to long-distance passenger corridors/markets in many countries worldwide, and an advanced sub-sonic commercial aircraft—the Boeing B787-8, which has recently started com-mercial operation.
The BRT systems are considered as advanced compared to the conventional urban bus systems mainly thanks to advanced operations. A BRT system can be defined as a ‘‘rapid modes of transportation that combines the quality of rail transit and flexibility of buses’’ (Thomson 2001).
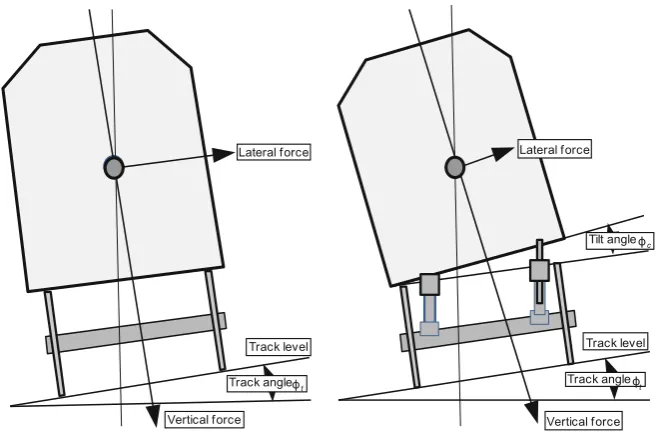
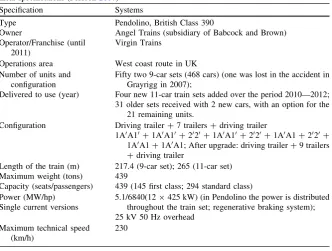
High-speed tilting trains transport users/passengers along the curved segments of the conventional rail lines/tracks at higher speeds than their conventional counterparts thanks to advanced technology—the tilting mechanism. This com-pensates increased centrifugal and centripetal forces due to higher speed in the curved segments of the line by tilting on the opposite side from the direction of the force, i.e., if the force is directed to the left, the train tilts to the right, and vice versa. Such a tilting mechanism makes these trains advanced transport means/ vehicles in terms of technology, despite the fact that some other components influencing their performances remain similar to those of their conventional counterparts.
The subsonic commercial aircraft (Boeing B787-8) is considered advanced thanks to its innovative design and the new materials used in its construction, and perceived superior economic and environmental performances as compared to those of its conventional counterparts.
M. Janic´,Advanced Transport Systems,
DOI: 10.1007/978-1-4471-6287-2_2,Springer-Verlag London 2014
2.2 Bus Rapid Transit Systems
2.2.1 Definition, Development, and Use
The BRT (Bus Rapid Transit) systems are considered as a flexible rubber-tired rapid transit mode that combines stations, vehicles, services, running ways, and ITS (Intelligent Transport System) into an integrated system with a strong positive image and identity. Flexibility implies that these systems can be incrementally implemented as permanently integrated systems of facilities, services, and ame-nities that collectively improve the speed, reliability, and identity of bus transit in a variety of environments. In many respects, BRT systems can be considered as a rubber-tired LRT (Light Rail Transit)-like systems but with greater operating flexibility and potentially lower capital and operating costs (Levinson et al.2002). The BRT systems started in the U.S. (United States) in the 1960s through the implementation of exclusive bus lanes. After the first truly dedicated bus way of the length of several kilometers was set up in 1972 in Lima (Peru), the step forward in developing the BRT system concept was made in 1974; the first bus-based public transport network was developed in Curitiba (Brazil) using the bus-way corridors spread as the route/line network throughout the city. Since the mid-1990s, the BRT has been intensively promoted in U.S. cities as an advanced urban transit system to alleviate the adverse effects of traffic congestion compared to the conventional urban bus transit systems at the lower investment/capital costs compared to rail-based urban transit systems such as LRT (Light Rail Transit). At the same time, it has been expected to increase the transport capacity and make the accessibility of dense urban agglomerations/regions more effective and effi-cient. Designed and implemented on a case-by-case basis in order to meet the specific needs and characteristics of the given urban and suburban areas, the BRT systems have been characterized by the dedicated bus corridors, terminals/stations, vehicles/buses, fare collection system, ITS technology, operational concepts (timetable), and branding elements. Consequently, they have offered more effec-tive, efficient, faster, reliable, and punctual transport services under given condi-tions than conventional bus transit systems, which have approached or even exceeded the services of the rail-based systems (LRT). The main objectives behind implementation of the BRT concept have been to approach to the capacity and quality of services of LRT while at the same time benefiting from savings in infrastructure investment costs, flexibility of the bus transit system, and compa-rable fares for users/passengers.
1974 The first BRT (Bus Rapid Transit) system in the world—the ‘‘Integrated Transportation Network’’—begins operations in Curitiba (Brazil)
The BRT systems have shown flexibility in terms of feasibility of implemen-tation in urban agglomerations with a population of between 0.2 and 10 million. As such, in many transit corridors/routes, they have represented a test bed before implementing a rail-based urban transit system such as LRT.
Depending on the layout of the city/urban agglomeration, the BRT system can operate along radial and/or star-shape corridors exclusively or as a complement/ connection to the rail transit systems/lines. In addition to ‘Full BRT’ systems operating exclusively along dedicated bus-ways, ‘BRT Lite’ systems mainly operate along the mixed traffic lanes except in cases of passing through important intersections where it is given exclusive lanes.
Currently, BRT systems operate in 147 cities/metropolitan areas on all conti-nents. The total length of the dedicated bus-ways is about 3,741 km. The total daily number of passengers using the systems is about 24.5 million. Table2.1
gives additional characteristics of the BRT systems used around the world. Regarding the above-mentioned characteristics, the BRT system has been developed and consequently mostly used in South America and Asia, and the least in Africa. The relative market share of the system in the total number of daily commuting users/passengers indirectly reflects such developments. In addition, the daily number of users/passengers tends to increase almost exponentially as the BRT system network is extended as shown in Fig.2.1.
This indicates that the system is attractive for both existing users of public transit systems and those abandoning their cars for the first time.
LRT (Light Rail Transit), often considered as a strong competitor to the BRT system, can be defined as an electric railway system with a ‘‘light volume’’ capacity for passengers as compared to conventional (heavy) rail. Its performances are partially presented for comparative purposes. At present, 24 LRT systems operate in the U.S. In Europe, LRT systems have often been considered together with urban tramway systems. Some evidence indicates that 170 tram and LRT systems, comprising 941 lines of a total length of 8,060 km are in operation. In 21 cities, 154 existing lines have been extended by about 154 km and 21 new lines of a length of 455 km are under construction (ERRAC2005).
Table 2.1 Some characteristics of BRT systems in the world (http://en.wikipedia.org/wiki/ Bus_rapid_transit)
Europe 42 636 17 0.937 3.8
North America 20 585 15.6 0.849 3.5
South America 50 1,250 33.4 15.694 64.1
Asia 25 882 23.6 6.439 26.3
Africa 3 62 1.7 0.238 1.0
LRT systems may use shared or exclusive rights-of-way, high or low platform for users/passengers boarding/off-boarding, and multi- and/or single-car trains.
2.2.2 Analyzing and Modeling Performances
2.2.2.1 Background
The BRT systems are characterized by infrastructural, technical/technological, operational, economic, environmental, and social/policy performances. Consid-ered together, they allow the BRT system(s) to be distinguished generally in seven features as compared to conventional/standard urban bus transit system(s) as given in Table2.2(GAO 2012).
The performances of the BRT system are analyzed, modeled, and evaluated using indicators and their measures. Their values are synthesized as averages from 40 BRT systems operating around the world—13 in Latin and South America, seven in Asia, three in Australia, eight in Europe, and nine in the U.S. and Canada (Wright and Hook2007).
2.2.2.2 Infrastructural Performances
The main indicators of the infrastructural performances of BRT systems refer to the spatial layout of their networks/corridors/routes, the number/density of stations along the corridors/routes, and other characteristics.
D = 0.1212e0.0039L R² = 0.9386
0 2 4 6 8 10 12 14 16 18
0 200 400 600 800 1000 1200 1400
D - Passengers/da
y - million
L - Length of the network - km
Spatial layout of the network
The BRT system networks operate under the assumption of having regular and sufficient passenger/commuter demand to be served by the relatively frequent transport (bus, trolleybus) services over a given period of time (hour, day, year) (for example,C8,000 passenger/h/direction). Consequently, the transport infrastructure
network consisting of the corridors/routes with dedicated busways and terminals/ stations spread over, pass by and/or through densely populated/demand attractive areas of the given urban agglomeration—the city center(s) or CBDs (Central Busi-ness District(s)). A simplified spatial layout of the BRT network is shown in Fig.2.2. The BRT dedicated busways passing through the high density area continue outside it as right-of-way bus lanes. Both are connected to the freeway(s) sur-rounding the densely populated area(s) (CBDs). In some cases, the BRT dedicated busways or bus-only roadways are built along old rail corridors/lines. The dedi-cated busways are usually provided as two-way lanes in different directions in mixed traffic, as two-way lines on the same side or in the middle, or as a single line in each direction on different sides of the given corridor/route. In some cases, the bus-way is split into two one-way lanes/segments. The grade separation and ele-vation of BRT system routes is also provided, if needed, particularly at intersec-tions of the routes themselves and with those of other traffic. Particular BRT busways can also be painted (red, yellow, green) in order to enhance visibility and recognition—by both the other drivers and users/passengers.
Typically, the single BRT corridor spreads between two agglomerations, one of which could be housing and the other CDB, or both CDBs. Given the length of this corridor usually defined as the distance between the initial and the end terminal/
Table 2.2 Distinguishing features of the BRT systems compared to conventional bus systems (GAO2012; Levinson et al.2003a,b)
Feature Description
Running ways Segregated and dedicated busways or bus-only roadways Terminals/stations Enhanced environment (information provided through real-time
schedule systems and additional amenities—safety improvements, public art, landscaping, etc.)
Vehicles/buses Standard/articulated, different engine technology (diesel, gas hybrid diesel/electric, electric), quieter, higher capacity, wider (usually low-floor) doors
Services Faster, more frequent, punctual, and reliable
Fare collection Prepaid or electronic passes—speedy fare collection, and boarding on/off convenience
Branding Marketed as a distinguished service at the terminals/stations and vehicles/buses
ITS (Intelligent
Transportation Systems)
station, width, and the number and area of the terminals/stations along it, the total area of land directly taken for building this infrastructure can be estimated as follows (Vuchic2007):
A¼LDþnðldÞ ð2:1Þ
where
L is the length of corridor (km); D is the width of the corridor (m);
N is the number of stations/platforms along the corridor; and
l, d is the length and width of the plot of land occupied by the terminal/station
(m), respectively.
For example, the widthDof the exclusive bus-way (both directions) within the
BRT corridor varies depending on the speed from 10.4–11.6 m (for moderate speedsB70 km/h) to 14.60 m (for speeds up to 90 km/h). The typical length of the
bus stops varies froml = 18–26 m depending on the bus length (for a single bus).
The minimum width of the bus stop at the terminal/station is aboutd = 3.0–3.5 m.
However, the width of the area occupied by the terminal/station itself with the supporting facilities and equipment could be up to 9.0 m. For comparison, the typical (minimum) width of the corridor for building a double track LRT line respecting the vehicle’s dynamic envelope is about 7.5 m. The track gauge is 1,435 mm. The typical area of the platform of the LRT station can be from 12950 m (surface) to 20990 m (grade separated) (Vuchic 2007; Wright and
Hook2007).
Exclusive bus-way Right-of-way Freeway
Densely populated area or CBD
Number/density of stations
The terminals/stations are important elements for the safe, efficient, and effective inter and multimodal transfers on the one hand, and for demonstrating the identity and image of the given BRT system on the other. A BRT terminal/station can be a simple stop, an enhanced stop, designated station, intermodal terminal, and/or transit center. The number and density of stations mainly depends and increases in line with the length of the BRT system network as shown in Fig.2.3. In BRT systems around the world, except those in the People’s Republic of China, this increase is of an average rate of 2.0/km. For systems in the PR of China, the average rate is 1.0/km. The network length varies from about 2 to 60 km.
BRT terminals/stations usually have passing lanes and sometimes multiple stopping/docking bays, which enable the convoying of busses in different com-binations, if needed. The number of stopping/docking bays influences the required length of the given terminal/station as shown in Fig.2.4.
Evidently, the length of the BRT terminal/station generally increases more than proportionally compared to the increase in the number of stopping/docking bays. This length and other dimensions can be larger if the BRT terminal/station is integrated with terminals/stations of other public transport modes, for example, those of the underground public transport system.
Passenger access to the BRT terminals/stations—either on foot, by bike, car/ taxi, and other public transport systems—should be safe, efficient, and effective. This implies good integration including parking and short stop spaces at the rear of the stations, as well as providing convenient connections/passages to/from the bus platforms. In particular, at the BRT feeder-trunk systems, cross-platform transfers
China
from the feeder to the trunk buses, and vice versa, should be provided (see below). Some additional indicators of the infrastructural performances of the BRT system and a comparable LRT system are given in Table2.3.
l = 29.,848e0.229n R² = 0.988
0 50 100 150 200 250
2 3 4 5 6 7 8 9
l - Required
lenght - m
n - Number of substations and stopping bays
Fig. 2.4 Dependence of the required length of terminal/station on the number of substations and stopping/docking bays of the BRT system (Wright and Hook2007)
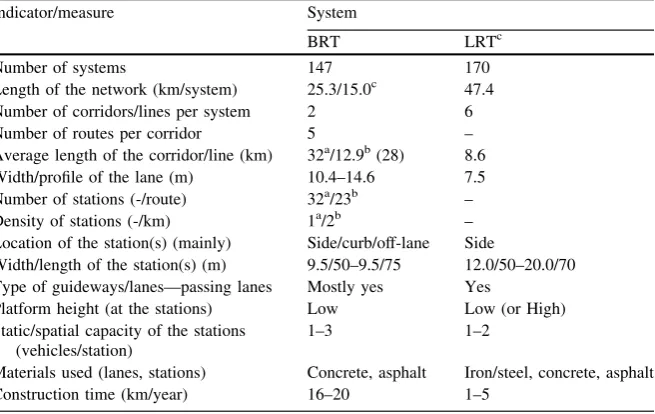
Table 2.3 Infrastructural performances of the BRT and LRT system—infrastructure (averages) (GAO2012; Levinson et al.2003a,b)
Indicator/measure System
BRT LRTc
Number of systems 147 170
Length of the network (km/system) 25.3/15.0c 47.4
Number of corridors/lines per system 2 6
Number of routes per corridor 5 –
Average length of the corridor/line (km) 32a/12.9b(28) 8.6
Width/profile of the lane (m) 10.4–14.6 7.5 Number of stations (-/route) 32a/23b –
Density of stations (-/km) 1a/2b –
Location of the station(s) (mainly) Side/curb/off-lane Side
Width/length of the station(s) (m) 9.5/50–9.5/75 12.0/50–20.0/70 Type of guideways/lanes—passing lanes Mostly yes Yes
Platform height (at the stations) Low Low (or High) Static/spatial capacity of the stations
(vehicles/station) 1–3 1–2
Materials used (lanes, stations) Concrete, asphalt Iron/steel, concrete, asphalt
Construction time (km/year) 16–20 1–5
2.2.2.3 Technical/Technological Performances
The technical/technological performances of the BRT system mainly relate to: (i) length, space (seats?stands) capacity, weight, type and power of engine(s), and
riding comfort of vehicles/buses; and (ii) ITS (Intelligent Transport Systems) including the systems for managing transit services along the network/routes, providing the users/passengers with the online information, and collecting fares.
Vehicles/buses
The BRTsystems generally use standard and/or articulated transport vehicles/ buses (and trolleybuses) with a typical length of 12, 18, or 24 m, a weight of 13, 17, or 24 tons, and the corresponding capacity (seats?stands) of 75, 100, or 160
passengers, respectively. The buses have 3–4 axles. The buses of the above-mentioned 40 BRT systems are generally powered by four types of engines: diesel and diesel Euro II/III/IV (26), CNG (Compressed Natural/Propane Gas) (7), hybrid (diesel?electricity) (3), and electricity (3). The diesel/buses use diesel fuel for
propulsion and electric power for auxiliary equipment. The CNG buses are powered by engines similar to diesel engines, but instead of diesel they use a methane mixture for propulsion. The hybrid diesel–electric vehicles/buses use an onboard diesel engine for producing electricity that charges their batteries. These in turn provide the electricity to run the electric propulsion motors. The electric vehicles—trolleybuses—use electricity from the overhead power supply infra-structure, i.e., from the catenary wire systems, for powering electric motors and auxiliary equipment. The typical engine power of BRT vehicles/buses is about 150–220 kW(kW–kilowatt). A summary of indicators of the technical/techno-logical performances for typical BRT and LRT vehicles is given in Table2.4:
An important characteristic of BRT vehicles/buses, sometimes more important than their size, is the number and width of doors. This influences utilization of vehicles/buses, consequently the route/line capacity, and otherperformances such as the average commercialspeed. Some longer buses have four doors, each about 1–1.1 m wide. Depending on the location of busways, they can be on the vehicle’s right or left side.
ITS (Intelligent Transport Systems) Systems for managing transit services
• Automated enforcement systems for exclusive bus lanes include the transit signal
priority and the queue jump system; the former changes the timing of the traffic signals in various ways in order to give priority to BRT vehicles/buses at inter-sections (for example, the system turns the red light to green if it ‘‘recognizes’’ the approachof a BRT vehicle to the intersection); the latter enables using the separate lane and receiving the green light signal upon closer approach to the intersection;
• The AVL (Automatic Vehicle Location) System is the computer-based system
enabling the real-time tracking of vehicles/buses and providing them with the information for the timely schedule adjustments and equipment substitutions; at the core of this system is GPS (Global Positioning Satellite) technology and GIS (Geographic Information System) displaying the location of the vehicles/buses on the route map grids in the dispatch center;
• The CAD (Computer-Aided Dispatching) and advancedcommunications system
enables adjusting dwell times at vehicle/busstops or transfer points, vehicle/bus headways, rerouting vehicles/buses, adding vehicles/buses to routes, and dis-patching new vehicles/buses to replace incapacitated vehicles/buses; the drivers exchange communications with the dispatch center by radiotelephones, cellular telephones, and/or mobile display terminals;
• The precision docking system uses sensors on the vehicles/buses and on the
roadside to indicate the exact place where the vehicle/bus should stop; this enables users/passengers to be in position for immediate boarding, which shortens dwell time(s) at the stops;
• The tight terminal guidance system uses sensors similar to those for precision
docking to assist the vehicles/buses in maneuvering in terminals with limited space; the system can contribute to minimizing the amount of space for bus terminal operations, as well as to reducing the overall time the bus spends at the terminal/station; and
Table 2.4 Technical/technological performances of the BRT and LRT system vehicles (averages) (AUMA2007; CE2008; STSI2008; Vuchic2007; Janic2011)
Indicator/measure System
BRT LRT
Length of a vehicle (m) 12/18/24a 14–30a
Height of a vehicle (m) 3.0–3.2 4.0–6.9b
Width of a vehicle (m) 2.5–2.6 2.20–2.65
Cars/vehicle 1 2–4
Capacity (spaces/vehicle) 75/100/160 110–250
Seat spacing (m) 0.80 0.75–0.90
Number of axles/vehicle 3/4/4 4/6/8
Tare weight (tons) 13/17/24 25.4–38.8
Engine power (kW) 150–220 200–434
Maximum speed (km/h) 90–100 60–120
Operating speed (km/h) 27–48 40–80
• The warning system aims at assisting/warning the vehicle/bus drivers in order to
avoid collisions, pedestrian proximity, and low tire friction; this improves the-safety, efficiency, and effectiveness of the BRTsystem’s operations.
User/passenger information system
The user/passenger information system at the terminals/stations and onboard the vehicles/buses provides advance information contributing to the efficiency and effectiveness of travel decisions. For the former, displays provide real-time information on forthcoming arrivals/departures, transfer times and locations, and maps of the related routes/lines. For the latter, the system automatically announces the vehicle/bus approaching its next stop, giving sufficient time for preparation, speeding up disembarking and embarking, and consequently shortening dwell time at the terminals/stations (see below).
Fare collection systems
The BRT systems generally use three mainly automatedsystems for collecting fares: (i) preboard, onboard, and free-fare collection and verification. Of the 40 of the above-mentioned systems, 16 employ preboard, 21 onboard, and 3 free-board fare collection systems. In particular, the onboard system speeds up the fare col-lection process and eliminates expensive cash handling operations at transit agencies using smart cards. The system uses the read-and-write technology to store the monetary value on a microprocessor chip inside a plastic card. As passengers board a vehicle/bus, the card reader determines the card’s value, debits the appropriate amount for the busride, and writes the balance back onto the card, all within a fraction of a second.
2.2.2.4 Operational Performances
Operational performances of the BRT system include demand, capacity, quality of service, size of fleet, and technical productivity. They are analyzed and modeled based on the above-mentioned global BRT systems. The corresponding figures for LRT systems are also provided for comparative purposes.
Demand
usually represented by the disutility function of using the given transit system (i) between given pair of origin and destination (k) and (l), respectively,Ui/kl(T),
can be estimated from either the aggregated trip generation data or disaggregate passenger survey data, both for a given period of time (T). The MNL
(Multi-nomial) Logit model can then be applied to quantify the market share or the probability of choosing the system (i) as follows (TRB2008a):
pi=klð Þ ¼T
I is the number of transport systems offering transit services between the origin
(k) and destination (l).
The number of users/passengers choosing the system (i) can be estimated from Eq.2.2a as follows:
qi=klð Þ ¼T pi=klð Þ T qklð ÞT ð2:2bÞ
where
qkl(T) is the total number of users/passengers traveling between the origin (i) and
destination (k) during the time period (T) by all available transport
systems.
The user/passenger demandqkl(T) in Eq.2.2bcan be estimated by applying one
of the causal-gravity-type models based on the trip generation/attraction socio-economic forces of the origin (i) and the destination (k), and the travel
‘‘resis-tance’’ between them (Janic2010; Vuchic 2004).
The user/passenger demand qi/kl(T) in Eq.2.2b includes the demand between
the origin (k) and destination (l) as well as the demand between each pair of the
vehicle/bus stops along the corridor/line (kl) as follows:
qi=klð Þ ¼T qi=klð Þ þT
station/stop (m), and the station/stop (m) and the destination
(l), respectively, during the time period (T);
qi=mnð ÞT is the user/passenger demand between the stations/stops
Demand for BRT services mainly consists of daily users/passengers commuting from their home to the place of a given activity (work, shopping, entertainment, others), each located within or outside the given urban agglomeration (or CBD), and vice versa. The potential demand for the BRT, as well as for other urban public transport systems, can be influenced by the size of population, which in turn can influence employment and other commercial and entertainment activities in the given CBD. Figure2.5shows an example of the relationship between the size of urban population and employment in a CBD as the potential demand for the given BRT system.
Generally as intuitively expected, a larger urban population can generate pro-portionally greater employment in the CBD at an average rate of about 118 thousands employees per 1 million of population (as in the above example). Figure2.6shows an example of the relationship between the number of employees in CBD and the number of daily (weekday) users/passengers of BRT systems.
As expected, higher employmentin the CBD generally generates a higher daily demandfor urban transit including, in this case, the BRT.
Capacity
The transit capacity of the BRT system is one of the most important indicators of its operational performances mainly due to the requirement to transport relatively large numbers of users/passengers under given circumstances. This capacity can be considered for a single terminal/station, route/line, and the entire network pro-viding the vehicle/bus capacity is given.
CBEe = 118.91P - 60.504 R² = 0.960
0 200 400 600 800 1000 1200 1400 1600 1800 2000
0 2 4 6 8 10 12 14 16 18
CDB
e
- Employ
met - thosuands
P - Population of urbanized area - million
Service network
The BRT system can generally operate as a ‘‘direct or convoy’’, ‘‘trunk-feeder,’’ and ‘‘hybrid’’ service network. The layout of the former two is shown in Fig.2.7.
• Direct or convoy network consists of routes and related BRT services
con-necting different user-passenger origins and destinations, which can be both within and outside a given urban agglomeration. In such case, many different bus services/lines connecting particular sets of these origins and destinations operate within the common/main part of the network(s) and then spread outside it toward the periphery of the given agglomeration. Consequently, a high
Q = 0.304CDBe+ 8.794 R² = 0.803
0 20 40 60 80 100 120 140
0 50 100 150 200 250 300 350 400
Q - BRT
sy
stem
users/pa
ssengers - 000/day
CDBe- employment - 000/CDB
Fig. 2.6 Relationship between the daily number of users/passengers of the BRT system and employment in the CBD (GAO2012; Levinson et al.2003a,b; Wright and Hook2007)
T1 T2
T1
Feeder services
Feeder services Direct or convoy services
Direct services
Trunk services
Transfer terminals - T1,T2 (a)
(b)
frequency of mainly direct services (with no or few transfers) is provided to those users/passengers traveling within the parts of the common/main network. The demand served through the main part of thenetwork by the given BRT service/line during the time period (T) estimated as in Eqs.2.2a–c is: Q(T):qkl(T), where (k) is the origin (k=1, 2…,K) and (l) is the destination
of the user/passenger flow(s) (l =1, 2,…,L).
• Trunk-feeder network consists of the feeder and trunk part. The feeder part
represents the local network connecting the user/passenger origins and desti-nations to the trunk terminal(s)/station(s) by services usually operated by lower capacity (conventional) vehicles/buses. The trunk terminals are mutually con-nected by services usually operated by the larger (articulated) and/or bi-artic-ulated vehicles/buses. In any case, the size of vehicles/buses and service frequency can be easily adapted to the volumes of user/passenger demand. However, the users/passengers are forced to change at the trunk terminals/ stations, which does not exclude potential necessary changes at the stations between them.
• Hybrid networkrepresents a combination of a direct or convoy and trunk
net-work set up to appropriately adjust the offered capacityto changes in user/ passenger demand. This implies flexibility in adapting to the time and spatial pattern, volumes, and intensity of this demand. Consequently, this network possesses the combined features of both sub-networks it is comprised of.
The volumes of demand are generally different on the feeder and the trunk route(s) of the trunk-feeder network(s). For example, on the feeder route con-necting the origin (k) and the trunk terminal/stationT1, the volume of this demand
during period (T) is:QðTÞ qk;T1ðTÞ ¼PLl¼1qklðTÞ(k=1, 2,..,K). On the trunk
route between the transfer terminals/stations T1 and T2, this volume is: QðTÞ qT1;T2ðTÞ ¼PkK¼1PLl¼1qklðTÞ, for k =l. Finally, on the feeder route
connecting the trunk terminal/stationT2and the destination (l), the volume of user/
passenger demand is: QðTÞ qT2;lðTÞ ¼PKk¼1qklðTÞ (l=1, 2,.., L). The user/
passenger demandqk,T1(T),qkl(T), andqT2,l(T) can be estimated as in Eqs.2.2a–c.
Consequently, the main differences between the above two network configurations are as follows:
• At the direct or convoy service network, the lower capacity BRTvehicles/buses
directly operate between particular origin and destination terminals/stations. In this case, the volumes of user-passenger demand per origin–destination pair are usually lower, resulting in the lower service frequency and the lower loadfactor per frequency given thevehicle/bus size/space capacity; as mentioned above, the capacity of these vehicles/buses is usually 70–75 spaces (seats?stands) (12 m
length).
• At the trunk-feeder service network, feeder vehicles/buses of a capacity of