TOOLS
FOR CONSERVATION
Cecily M. Grzywacz
Monitoring for
Gaseous Pollutants
Monitoring for Gaseous
Pollutants in Museum
Environments
Cecily M. Grzywacz
Jeanne Marie Teutonico,Associate Director, Programs
The Getty Conservation Institute works internationally to advance conservation and to enhance and encourage the preservation and understanding of the visual arts in all of their dimensions—objects, collections, architecture, and sites. The Institute serves the conservation community through scientific research, education and training, field projects, and the dissemination of the results of both its work and the work of others in the field. In all its endeavors, the Institute is committed to addressing unanswered questions and promoting the highest possible standards of conservation practice.
Getty Publications 1200 Getty Center Drive
Los Angeles, California 90049-1682 www.getty.edu
© 2006 J. Paul Getty Trust Mark Greenberg, Editor in Chief Sheila Berg, Project Editor
Elizabeth J. Maggio, Technical Editor Pamela Heath, Production Coordinator Hespenheide Design, Designer
Library of Congress Cataloging-in-Publication Data
Grzywacz, Cecily M.
Monitoring for gaseous pollutants in museum environments / Cecily M. Grzywacz. p. cm. — (Tools for conservation)
Includes bibliographical references. ISBN-13: 978-0-89236-851-8 (pbk.) ISBN-10: 0-89236-851-9 (pbk.)
1. Museum buildings—Environmental engineering. 2. Indoor air pollution—Measurement. 3. Air quality management. 4. Art Objects—Protection. 5. Gases—Analysis. I. Title. II. Series.
TH6057.M87G79 2006 628.5'30287—dc22
2006005905
Every effort has been made to contact the copyright holders of the photographs in this book to obtain permission to publish. Any omissions will be corrected in future editions if the pub-lisher is contacted in writing.
v Foreword
vii Preface
xi Acknowledgments
Chapter 1 1 Gaseous Pollutants in Museum Environments: Overview
Chapter 2 11 The Effects of Gaseous Pollutants on Objects
Chapter 3 21 Introduction to Passive Sampling
Chapter 4 29 Passive Sampling Devices
Chapter 5 53 Planning and Conducting an Air Quality Monitoring Program
Chapter 6 73 Interpreting Results and Mitigation Considerations
Chapter 7 85 The J. Paul Getty Museum Monitoring Program, 1996–1998
Appendixes 95 1. Major Gaseous Pollutants of Concern to Museums, Their Sources,
and At-Risk Materials
107 2. Current Target Levels for Key Gaseous Pollutants in Museums
111 3. Materials Testing
115 4. Protocols for Preparing and Analyzing Passive Sampling Devices
for Organic Carbonyl Pollutants
References 141
Selected Bibliography on 161
Since its inception, the Getty Conservation Institute has been committed to preventive conservation and the care of collections. Its earliest scientific endeavors focused on air pollution and its effects on collections, including monitoring pollutant levels in museums, the effects of pollutants on artists’ materials, protection of works of art from pollution, and modeling of pollutant distributions in galleries. The results of this research were dis-seminated to the museum conservation community through various conservation and scientific journals as well as through conservation courses developed and presented by the GCI’s Training Program. These courses took place between 1991 and 1996 in North America, the United Kingdom, and Latin America. A component of the courses dealt with environmental issues, including gaseous pollution and the risk it posed to collections. After participating in the course, Cecily Grzywacz helped to extend the GCI’s environmental research by exploring ways in which museums could moni-tor for gaseous pollutants with passive sampling devices. This further developed into the creation and testing of protocols for extracting valid, statistically viable data from these devices.
This book is the synthesis of Cecily Grzywacz’s years of work in testing museum environments. What began as a literature review on the effect of air pollution on materials in the conservation and scientific fields—with a section on air quality monitoring—has evolved into a hand-book on air quality monitoring for museum environments. Although Cecily has shared her findings over the years with many museum profes-sionals, this publication makes air quality monitoring available to a wider audience, not only those in museums, but also in the larger community of cultural resources managers responsible for collections.
Monitoring for Gaseous Pollutants in Museum Environments
is the first book to specifically address air quality monitoring in galleries, storage areas, display cases, and storage cabinets. The methodology it presents can be implemented without an extensive scientific background. It is our hope that it will give professionals the necessary tools to under-stand the risk of gaseous pollutants to various collections and to conduct their own air quality monitoring studies.
Timothy P. Whalen Director
“Telemachus, we must get the armour together and take it down inside. Make some excuse when the suitors ask you why you have removed it. Say that you have taken it to be out of the way of the smoke, inasmuch as it is no longer what it was when Ulysses went away, but has become soiled and begrimed with soot.”
Homer, The Odyssey, Book XIX (800 b.c.e) In its broadest sense, a pollutantis a substance that has a detrimental
effect on the environment or on something of value (including health) and is present in the atmosphere in amounts greater than natural concentra-tions, primarily due to human activity. Cultural property inside museums can be threatened both by outdoor pollutants, such as gases from car exhaust that make their way into buildings, and by pollutants generated from sources within museums, such as fumes from cleaning products. In most situations, indoor-generated pollutants pose a greater risk to collec-tions than outdoor-generated pollutants. Typically, this is because the indoor source is in close and continuous proximity to objects. A wide range of materials, from textiles and works of art on paper to pigments and leather bindings, are at risk of damage from gaseous pollutants.
Damage to collections has been observed and documented since antiquity. One of the oldest writings may be Homer’s description of protecting armor from soot. However, the link between object damage and air pollution was not always recognized. In 1965 Thomson wrote one of the first works in conservation literature on contamination in museums: “Air Pollution: A Review for Conservation Chemists.” The increasing awareness of the effects of air pollution on cultural heritage was elabo-rated by Thomson in The Museum Environment (2d ed. 1994).
In the late 1980s studies were undertaken on the concentra-tions of gaseous pollutants in museums and libraries. Since that time air pollution research has continued by conservators, conservation scientists, universities, governmental agencies, and industry. Most important, the risk of indoor-generated gaseous pollution was identified and investi-gated. This body of research led to the publication of several books. Hatchfield’s Pollutants in the Museum Environment: Practical Strategies for Problem Solving in Design, Exhibition, and Storage (2002) was the
does not discuss monitoring. Tétreault followed with an impressive litera-ture review on air pollution, Airborne Pollutants in Museums, Galleries and Archives: Risk Assessment, Control Strategies and Preservation Management(2003a), which covers materials damage extensively. It
applies risk assessment and preservation management tools developed by Michalski and Waller to air pollution in museum, galleries, archives, and libraries (Michalski 1990, 1993, 1996, 2000, 2002; Waller and Michalski 2004, 2005). And now, this book, Monitoring for Gaseous Pollutants in Museum Environments, provides necessary information to determine if
pollutants are present and, if so, their concentrations.
This book is a synthesis of my twenty years of air quality monitoring research. My goal is to provide the most current information on detecting gaseous pollutants that are a risk to collections for conserva-tors, collection managers, curaconserva-tors, registrars, and private collectors. Passive sampling techniques are the focus of this book because they are relatively inexpensive, easy to use, and readily available.
Chapter 1 provides an overview of the history and nature of pollutants of concern to museums and explores the challenges for scien-tists, conservators, and collections managers in developing target pollu-tant guidelines to protect cultural property. Although some pollupollu-tants are particles, this book focuses on gaseous pollutants, since they are impossi-ble to see or detect without air quality monitoring and thus can attack objects for a long time before actual damage becomes visible. The photo essays in chapter 2 illustrate the damage that these gaseous pollutants can cause. Chapter 3 discusses the criteria for using passive sampling devices in museum environments. The products currently available to the conser-vation field are presented in chapter 4; tables 4.2 through 4.5 present detailed information on the various types of samplers.
The development of an air quality monitoring program is cov-ered in chapter 5. Here I stress the importance of defining the objective of the testing for pollutants; for example, is it necessary to quantify pollu-tant concentrations, or is the absence or presence of a particular gas sufficient information? Appropriate planning maximizes precious fiscal and staff resources. Chapter 6 discusses what to do with the results obtained, both in terms of understanding the numbers and in terms of eliminating or minimizing the risk from gaseous pollutants. Ultimately, what is important is using the results of air quality monitoring for the preservation of the collections.
Chapter 7 describes the implementation of the information presented in this book in an extensive air quality monitoring program undertaken at the J. Paul Getty Museum at the Getty Center from 1996 to 1998.
tests, along with references, are listed in Appendix 3 to enable the selec-tion of appropriate materials for use in proximity to objects. Finally, pro-tocols for the preparation and analysis of two types of PSDs are provided in Appendix 4. A selected bibliography on damage to museum collections by gaseous pollutants follows the references at the end of the book.
Many scientists and museum professionals have been integral to my work over the years. Through my initial research on indoor-generated pollutants, I met Norman Tennent, a private conservation scientist based in Glasgow, Scotland; our collaboration led to the investigation of loca-tions with visible damage from pollutants. Norman introduced me to many scientists, conservators, and collection managers, all of whom added to my body of knowledge. Most important, he introduced me to Lorraine Gibson, who was then completing her Ph.D. at the University of Strathclyde. Lorraine and I collaborated for several years on the eval-uation of passive samplers for the conservation field. Soon we joined forces with Agnes Brokerhof of the Netherlands Institute for Cultural Heritage (ICN) to conduct research on the detection of organic carbonyl pollutants. In 1998, what started out as a meeting to discuss our
research became a two-day conference, “Museum Pollution: Detection and Mitigation of Carbonyls.” More than thirty delegates from the United Kingdom, the Netherlands, Denmark, Canada, and the United States attended. From this conference, the Indoor Air Pollution Working Group was initiated. In particular, I would like to acknowledge the contributions of the following members of this group: Morten Ryhl-Svendsen, National Museum of Denmark; Jean Tétreault, Canadian Conservation Institute; Maarten van Bommel, ICN; and Simon Watts, Oxford-Brookes University. Over the years I have had the opportunity to work with several laboratory assistants who contributed to the GCI’s environmental research, including Kristina Chadwick, Andrea Gailunas, Karen McKabney, Leo Perry, and especially Gisela Brock, who always knew what I wanted and needed before I finished my requests.
I have pursued pollution monitoring to assist conservators, collection managers, registrars, curators, museum professionals, and facil-ities managers and engineers with their questions and concerns about indoor air quality in display and storage areas. I am indebted to them for their interest and encouragement. In particular, I would like to thank Brian Considine, John Donohoe, Pamela Hatchfield, Abby Hykin, and Jerry Podany. There are many others; I wish there was sufficient space to recognize all of them.
mentorship and confidence; Giacomo Chiari for his support, guidance, and special balance; and Michael Schilling, my colleague, friend, and supervisor. Kathleen Dardes not only included me in the many GCI Preventive Conservation courses but also offered guidance and wisdom from which I continue to benefit. The GCI Information Center, especially Valerie Greathouse, reference librarian; Thomas Shreves, reference librarian; and Cameron Trowbridge, manager of research services, has provided invaluable assistance with my research over the past twenty-one years. I would also like to thank Timothy P. Whalen, director of the Getty Conservation Institute, and Kristin Kelly, assistant director.
Many passive sampling device vendors, analysts, and researchers took the time to discuss and understand the issues of air pollution in museums. Don Schaeffer and the board of Ogawa & Co., USA, Inc., were especially helpful.
Elizabeth Maggio, a highly skilled editor, was instrumental in tightening my original manuscript. We worked well together and learned from each other. I also wish to acknowledge the efforts of Cynthia Godlewski, GCI senior project manager, and the J. Paul Getty Trust Publications team: Ann Lucke, managing editor; Pamela Heath, production coordinator; Sheila Berg, project editor; and Gary
Air Pollution
Contaminated air is not just a phenomenon of modern times. It is easy to imagine that in the prehistoric era, smoke from cave fires obscured the details of art applied to cave walls. During Roman and medieval times in Europe and China, copper smelting produced prodigious amounts of air-borne pollutants that were eventually deposited in Greenland (Hong et al. 1996). The vibrant colors of Michelangelo’s wall paintings in the Vatican’s Sistine Chapel were dulled by smoke from centuries of burning candles.
Beginning with the industrial revolution, the health threat caused by air pollution increased tremendously. By the mid-1900s, notable episodes of poor air quality brought pollution concerns to world attention. In 1952, for example, thousands of people died in London dur-ing five days of acute levels of smog. Four years earlier, sulfur dioxide emissions from industrial plants near Donora, Pennsylvania, had sickened 40 percent of the population and killed twenty people and many animals. In the United States, such disasters led to the enactment of legislation, most important, the Clean Air Act of 1990 (U.S. EPA OAR 1990).
Today, photochemical smog is a common occurrence in major metropolitan areas such as Los Angeles, Mexico City, Houston, and London.1 But air pollution is no longer localized in large urban or industrial centers. Global wind currents can spread pollution far from its sources, resulting in regional pollution (Millan et al. 1996a). Gases detected in remote areas have been linked to vehicles and industries many kilometers away (Granby and Christensen 1997; Jaffe et al. 2003). Even areas once considered pristine now have serious air quality problems, such as Grand Canyon National Park in Arizona and Yosemite National Park in California (Kleiner et al. 2000; U.S. National Park Service, Air Resources Division 2005).
agencies are no longer required to monitor for this pollutant. This is true for most of Southern California, especially in the Northwest Coastal Region, where both the J. Paul Getty Museum at the Getty Center and the J. Paul Getty Museum at the Getty Villa are located (SCAQMD 2002). On the other hand, newly developing countries are producing high concentra-tions of pollutants such as sulfur dioxide because of their increasing use of poor-grade fuels (Blanchard 1992; Chuang et al. 1992; Gorman 2000).
Outdoor-generated versus Indoor-generated Pollutants In Museums
In the outdoors, pollution is a function of climate, geography, the number and type of industries and vehicles, the fuel used, and so on. For instance, an island may have good air quality in spite of high vehicular and indus-trial emissions because pollutants are blown out to sea and diluted, whereas land-locked cities or those in basins, such as Los Angeles, tend to have poor air quality. Warm climates have higher concentrations of outdoor-generated pollutants (Millan et al. 1996b). Geography and tem-perature inversion layers can trap pollutants for days or weeks (Manahan 1994; Wilbraham et al. 1993), producing the familiar orange-brown haze of photochemical smog over major urban centers.3 Schwab et al. (1993) report on seasonal and yearly trends.
Outdoor pollutants can enter a building, especially a naturally ventilated building (Druzik 1991), and pose a risk to collections. Natu-rally ventilated buildings have indoor concentrations of pollutants that are nearly equal to the outdoor levels. However, buildings with heating, ventilation, and air-conditioning (HVAC) systems that have gas-phase filtration minimize the infiltration of pollutants, reducing the indoor level to as low as 5 percent of the outdoor concentration. The major outdoor pollutants that are found inside museums and that pose a risk to cultural property are sulfur dioxide, nitrogen dioxide, nitrogen oxide, ozone, and reduced sulfur gases such as hydrogen sulfide.
The most common indoor-generated gases that pose a serious risk to cultural property are acetic acid, formic acid, acetaldehyde, formaldehyde, hydrogen sulfide, carbonyl sulfide, and ozone. Inside muse-ums, these pollutants can be off-gassed from paints, boards, carpets, and cleaners, as well as many other materials and products. They can also be generated during such processes as cooking, cleaning, and heating. Cigarette smoke is a source of formaldehyde and other toxic compounds (Moree-Testa and Saint-Jalm 1981); whereas smoking in museums is heavily restricted in the United States, this is not always the case else-where in the world. The amount of a given pollutant that is generated depends on the nature of the source materials (Andersen, Lundqvist, and Mølhave 1975), the kinds and intensity of indoor activities (Chuang et al. 1992), and the efficiency of air-exchange and ventilation systems. Of course, many other gases—acetone, limonene, carbon dioxide, hexane— are generated indoors, but, fortunately, most of these volatile organic compounds do not damage collections.
con-stituent of photochemical smog that forms outdoors, can also be pro-duced indoors by air purifiers (U.S. EPA OAR 1998) and dry-process photocopiers (Brown 1999). Formaldehyde is typically associated with indoor pollution, especially from consumer products (Kelly, Smith, and Satola 1999) such as plywood and other composite boards (Andersen, Lundqvist, and Mølhave 1975). But levels of outdoor-generated formal-dehyde and related compounds are increasing, especially from the use of alcohol-based fuels, as documented in several studies (Anderson et al. 1996, 1999; Anderson and Lanning 1999; de Andrade, Miguel, and Seinfeld 1999; de Andrade, Pinheiro, and Andrade 1995; Tanner et al. 1988; Yano, Ito, and Takehata 1986).
Gaseous Pollutant Terminology
For the most part, the chemical terms used in this book and listed on devices used to monitor air quality are straightforward: ozone, sulfur dioxide, nitrogen oxides, hydrogen sulfide. These are individual chemical compounds. However, certain pollutants belong to two classes of chemi-cals whose terms are often encountered in monitoring air quality, volatile organic compounds (VOCs) and organic carbonyl compounds.
Volatile Organic Compounds
VOCs are hydrocarbons that exist as gases at ambient temperatures and are generated both indoors and outdoors. Hundreds of VOCs can be detected inside nearly all buildings because they off-gas from a wide variety of sources: construction materials, solvent-based paints, primers, varnishes, aerosol sprays, cleaners, and disinfectants. Even the breath and perfume of museum visitors are sources of VOCs. The level of all VOCs in a building is, in a broad sense, indicative of overall air quality. Some pollutant moni-tors specifically detect all VOCs and average them into one number, called total VOCs, which is based on the calibration for a specified VOC gas, for example, hexane or toluene. With one notable exception, VOCs have not been linked to materials damage.
Organic Carbonyl Pollutants
Although many VOCs contain carbonyl groups, the organic carbonyl pol-lutants of primary concern to museums are formaldehyde and acetalde-hyde (referred to collectively as aldeacetalde-hydes) and formic acid and acetic acid (organic acids). All four organic carbonyl pollutants are primary pol-lutants off-gassed from a source. In addition, acetic acid and formic acid can be secondary pollutants formed from the oxidation of acetaldehyde and formaldehyde, respectively.
Monitoring for Gaseous Pollutants in Museums
pollutants generated indoors. Reaching this goal begins with adequate monitoring of the indoor air quality in museum environments. Here, “monitoring” refers to the determination of the presence of gaseous compounds in air that may damage collections, either directly or through conversion to secondary products.
Interest in museum environments can be traced to 1899, when Loftus St. George Byne published what is believed to be the first docu-mented report of damage to collections from storage conditions (Byne 1899). Byne described the corrosion of shell specimens but wrongly attributed the cause to the decaying animal inside them. In fact, the cor-rosion is caused by acid vapors released from certain types of wood used for storage and display. Despite Byne’s misinterpretation of what was happening to the shells, the damage is still referred to as Byne’s Disease (Byne’s Efflorescence is a more appropriate term because this is not a dis-ease that spreads to other objects). Since then, an increasing number of accounts of materials damage from gaseous pollutants have been pub-lished (see Selected Bibliography).
Since the early 1970s, the number of reports of damage to museum collections has increased. In 1987 the publication of
Formaldehyde: How Great Is the Danger to Museum Collections?
(Hatchfield and Carpenter 1987) drew international attention to the problem posed by this organic carbonyl pollutant.
In 1985 the Getty Conservation Institute (GCI) began the first major, long-term research program into the risks posed to museum collec-tions by atmospheric pollutants (Preusser and Druzik 1989). The initial focus was on outdoor pollutants that enter museums, such as nitrogen oxides, ozone, and sulfur dioxide. The research program later expanded to include indoor-generated pollutants, especially organic carbonyl pollu-tants (e.g., formaldehyde, acetaldehyde, formic acid, and acetic acid), which are potentially devastating for cultural material (Grzywacz 1989).
The first GCI investigation, from 1986 to 1989, involved sev-enteen museums in the United States. Samples collected from galleries, storage rooms, display cases, and storage cabinets revealed that high levels of aldehydes correlated with construction materials, a finding sup-ported by earlier research that showed a connection between formalde-hyde pollution and pressed board used in mobile home construction (Norsted, Kozinetz, and Annegers 1985; Pitts et al. 1989; Stock et al. 1985; U.S. EPA 2001).
The lowest concentrations of pollutants were detected in areas with good ventilation and high air circulation, such as galleries and arti-fact storage rooms. The highest concentrations were found in display cases or storage cabinets, where air circulation was restricted, allowing pollu-tants to build up over time. Of the four organic carbonyl pollupollu-tants, formaldehyde was present in the highest concentration in the majority of the nearly six hundred locations sampled. This study illustrates why muse-ums should select construction materials carefully. (See Appendix 3.)
organic carbonyl pollutants. Higher concentrations of organic carbonyl pollutants were detected in areas with damaged objects. And, more important, acetic acid was the predominant pollutant (Grzywacz and Tennent 1994; Tennent and Grzywacz 1993). This supported the hypothe-sis that organic acids are the attacking species.
From 1996 to 1998, the GCI collaborated with the J. Paul Getty Trust Facilities Department and the J. Paul Getty Museum Decorative Arts and Sculpture Conservation Laboratory to study the indoor air quality of the J. Paul Getty Museum at the Getty Center. Air quality monitoring was conducted during the final phases of construction, art installation, opening ceremonies, and the first few months after open-ing. This monitoring program is described in chapter 7.
In 1998 the GCI Science Department and the J. Paul Getty Trust Facilities Department began another study of the air quality in the J. Paul Getty Museum at the Getty Center. This time the purpose was to track the service life of the HVAC system’s gaseous filtration media.
Other museums have conducted air quality monitoring surveys as well. Brimblecombe et al. (1999) studied air quality at the Sainsbury Centre for Visual Arts in the United Kingdom. Eremin and Wilthew (1998) and Eremin and Tate (1999) evaluated the air quality at the new National Museum of Scotland. Camuffo et al. (1999, 2001) monitored several European museums to determine mitigation method-ologies to improve the preservation of the collections. Their work and others can be found in the reports of the Indoor Air Pollution Working Group. Sturaro et al. (2003) conducted environmental monitoring at the Kunsthistoriches Museum in Austria.
Challenges to Developing Standards for Pollutants in Museum Environments
When exposed to pollution, people are more resilient than is art. Living organisms have defense systems and are capable of limited self-repair in response to attack. For people, it is reasonable to assign threshold limits or maximum exposure levels to harmful pollutants. In contrast, any chemical reaction between a pollutant and an object causes damage to the object. Although the damage may be at the molecular level and not yet visible, irreversible chemical changes have occurred. This is one reason that pollutant monitors for use in museums require extremely low detec-tion limits, typically on the order of parts per billion (ppb). These levels are two to three orders of magnitude lower than regulations established by the U.S. Department of Labor’s Occupational Safety and Health Administration (OSHA), and in some cases the difference is even larger. For example, silver tarnishing by hydrogen sulfide occurs at the parts per trillion (ppt) level (Watts 2000), which is six orders of magnitude lower than the parts per million (ppm) range set by OSHA for humans.
Technological developments over the past twenty years have permitted detection of ever lower concentrations of gaseous pollutants more accurately and more precisely. However, the big question is, what do the numbers really mean in terms of setting limits to protect cultural property?
damage of cultural materials (see chap. 2). Also, many parameters con-tribute to an object’s overall risk of damage from a gaseous pollutant, and they must be considered and accounted for when determining exposure standards. Pollutants attack materials to different degrees (see discussion of Byne’s Disease, chap. 2 and fig. 2.5), which is a function of what the object is made of and the specific composition of those materials. The integrity of the object (e.g., the quality of the materials and the object’s history and storage conditions) and environmental conditions (e.g., rela-tive humidity and temperature), as well as past conservation treatments, all play a role in the overall risk of damage.
Furthermore, we cannot ignore synergy for indoor climates and microclimates: the risk of damage from a mixture of pollutants may not be simply the additive effect of the materials’ risks to each pollutant (Brimblecombe 1999, 2000). The synergistic effects of specific pollutant combinations on several materials, including papers, metals, stone, clays, and calcareous materials, have been studied (Bradley and Thickett 1999a; Johansson 1990; Klumpp, Heitmann, and Schwuger 1993; Svensson and Johansson 1996). Because of these and the many other parameters that contribute to potential damage from pollutants, all-encompassing expo-sure standards are impossible to establish (Gibson 1999b).
Complicating the problem of setting pollutant standards for museums is the need to consider that pollutant concentrations are typically measured in environments where damage has already occurred. We do not know which pollutants were present at the onset of deterioration or their concentration, when the damage actually occurred, or how long it took to develop. Often the onset of damage is gradual and goes unnoticed, espe-cially for objects in storage. When the damage is discovered, the cause may be misattributed to a current event, as was the case at the Kunsthistorisches Museum in Vienna (see sidebar “Monitoring in Action: Kunsthistorisches Museum”).
The end result of an air quality monitoring program is the pollutant concentration at the time of sampling. Yet the link between that number and the risk to various materials in typical air compositions has not been fully researched and understood. This is an arduous task, one that is being undertaken by researchers seeking to quantify the risk pre-sented to various materials.
Current Target Guidelines for Indoor Air Pollutants
The development of air pollution standards for museum use is an ongoing endeavor. Still, progress is being made on several fronts. For example, rec-ommendations for indoor air pollutant standards developed by the GCI and the Canadian Conservation Institute were incorporated in the pollution guidelines included in the American Society for Heating, Refrigerating, and Air-Conditioning Engineers (ASHRAE) chapter “Museums, Libraries, and Archives” in its Applications Handbook (Baker and Grzywacz 2003). These
recommendations are reviewed every four years and revised accordingly; Grzywacz is the current coordinator of future revisions.4
Adverse Effects Level (NOAEL), which is widely used to set standards for pharmaceuticals and pesticides, for preventive conservation. “NOAEL” refers to the greatest concentration or amount of a substance, found by experiment or observation, that causes no detectable adverse effect. Tétreault combined experimental data with theoretical information and exposure time to develop a Low-Observable Adverse Effects Level (LOAEL) system to classify pollutant concentration levels based on the susceptibility of the materials and the length of exposure (Tétreault 2003).
Appendix 2 is a table of current target pollutant levels for museums derived from the best available sources. Because these recommen-dations are based on data from limited research, museums should use them as a guide to making their own decisions about what risks certain pollu-tants pose to materials in their collections. Updates may become available on the websites of the Indoor Air Pollution Working Group, GCI, and the Canadian Conservation Institute (see sidebar “Useful Websites”), as well as in literature available at Art and Archaeology Technical Abstracts’ AATA Online, a comprehensive database of abstracts of literature related to the preservation and conservation of material cultural heritage.
Efforts by a small group of researchers collaborating on a study of organic carbonyl pollutants led to a two-day conference in 1998
Monitoring in Action: Kunsthistorisches Museum
In January 1998 the new curator of the numismatic collection at the Kunsthistorisches Museum in Vienna surveyed the coins in prepa-ration for a major exhibition to open the following December. The collection had been stored for two hundred years in beautiful wood cabinets, as is typical for coin and shell collections. During the survey, the curator noticed that many of the coins showed signs of corrosion, and the paper labels for individual coins had become discolored and brittle.
The museum hypothesized that the damage was linked to pol-lution—exhaust gases and photo-chemical smog—from tourist buses, especially those from former eastern bloc countries, which used low-grade fuels and had inefficient or no emission controls. The coin cabinets were located in the director’s
natu-rally ventilated office. On warm days, the windows were opened to provide fresh air, allowing fumes from the many tour buses to infiltrate the room.
The Getty Conservation Institute was asked to participate in a three-day meeting of conservators, scientists, and museum personnel to look into the question of whether these pollutants were in fact respon-sible for the deterioration of the coins. The cabinets containing the coins were examined and found to be extremely well made. Each cabi-net had outward-opening doors that formed a tight seal when closed. Inside were a series of drawers with no visible gaps between them. Given this construction, it was more likely that the damage was from internally generated pollutants than from infiltration of outdoor-generated pollutants.
The deterioration was consis-tent with damage from indoor-generated organic carbonyl
pollu-tants. The most obvious source was the wood, oak and a variety of other species, used to make the cabinets and drawers. Oak produces acetic acid, which poses great risk to metals, such as the old coins. The GCI also identified the fabrics and boards that line the bottom of the drawers, the wooden dividers, adhesives, and paper labels as possi-ble sources.
at the University of Strathclyde in Glasgow, Scotland. The conference focused specifically on acetic acid, formic acid, and formaldehyde, pollu-tants that pose a high risk to collections. More than thirty scientists, conservators, and collection managers from the United Kingdom, the Netherlands, Denmark, Canada, and the United States met to discuss the development of standard methods of analysis, the relationship between pollutant concentration and artifact damage, mitigation methods, and the need for practical air quality standards for museums (Gibson 1999b). This initiative resulted in the establishment of the Indoor Air Pollution Working Group, an informal, independent group of concerned scientists, conservators, and collections managers dedicated to keeping up with important issues and developments regarding indoor air quality in muse-ums and archives.
The 1998 Glasgow conference marked the beginning of a serious commitment to air pollution research and to finding practical solutions for museums. Since then, regular conferences with an expanded pollutant agenda have been held at the Instituut Collectie Nederland (the Netherlands, 1999), Oxford Brookes University (U.K., 2000), the National Museum of Denmark (Copenhagen, 2001), the University of East Anglia (U.K., 2003), and the Institute of Atmospheric Sciences and Climate, Italian National Research Council (Italy, 2004).
Members of the Working Group have published a number of studies reporting ranges of pollutant concentrations (Andrew, Tétreault, and Waller 1993; Eremin 1999, 2000; Eremin and Wilthew 1998; Grzywacz and Tennent 1994; Tétreault 1992a; Tétreault, Sirois, and Stamatopoulou 1998; see also http://iaq.dk). However, additional fundamental research needs to be done before scientists can assign definitive standards for pollutants in museum environments.
Why Monitor for Pollutants in Museums?
Among the reasons for conducting air quality monitoring in museum environments are the following:
Useful Websites
American Society for Heating, Refrigerating, and Air-Conditioning Engineers: http://www.ashrae.org/
Art and Archaeology Technical Abstracts (AATA Online): http://aata.getty.edu/NPS/
Canadian Conservation Institute: http//www.cci-icc.gc.ca/frameset_e.shtml Getty Conservation Institute: http://www.getty.edu/conservation/
• Damage or risk to objects is suspected, and the cause may be pollution in the microenvironment, for example, inside a storage cabinet or display case.
• There may be a known pollution problem, and concentra-tion data are required before management will allocate fiscal and staff resources to address it.
• Mitigation measures are scheduled to reduce known pollu-tants that pose a risk to a collection or an object. To evalu-ate the procedure’s effectiveness, initial pollution levels need to be documented.
• A building’s effectiveness at keeping outdoor-generated pol-lutants from entering is unknown. This can be tested by comparing measurements of the outdoor pollutants with what is found inside.
• Monitoring for pollutants can rule out an indoor air quality problem.
Levels of Monitoring
At times, monitoring the museum environment is needed only to deter-mine if dangerous pollutants are present. At other times, more specific monitoring programs are needed to determine which pollutants are pres-ent and their concpres-entrations. This is the difference between qualitative and quantitative monitoring.
Qualitative monitoring answers the question, is the environ-ment putting objects at risk from gaseous pollutants? In this approach, metal coupons, such as silver, lead, copper, or bronze, are exposed to the questionable environment and watched for visible changes such as corro-sion that would indicate a potential problem. A limitation of this test is that even if the air does not damage the metal coupons, one cannot be certain that it is safe for other kinds of cultural materials or objects. Ideally, the test samples should be similar to the materials of the objects or made from materials that are even more susceptible. One example is the use of blue-wool standards for measuring light exposure.
Qualitative monitoring can also determine the general classes of pollutants present in the environment. The class of pollutant—alde-hydes, organic acids, sulfides, inorganic compounds—can be deduced by knowing how different test samples react in the presence of different envi-ronmental contaminants. For example, the presence of sulfides is inferred if silver coupons tarnish rapidly, and the presence of organic acids is indi-cated by the corrosion of lead coupons.
Types of Monitors
Regulations imposed by OSHA and the Environmental Protection Agency (EPA) to protect people from exposure to high levels of dangerous pollu-tants in the workplace spurred innovation in air quality monitoring. This has resulted in new detection systems with museum-level sensitivity. Museum monitoring can be done with either an active or a passive sys-tem. An active system uses a pump to pull a sample of air into the moni-toring device, whereas a passive system allows air to diffuse into the device naturally. My focus here is on passive monitoring because it is gen-erally less expensive and easier to employ than is an active monitoring system. Chapter 3 introduces the general concept of passive air sampling, and chapter 4 describes the types of passive sampling devices available to monitor museum environments.
When to Monitor
Air quality monitoring in museums is conducted to determine if there is a gaseous pollution problem or risk. But how long and how frequently should monitoring be carried out? Should there be an ongoing monitoring program? The answers to these questions depend on the specific situation and objective and are explored in chapter 5.
Prevention Conservation
Pollutants modify or destroy susceptible surfaces, and, in the process, valuable information about cultural heritage can be lost forever. Unless changes are made to the environment that originally caused the damage, damage will continue and further conservation treatments will be neces-sary. Monitoring and mitigation go hand in hand. Chapter 6 explains how to interpret results and introduces mitigation considerations.
Notes
1. For a discussion of the history of air pollution as it pertains to the preservation of cultural properties, see Brimblecombe 1977, 1988, 1991; Brimblecombe and Stedman 1982.
2. A catalytic converter reduces air pollution by converting two exhaust products into less damaging substances: it oxidizes hydrocarbons from unburned fuel to carbon dioxide and water, and, to a lesser extent, it converts nitrogen oxides to nitrogen and oxygen.
3. “Smog” is a term originally used by the British to describe the mixture of smoke and fog that dirtied air over London (Oxford English Dictionary1989). Today, the term generally refers to photochemical smog produced when sunlight triggers chem-ical reactions between atmospheric gases and contaminants in vehicle exhaust and industrial emissions. An orange-brown atmospheric layer over a city is a telltale sign of photochemical smog.
Most gaseous pollutants that are a risk to collections are easily converted to their acidic analogs under ambient temperature and relative humidity. Current thinking is that the acidic forms are the damaging compounds, making acid-sensitive materials especially vulnerable to the pollutants. This has been demonstrated for nitrogen oxides; their acidic analogs (nitrous acid and nitric acid) are the reactant species.
Although the process is less clear for aldehydes (formaldehyde and acetaldehyde), fundamental chemical reactions provide researchers with some clues. Often their deductions are confirmed by observation and monitoring (Bradley and Thickett 1999a, 1999b). Telltale compounds that can be traced to aldehydes have been identified in corrosion products on cultural materials, leading researchers to suspect that the following three-step scenario is taking place (see fig. 2.1): (a) an aldehyde (e.g., formaldehyde or acetaldehyde), perhaps off-gassed from construction materials used in a display case, contaminates the atmosphere; (b) the aldehyde is transformed into an organic acid (e.g., formic acid or acetic acid) by the addition of oxygen provided by an oxidant such as a perox-ide or ozone; (c) the organic acid attacks the museum object chemically, losing its hydrogen in the process and leaving behind its anion (e.g., for-mate or acetate) that is identified in the corrosion products. In addition to this reaction, both formic acid and acetic acid can be emitted directly from materials and products.
What is notknown is if the aldehyde is oxidized to the
organic acid in the air or on the surface of the object. Chemically, the acid is a reactant in the corrosion or damage process, but this has not been verified experimentally, especially with respect to the organic car-bonyl pollutants that are a threat to collections. Raychaudhuri and Brimblecombe (2000) are the only researchers who have investigated the correlation of oxidation of formaldehyde to formic acid and corrosion. Bradley and Thickett (1999a) observed that 5 ppm and 0.5 ppm formaldehyde, while corrosive to lead at 100% RH, was not corrosive when the relative humidity was 50%. Their premise is that the formalde-hyde is not easily oxidized to the acid at ambient conditions. Others have reported corrosion related to organic carbonyl pollutants at elevated rela-tive humidity, 60% to 75% (Brokerhof and van Bommel 1996).
GCI surveys of organic carbonyl pollutants (aldehydes and organic acids) in museums in the United States and Europe. The U.S. surveys sampled general locations, such as galleries, storage rooms, and display cases, and obtained inconsistent data: one location had high concentrations of acetic acid, formic acid, and formaldehyde, while another had high levels of formaldehyde and moderate to low organic acid concentrations. The European surveys sampled areas where artifact damage had already occurred. In general, these areas had higher concentrations of the organic acids than were found in locations sampled in the United States. These findings raise many questions, for example: Were low concentrations of formic acid detected because it is a reactive gas and is removed by corro-sion of the object? Is acetaldehyde usually present in smaller concentra-tions than the other pollutants because it is converted into acetic acid, or is less acetaldehyde emitted in the first place?
The photo essays that follow illustrate the kinds of damage that can occur to metals (leaded bronzes, lead objects, stained-glass leads) and calcareous materials (shells, low-fire ceramics such as terra cotta, tiles, and limestones), as well as to artists’ colorants.
Metals:
Lead + acetic acid CH3COOH →lead acetate PbCH3COO →basic lead carbonate Lead + formic acid HCOOH1 →lead formate PbHCOO
Zinc + formic acid HCOOH →zinc formate ZnHCOO
Bronze →Sodium copper carbonate hydrate NaCuCO3 ·H2O + acetic acid CH3COOH
→Sodium copper acetate carbonate NaCu(CH3COO)(CO3) Calcareous Materials:
Calcium carbonate CaCO3+ acetic acid CH3COOH
→calcium acetate hemihydrate Ca(CH3COO)·1⁄2H 2O
→calcium acetate hydrate Ca(CH3COO)·H2O
→calcium acetate chloride hydrate Ca(CH3COO)Cl·H2O (calclacite)
→calcium acetate chloride nitrate hydrate Ca(CH3COO)Cl(NO3)·H2O (thecotrichite)
Calcium carbonate CaCO3+ acetic acid CH3COOH + formic acid (HCOOH)
→calcium acetate formate hydrate Ca(CH3COO)(HCOO)·H2O 2
(present in Byne’s Efflorescence) Glass and Enamels:
Soda Glass + acetic acid (CH3COO) →sodium acetate trihydrate Na(CH3COO)·3H2O Soda Glass + formic acid HCOOH →sodium formate Na(HCOO)
1Formaldehyde can be a source of formic acid (Raychaudhuri and Brimblecombe 2000).
2Calcium formate has not been detected alone on calcareous materials; only mixed acetate formate salts have been detected.
Figure 2.1.
Organic carbonyl pollutant reaction path-way to corrosion product. Transformation of an aldehyde (a) into an organic acid (b) and finally into an anion or salt found in corrosion products (c). Aldehydes are a risk to collections because they are easily oxidized to carboxylic acids, which in turn damage objects. An aldehyde has a hydrogen atom next to the carbonyl carbon that is extracted in oxidation and replaced by an oxygen or a hydroxyl group, depending on the reaction condi-tions forming an organic acid. Oxidants can be strong, such as permanganate, or mild, such as hydrogen peroxide or even light.
Figure 2.2.
Leaded Bronzes. A spattering of a blue
corrosion product, sodium copper acetate
carbonate, can be seen on these two
leaded bronze objects. Leaded bronzes
may exhibit a white acetate corrosion
product as well. Photos by Davina Graham.
Courtesy of Glasgow City Council
(Museums), The Burrell Collection
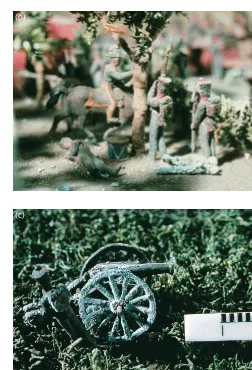
Figure 2.3.
Lead Objects. Lead objects are notoriously
susceptible to damage when stored in
wood or wood-composite cabinets that
off-gas organic carbonyl pollutants. The
minia-ture lead statue of a warrior (a) has been
severely damaged by acetic acid. The lead
figures at right are in a diorama depicting a
battle. Emissions, most likely from the
dis-play’s support board, have corroded the
soldiers (b) to such an extent that several
have fallen over. The cannon (c) is in a
grave state of disrepair. Photos: Jean
Tétreault (fig. 2.3a); Barry Knight © English
Heritage (figs. 2.3b, 2.3c) (a)
(b)
Figure 2.4.
Stained Glass. Stained-glass panels may
appear to be in good condition, but
inves-tigation of the lead joins may reveal
corro-sion, caused by the action of organic
carbonyl pollutants. Note here that the
sol-der, which contains tin, is not corroded
(figs. 2.4b, 2.4c). This is evidence that
alloys can be less susceptible to attack by
gaseous pollutants. Photos by Davina
Graham. Courtesy of Glasgow City Council
(Museums), The Burrell Collection
(a)
(b)
Figure 2.5.
Shells. Byne’s Disease, or Byne’s
Efflorescence, results when organic
car-bonyl pollutants attack shells. This typically
occurs when the shells are stored in
poor-quality wooden containers, as seen in the
mollusk shell stored in a wooden cabinet
(a). The characteristic bumps of Byne’s
Disease (b, c) consist of needle-like crystals
(d). The corrosion product takes advantage
of flaws in the shell’s protective protein
layer (e), which eventually is destroyed as
the efflorescence grows. Not all shells in
the same microenvironment are affected;
see (a). Though the damage may seem
random, it is a function of the type of shell
as well as its age, treatment, and storage.
Photos: Cecily M. Grzywacz (fig 2.5a);
Tom Moon Photography (figs. 2.5b, 2.5c);
Eric Doehne (figs. 2.5d, 2.5e). © J. Paul
Getty Trust
(c)
(b)
(d) (a)
Figure 2.6.
Low-Fire Ceramics. This sixth-century B.C.
terra-cotta vase (a) (height 123 mm) with
red circular decoration has sprouts of
cal-clacite over its surface. SEM images
illus-trate the two types of white efflorescence:
the long splintered efflorescence occurs
inside the vase (b); and globular
efflores-cence is observed on the neck (c). Photos:
Lieve Halsberghe
(a)
(b)
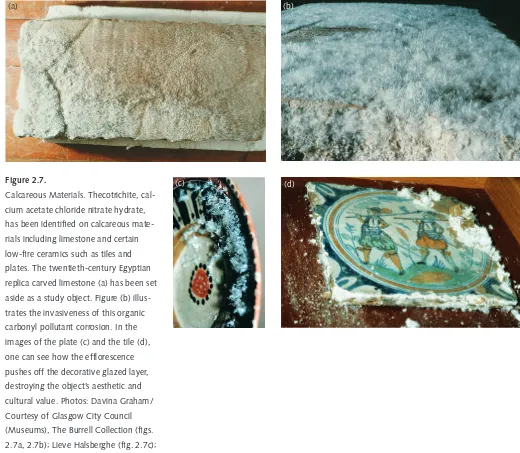
Figure 2.7.
Calcareous Materials. Thecotrichite,
cal-cium acetate chloride nitrate hydrate,
has been identified on calcareous
mate-rials including limestone and certain
low-fire ceramics such as tiles and
plates. The twentieth-century Egyptian
replica carved limestone (a) has been set
aside as a study object. Figure (b)
illus-trates the invasiveness of this organic
carbonyl pollutant corrosion. In the
images of the plate (c) and the tile (d),
one can see how the efflorescence
pushes off the decorative glazed layer,
destroying the object’s aesthetic and
cultural value. Photos: Davina Graham/
Courtesy of Glasgow City Council
(Museums), The Burrell Collection (figs.
2.7a, 2.7b); Lieve Halsberghe (fig. 2.7c);
Dusan Stulik © J. Paul Getty Trust
(fig. 2.7d)
(a) (b)
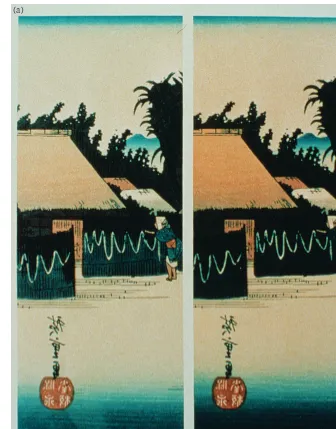
Figure 2.8.
Organic Colorants. Ozone is a strong
oxi-dizer and causes significant damage to
many materials. One of the most obvious
changes is alteration of organic colorants.
The Japanese print on the right (a) has
been exposed to ozone. When it is
com-pared to the unexposed duplicate print on
the left, the differences in the colors
become apparent. In another experiment
(b), a series of artists’ pigments were
exposed (top), resulting in dramatic
changes when compared to the control
(bottom). Photos: James R. Druzik
© J. Paul Getty Trust
(a)
Air Quality Monitoring in Museums
There are currently two general approaches to air quality monitoring: active and passive. In both approaches, pollutants are trapped on an absorbent or a reactive surface and then their concentrations are deter-mined either directly or by means of laboratory analysis.
An active monitoring system uses a pump to pull air into the device, an approach referred to as pumped sampling. With a passive sam-pling device (PSD), air naturally diffuses into the trap; this is sometimes referred to as diffusive or diffusional sampling. Active monitoring typi-cally requires costly, sophisticated instrumentation and technical exper-tise. In contrast, passive monitoring is generally less expensive and easier to use. Active sampling, however, remains the primary method for deter-mining the concentration of gases in air against which other methods are validated (Winberry et al. 1999).
Initially, active sampling methodologies were more precise and accurate than passive sampling techniques. However, since the 1970s, significant advances have been made in passive sampling technology and analytical procedures, especially with respect to inorganic pollutants and to aldehydes such as formaldehyde. These improvements resulted from efforts by such U.S. organizations as OSHA, the EPA, and the National Institute of Occupational Safety and Health (NIOSH) to decrease allow-able exposure levels for workers (Chan and Rogers 1999; Hanson 1987). Consequently, the differences in accuracy and precision between active and passive sampling substantially decreased. This led to the investigation of passive sampling techniques for conservation use starting in the 1990s (Grzywacz 1993; Grzywacz and Stulik 1992).
with concentrations in the parts per billion range (Brimblecombe 1999; Cass, Nazaroff, and Druzik 1991; Grzywacz 1989; Grzywacz and Tennent 1996, 1997; Lee, Holland, and Falla 1996; Livingston 1981; Paterakis 1999). In some cases, such as silver damage or tarnishing by hydrogen sulfide, the range can be as low as parts per trillion (Watts 1997).
Passive Sampling
Today, monitoring the indoor air quality of museums with a passive sam-pling device is considered an acceptable approach. Passive samsam-pling has many advantages over active sampling for museum monitoring, including selective identification of pollutants, moderate cost, and ease of use. Passive sampling is less disruptive to the ambient environment because it does not require noisy pumps, and the devices can be deployed and retrieved when the museum is closed to visitors. A possible disadvantage is that long exposure times are usually required, from hours to days to weeks, depending on the device (active sampling can be conducted in min-utes or hours).
Passive Sampling Devices
Commercial passive sampling devices suitable for museum use are com-monly available to monitor for ozone, nitrogen dioxide, sulfur dioxide, VOCs, and formaldehyde. Although there are no commercially available PSDs to monitor for low concentrations of acetic acid, formic acid, and hydrogen sulfide, PSDs have been developed by university laboratories for these pollutants (Gibson et al. 1997a, 1997b; Shooter, Watts, and Hayes 1995). Also, Gibson and Brokerhof (2001) have developed a PSD for formaldehyde.
A PSD can be as simple as a reactive metal coupon that tar-nishes or a paper strip impregnated with a chemical that turns color pro-portional to concentration similar to pH indicator paper. Because such devices quickly produce visible results that the user can interpret, they are known as direct-reading PSDs. Typically, though, a PSD is a more structured device consisting of a small housing that encloses an active surface or trap behind a diffusion barrier, and it needs to be sent to a laboratory for analysis.
The schematic in figure 3.1 shows the internal arrangement of the typical PSD. The relative alignment and composition of each compo-nent can be varied, allowing researchers and manufacturers to design PSDs for specific pollutants at specific concentration ranges. These vari-ables also distinguish the different classes of passive samplers.
How does a PSD trap gas molecules?
Diffusion is the mechanism that allows gaseous pollutants to travel to the active surface of a PSD, where they are trapped. Because air flow into a passive sampler is not assisted by a pump, the rate of air sampling with PSDs is as much as three orders of magnitude slower than with active sampling—milliliters per minute compared to liters per minute. This
Figure 3.1.
slower rate can be an advantage or a disadvantage, as discussed below. Because diffusion depends on temperature, this is an important parameter to note when conducting air quality monitoring so that the results can be interpreted correctly.
What does the diffusion barrier do?
The diffusion barrier physically limits and controls the diffusion rate of the gaseous air molecules entering the sampler and hence the rates at which pollutants are trapped on the active surface. The barrier can be physical, such as a screen or a membrane, or it can be a static layer of air. Controlling the rate at which the molecules are trapped on the active sur-face makes it possible to adjust the sensitivity of the device per unit time. The faster the rate, the greater the amount of pollutant that can be detected for a specific period.
The diffusion rate is pollutant-specific and is a function of the distance between the barrier (B) and the active surface (S) (known as the diffusion path length [L]), as well as the area of the active surface. Modifying either feature adjusts the PSD’s sensitivity and accounts for the size difference and the variations in exposure time for commercial devices.
Faster sampling rates mean that the device can be exposed for less time to detect the same amount of gas. This is especially advanta-geous in situations that require short exposure times, for example, in areas that can be monitored only when the museum is closed to the pub-lic. A short exposure time is suitable for open areas, such as galleries. A decreased sampling rate increases the exposure time required to detect the same concentration of pollutant. Longer exposure is advantageous for closed environments, such as a case or a cabinet, because it provides more time for equilibrium or constant concentration to reestablish after the enclosure is momentarily opened for placement of a sampling device. Opening the enclosure allows room air, usually less polluted, to enter and dilute the concentration of the pollutant in question.
How are pollutants trapped?
The characteristics of the active surface control which pollutant is trapped and how it is ultimately detected. Frequently the active surface contains a reagent that absorbs the pollutant(s) of interest. Some sur-faces react chemically with the pollutant to form a new compound that is measured and used to determine the concentration of the original pollu-tant. PSDs can be manipulated to detect specific pollutants by modifying the chemistry of the active surface. For example, 2,4-dinitrophenyl-hydrazine is a highly specific chemical used to trap aldehydes. An active surface of potassium hydroxide, a more general chemical, is used to trap and detect acidic gases such as acetic acid and formic acid. Activated charcoal is a nonspecific trap for VOCs that works solely on the basis of physical adsorption.
How are results obtained with a PSD?
complexity. Direct-reading PSDs are usually less expensive, but their detection limits are higher, usually in the ppm range. Although their range can be too high for certain museum applications, direct-reading PSDs are appropriate as prescreening tools to determine if an area has a high pollu-tant concentration that needs further monitoring. These devices usually detect classes of pollutants, for example, acidic gases, rather than a specific pollutant.
How is a pollutant’s concentration determined with a PSD?
Concentration, as measured by a PSD, is a time-weighted average (TWA; see sidebar). It is a function of the amount of pollutant measured, the sampling rate, and the exposure time.
For the simplest direct-reading devices, such as chemically treated paper strips, concentration is determined by exposing the PSD for the recommended amount of time and comparing the resulting color change to a supplied chart that relates color to concentration. Some direct-reading devices, such as colorimetric diffusion tubes, incorporate the amount of pollutant and the sampling rate into the readings, produc-ing concentrations based on elapsed time, for example, 25 ppm·hr. If the device is exposed for a longer or shorter period than recommended by the manufacturer, the correct pollutant concentration can be calculated sim-ply by dividing the reading by the actual exposure time.
For laboratory-analyzed PSDs, the analyst calculates the con-centration by (1) determining the total amount of pollutant trapped by the device’s active surface; (2) calculating the volume of air sampled by multiplying the device’s sampling rate, supplied by the manufacturer, by the user-supplied exposure time; and (3) dividing the total amount of trapped pollutant by the volume of sampled air.
In what units are pollutant concentrations reported for PSDs?
Most direct-reading PSDs give concentrations in ppm or ppb. However, as noted above, results from direct-reading colorimetric diffusion tubes incorporate exposure time, and these readings are reported in the units ppm·hr or ppb·hr, from which concentration is calculated by dividing by the number of hours exposed.
There is no standard for reporting results from laboratory-analyzed PSDs. Readings can be volumetric measurements (ppm or ppb)1 or gravimetric measurements (mg·m⫺3or µg·m⫺3). Volumetric units are temperature and pressure dependent, whereas gravimetric units are not. It is frequently possible to obtain results in both units on request. In gen-eral, U.S. manufacturers and laboratories favor ppb or ppm units, and European Union countries report in mg·m⫺3or µg·m⫺3. For convenience, volumetric units are used in this book.
Time-Weighted Average
In general, all PSD readings and other air quality data are reported as a TWA concentra-tion over the exposure period. Thus these readings are compa-rable to average temperature and relative humidity. As with any average measurement or reading, a concentration spike is not distinguished, nor are cyclic fluctuations. A reading of 55 ppb for the gaseous pollutant ozone, for example, does not mean that the concentration of this contaminant never spiked above or dipped below this amount during the exposure.
Figure 3.2 illustrates TWA calculations for the same set of data but different intervals.
Figure 3.2.
Daily (a), weekly (b), and monthly, quarterly, and semiannual (c) TWA calculations of hourly nitrogen diox-ide data collected by the South Coast Air Quality Management District between August 1, 1996, and February 5, 1997.
(a)
(b)
found in museum environments.2An online concentration converter is also available.3
Selecting the Appropriate PSD
Selecting the appropriate PSD to monitor air quality in museum environ-ments requires an understanding of such factors as their detection limits, precision and reproducibility, accuracy, specificity and interferences, and exposure times. These parameters, which are frequently reported in the manufacturer’s literature, are reviewed here. Also covered is PSD sensitiv-ity to light, temperature, and storage time.
Detection limit
The detection limit of a device is an important parameter to consider when deciding on a PSD. Not all monitors available for air quality test-ing, especially those developed for laboratory safety and industrial hygiene, have detection limits appropriate for museum environmental studies. For example, the detection limit may be too high; that is, the sampler does not detect gaseous pollutants at the low ppb concentrations considered a potential risk to collections.
Selecting a PSD with detection limits too high relative to the pol-lutant concentrations in the museum environment being tested can report a false negative. This could be a critical error if sensitive materials are placed in an environment that was tested and reported as not having the potentially damaging gas present. Because a PSD does not detect a pollutant does not mean it is not present. It can only be stated that the pollutant is present at concentrations less than the detection limit of the device. (See Appendix 2 for target pollutant guidelines that aid in evaluating the suitability of the detection limits of the PSD being considered for a monitoring program.)
Sampler precision and reproducibility
A PSD’s precision is measured by the reproducibility of its readings. Ideally, the readings from a set of colocated PSDs should be identical. This is not always the case, however, and using multiple samplers will
Table 3.1.
Concentration conversion factors for com-mon gaseous pollutants. This table pro-vides conversion factors between µg·m⫺3
and ppb (or mg·m⫺3and ppm), and vice
versa, at standard temperature and pres-sure (STP) as defined by the Compressed Air and Gas Institute; T = 20°C, P = 1 atmosphere. To use the table to convert a concentration reported in µg·m⫺3(or
mg·m⫺3) to one in ppb (or ppm), multiply
the concentration by the corresponding number for that gas in column X. Multiply the ppb concentration by the number in column Y to convert it to µg·m⫺3.
X: To convert µg·m⫺3to Y: To convert ppb to
Molecular ppb or mg·m⫺3to ppm, µg·m⫺3or ppm to
Pollutant (Gas) Weight multiply by mg·m⫺3, multiply by
Acetaldehyde, CH3CHO 44.05 0.55 1.83
Acetic acid, CH3COOH 60.05 0.40 2.49
Ammonia, NH3 17.03 1.42 0.71
Carbonyl sulfide, CO 60.08 0.40 2.49
Formaldehyde, HCHO 30.03 0.80 1.25
Formic acid, HCOOH 46.03 0.52 1.91
Hydrogen sulfide, H2S 34.08 0.71 1.41
Nitrogen dioxide, NO2 46.01 0.52 1.91
Nitrogen monoxide, NO 30.01 0.80 1.25
Ozone, O3 48.00 0.50 1.99
Sulfur dioxide, SO2 64.07 0.38 2.66
improve precision by averaging the concentrations detected. Based on the reproducibility of a device for a particular gas, the manufacturer will rec-ommend how many devices should be used in each area of interest.
Reproducibility is a function of the design of the device, the analysis method, and, in the case of laboratory-analyzed PSDs, the labo-ratory’s compliance with the analysis method or protocol. Most commer-cially available devices have good reproducibility, and exposure of one device per location is satisfactory (Grzywacz and Villalta 1998, 1999). However, reproducibility problems have been reported with noncommer-cial PSDs prepared and analyzed in a laboratory not familiar with the procedure (Brokerhof, Gibson, and Grzywacz 1998).
Accuracy
A PSD’s accuracy is defined by how close its reading is to the true value. Figure 3.3 illustrates the difference between precision and accuracy. The device’s manufacturer or inventor determines accuracy by exposing the PSD to a known concentration of pollutant and comparing the results with those obtained by a primary method of analysis, such as active sampling.
Specificity and interferences
The composition of air, especially indoor air, is complex. Analysis of air in most rooms will reveal the presence of hundreds of chemical species, the majority of which are not damaging to collections. If the active surface in a PSD can trap more than one gas, then it is not specific, and some of these other contaminants will be collected as well. This is known as interference. Interference is usually not a problem for most PSDs that require labora-tory analysis. If the trapping reagent is not specific, the devices merely trap the gases, and the laboratory uses chromatography, a separation tech-nique, to determine the concentration of the specific gases of interest.
On the other hand, many direct-reading PSDs are nonspecific and especially subject to interference from other gases. The reagent in their active surface is sensitive to classes of compounds, producing a color change that is proportional to the total concentration of gases, not just the target pollutant. For example, a direct-reading diffusion tube PSD for acetaldehyde will react with all aldehydes present in the environment. Even though a PSD is not specificthat is, it is subject to interferencesa
positive result still provides important information about a possible prob-lem that would warrant additional testing with more specific PSDs.
Exposure time
Because PSDs record concentrations as a time-weighted average, extend-ing exposure time improves the detection limit of the device. By deployextend-ing a sampler longer, the pollutant has more time to react with the active sur-face of the sampler and to be trapped, which increases the detection limit. When attempting to detect extremely low pollutant concentrations, it is necessary to lengthen exposure times. In most situations, the exposure time should be as long as possible within the restrictions of the PSD.
However, one trade-off in increasing the exposure time may be degradation of the chemical reagents used by the PSD to trap airborne pollutants, as well as the reaction products. Some samplers can be safely
Figure 3.3.
exposed for up to thirty days; others may start to fade and produce erro-neous results after only eight hours. The PSD’s manufacturer or vendor should be consulted when extending the exposure time beyond the recom-mended limit.
Light, temperature, and storage time sensitivity
Reagents and reaction products on the active surface can also be sensitive to degradation by light, especially UV light, and temperature. A few are even unstable with respect to storage time. These sensitivities reduce the sampler’s capacity and results in erroneously low readings of pollutant concentrations. Because of temperature sensitivity, manufacturers often recommend storing susceptible samplers in freezers or refrigerators before and after exposure. To minimize degradation from sunlight, the PSDs can be placed under an opaque shelter when used outdoors (Smith et al. 2000). This could be the same shelter used to minimize air velocity effects (see sidebar “Considerations in the Use of Open-Path (Palmes) Diffusion Tubes,” chap. 4). Some manufacturers will specify shelter requirements for their devices. Finally, attention to expiration dates will avoid degradation from prolonged storage, but not all vendors provide them.
Conclusion
The increasing accuracy, precision, and low limits of detection of passive sampling devices, along with ease of use, low technical knowledge required, and economy, make them ideal for air quality monitoring stud-ies in museums. Chapter 4 discusses in detail the various types of PSDs that are available commercially and from private laboratories.
Notes
1. A few commercially available devices also indicate a volumetric concentration as ppbv.
2. To obtain an approximate conversion between ppb and µg·m⫺3, or ppm and mg·m⫺3, some people use a “one-half rule”: a ppb (or ppm) value is roughly equiva-lent to one-half the µg·m⫺3(or mg·m⫺3) value. However, this relationship is a math-ematical coincidence only for ozone and should not be used.