Media Trend
Berkala Kajian Ekonomi dan Studi Pembangunanhttp://journal.trunojoyo.ac.id/mediatrend
The Impact Of Sundaries To Improve Production And Welfare (Case study
Cabai Sundari Innovation Desa Lembor District Brondong Lamongan District
East Java Province)
Abid Muhtarom1*, Bambang Eko Muljono2, Zulkifli Lubis3 Nuril Badriyah4, Abdul
Ghofur5, Husen6
1 Universitas Islam Lamongan
A B S T R A C T
Informasi Artikel
Chili Sundari, Farmers Innovation So Superior Product Lembor Village, Brondong District, Lamongan Regency, East Java Province is a blessing for the people of Lembor village, because of the innovation of this product, the potential of the village can be done and explored more deeply and systematically. The type of research used is quantitative research. Quantita-tive research is a research by collecting data that is numerical then using statistical procedures to obtain information behind the image. The location of this research is Lembor Village, Brondong District, Lamongan Regency, East Java Province, where the data used in this research are primary and secondary data. Primary data in this research is questionnaire. The increase of new superior product type make a big impact on Chili farm sector so that it can increase the production of chili farming. And theoretically the economy can improve the welfare of farmers with increased income perkapital farmers.
Sejarah artikel:
Diterima September 2018 Disetujui Oktober 2018 Dipublikasikan Oktober 2018
Keywords:
Corporate Social Responsi-bility Disclosure,
Global Reporting Initiative, Empirical Study, Multiple Regressions
© 2018 MediaTrend
Penulis korespondensi:E-mail: [email protected]
Background
Chili is one of the important horti-cultural crops cultivated commercially, this is because in addition to chili has a fairly complete nutritional content also has a high economic value that is widely used for both household consumption and for food industry by Nurlenawati (2010)
According to Rans (2005) area of chili planting centers in Indonesia spread in some areas ranging from North Sumatra to South Sulawesi. Production of red chili produced an average of 841,015 tons per year. Java Island supplies 484.36 tons of red chili while the rest from outside Java. On a national scale the average yield per hectare is still relatively low at 48.93 quin-tals per hectare with harvested area of 171,895 ha.
The need for red pepper continues to increase in line with the increasing num-ber of population and the development of food industries that require raw materials of chili. This causes the commodity to be the most common commodity in all seg-ments of society because the price can soar very high at certain times (Andoko, 2004). Given the prospect of red chilli is very bright then it needs to be cultivated intensively.
East Java Province lamongan re-gency is a special district and typical be-cause most of the community working in the agricultural sector. But geographically Lamongan region is located in coastal areas, valleys and lowland or flat terrain. The people of Lamongan district also re-flect the social culture that is in it. Chili Sundari, Farmers Innovation So Superior Product Lembor Village, Brondong District, Lamongan Regency, East Java Province is a blessing for the people of Lembor village, because of the innovation of this product, the potential of the village can be done and explored more deeply and systematically.
The existence of significant impacts in terms of economic and potential of the village to make this village to make
poten-tial ecotourism and eco-industrial areas in the future. The founder of Lembor village’s flagship product is Mr. Sundari by way of chili crossing based on experience alone. There is no special science background on agriculture because of madrasah gradu-ates.
Lembor Village, Brondong District, Lamongan Regency has geographical po-sition on the slope of the mountain with a slope of 45 degrees and an area of about 200,000 ha. With a black soil structure (paddy fields), Lembor Village has poten -tial as a fertile agricultural area. There are a number of agricultural commodities once planted by the people of Lembor Village, ranging from rice, corn, cassava, chili, vegetables , until fruits.
In 2002, Sundari, a farmer of Lembor Village, tried to capture four types of local chili, namely chilli from Lembor Vil-lage, Wide, Benges, and Brengkok with random pattern and planted in one rice field area. From the result of the crossing of four types of chillies, one new varieties of pepper varieties are different from the four types of local chili. Sundari could not identify the new chili varieties from which chili crosses. This new varieties of chilli has a number of advantages compared to four types of local chilli available, such as fruit-ing periods faster, tree trunks are not high, more resistant to pests, more spicy pep-per flavor, and although harvested several times, chili quality remains the same (not shrink).
Chili varietas superior then cultivat-ed in a paddy field. Now, the chili varieties are growing until now. In honor of Lembor Village community to Sundari, the supe-rior chilli varieties were named Lombok Sundari (Chili Sundari). Since that. Lembor village community who previously planted more horticulture crops, then went to plant Sundari lombok.
from outside the district increased sharply. Now, the people of Desa Lembor develop the seeds of Lombok Sundari as a superior product of the village. Every day ordering lombok seeds reach 10 Kg to 20 Kg ac-cording Suyoto (2017)
The increase of new superior product type make a big impact on Chili farm sector so that it can increase the pro-duction of chili farming. And theoretically the economy can improve the welfare of farmers with increased income perkapital farmers.
Research Methodology
The type of research is used in quantitative research. Quantitative re-search is a rere-search by collecting data that is numerical then using statistical procedures to obtain information behind the image. The location of this research is Lembor Village, Brondong District, Lamongan Regency, East Java Province, where the data used in this research are primary and secondary data. Primary data in this research is questionnaire. While secondary data in this research is docu-ment docudocu-ment available in chilli farmer. While data collection technique is done by researcher in this research in the form of questionnaire and documentation accord-ing to Wibisono (2005)
Model
The model is as an explanation of the actual phenomenon as a system or process (Koutsoyiannis 1977). The model in this study is an empirical study, which uses econometric analysis of mul-tiple linear regression. The econometric model is a special pattern of the algebraic model, which is a stochastic element that includes one or more annoying variables (Intriligator 1978). The econometric model is a description of the relationship of each explanatory variables to the dependent variables especially concerning the sign and magnitude of the parameter estimator
in accordance with the a priori theoretical expectations. A good model must meet the criteria of economic theory (theoritically meaningful), the statistical criterion seen from a goodness of fit known as the coeffi -cient of determination (R²) and statistically significant, while the econometric criterion determines whether an estimate has the required properties such as unbiasedness, consistency, sufficiency and efficiency.
From function (1) it can be modified into a linear model using logs according to Gujarati (2003) and Wandi, et.al (2018) are as follows:
PRV = x0 + x1 LogLDN + x2 LogLBR + x3
Lo-gIRG + ε1...(1)
Where: PRV = Total Production sector of chili farming, LDN = Area of agriculture sec-tor of chilli plant, LBR = Number of Labor of Chili farming sector, IRG = technology in chili farming sector (Dummy)
To see the well-being used the model equation (2) uses a linear model us-ing the logs as follows:
KEJ = x0 + x1 LogPRC + x2 LogWAG + x3 Lo-gIRG + x4 LogREG + ε1 ...(2)
Where: KEJ = farmer’s welfare of chili farming sector, PRC = price of agricultural sector of chili pepper, WAG = Total wages of Chili farming sector agriculture, IRG = capital in chili farming sector and REG is regression result from first model.
Data Analysis Discussion
To analyze the impact variables of chilli sundari to increase the production and welfare of farmers the authors use the following analysis tools:
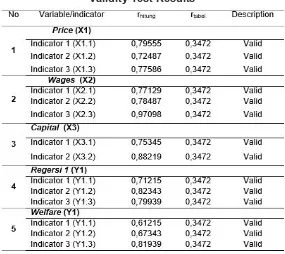
Test Validity
that will be measured by the questionnaire. How to measure whether or not valid cal-culate the correlation between the score of each question with the total score (Ghozali , 2013: 52).
Test results in the validity test in the first equation can be seen in table 1.
With rtabel at df = n-5 (78-4) and probability 0,05 obtained rtabel = 0,2272
indicate that all indicator used to measure variable in this research have value rhitung> rtabel, meaning that all indicator is said valid.
Test results in the validity test on the second equation can be seen in table 2:
Tabel 1
Validity Test Results No Variable / indicator rhitung rtabel Description
Table 2
Validity Test Results Source: Data is processed Excel 2007
With rtabel at df = n-5 (78-5) and probability 0,05 obtained rtabel = 0,3472 indicate that all indicator used to measure variable in this research have value rhi-tung> rtabel, meaning that all indicator is said valid.
Test Reliability
According Ghozali (2013: 47) Reli-ability is a tool to measure a questionnaire which is an indicator of the variable. A questionnaire is said to be reliable if one’s answer to the question is consistent or sta-ble over time. Reliability test is done jointly to all statements and if the value of alpha> 0.2272 then called the first reliable model for the second model alpha value> 0.3472.
The results of reliable testing in the second study can be seen in table 4. Based on the above table shows that all values of Cronbach’s Alpha> 0.3472. This means that all variables in this study are declared reliable so that it is good for re-search.
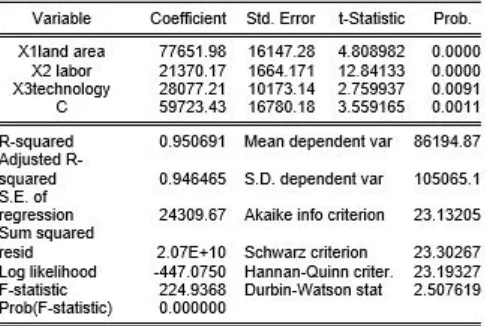
Multiple Regression Analysis
Multiple regression analysis was used to know the effect of independent variables of chili sundari impact to increase farmer production and prosperity. In mul-tiple regression analysis using Eviews ver-sion 9 obtained the results as in table 5 be-low.
Based on table 5 the results of tiple regression can be in the form of mul-tiple regression model equation as follows:
Y = a + b1X1 + b2X2 + b3X3 + e
Y = 59723.43+ 77651.98X1 + 21370.17X2 + 28077.21X3
Description: Y: production; X1: land area; X2: labor; X3: dummy technology
Based on the results of multiple regression equation above, it can be explained as fol-lows: a) In the equation the constant value shows the positive value that is equal to 59723.43 which indicates a corresponding relationship, meaning that if all independent
Source: Data is processed Excel 2007
Table 3
Validity Test Results
Table 4. Validity Test Results
variables equal to 0, then the production of 59723.43. b) If the value of land area coefficient (X1) is positive, it means that the variable of land area has positive in-fluence to customer satisfaction. Area of land (X1) has regression coefficient value of 77651.98 and positive signified if the variable land area rose one unit then it will raise the production of 77651.98. c) If the value of labor (X2) is positive, then labor has a positive effect on purchasing deci -sions. Labor (X2) has a regression coeffi -cient value of 21370.17 and a positive sign is defined if the labor variable rises one unit will increase production by 21370.17. d) If the value of technology (X3) is positive, then assurance / assurance has a positive effect on purchasing decisions. Technol -ogy (X3) has a regression coefficient value of 28077.21 and positive signified if the technological variables go up one unit then it will increase production by 28077.21.
Based on the results of multiple regression analysis that has more domi-nant influence on purchasing decisions is the workforce (X2) because it has a value of coefficients of 77651.98. Thus it can be interpreted that the hypothesis that the variable of workforce more dominant influ -ence on production. Based on the above table 5 obtained the results of regression calculations that can be known coefficient of determination () obtained from R square result of 0.950691. it received Nurlenawati (2010); Andoko, A. (2004); Suyoto (2017), Subroto, et.al (2016), Sitepu (2002), Rans. (2005) and Wandi, et.al (2018)
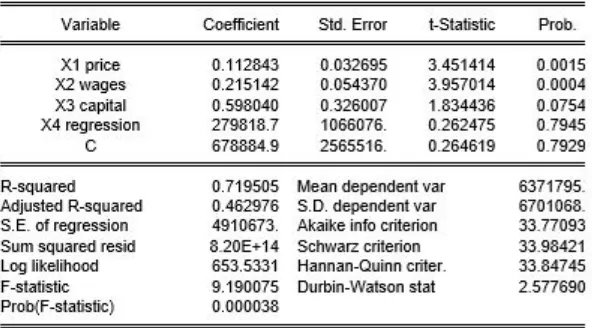
In multiple regression analysis us-ing Eviews version 9, the results obtained as in table 6 to see the second model to see the welfare of farmers.
Table 5
Multiple Regression Testing Results
Based on table 6 the results of multiple gression can be in the form of multiple re-gression model equation as follows:
Y = a + b1X1 + b2X2 + b3X3 + b4X4 + e Y = 678884.9+ 0.112843X1 + 0.215142X2 + 0.598040X3 + 279818.7X4
Caption: Y: welfare; X1: price; X2: wages; X3: capital; X4: regression of the first mod -el.
Based on the results of multiple regression equation above, it can be ex-plained as follows: a) In the equation the value of the constant shows the positive value of 678884.9 which indicates a cor-responding relationship, meaning that if all independent variables equal to 0, then the welfare of 678884.9. b) If the value of price coefficient (X1) is positive, it means that the price variable has a positive influ -ence on customer satisfaction. Land area (X1) has a regression coefficient value of 0.112843 and positive signified if the vari -able land area up one unit will increase the welfare of 0.112843. c) If the value of wage (X2) is positive, then wages have a posi-tive effect on purchasing decisions. Wage (X2) has a regression coefficient value of
0.215142 and positive signified if the vari -able labor increases one unit will increase the welfare of 0.215142. d) If the value of capital (X3) is positive, then capital has a positive effect on purchasing decision. capital (X3) has a regression coefficient value of 0.598040 and marked positively interpreted if the variable capital rose one unit will increase the welfare of 0.598040. e) If the value of the first model regression (X4) is positive, then the first model regres -sion has a positive effect on the purchase decision. capital (X4) has a regression coefficient value of 279818 and positive signified if the first model regression vari -able up one unit will increase the welfare of 279818.
Based on the results of multiple re-gression analysis that has more dominant influence on purchasing decisions is the first model regression (X4) because it has a value of coefficients of 77651.98. Thus it can be interpreted that the hypothesis that states the first model regression vari -able more dominant influence on welfare. Based on table 5 above obtained the re-sults of regression calculations that can Source: Eviews version 9, processed
Table 6
be known coefficient of determination () obtained from the results of R square of 0.719505, receiving Nurlenawati (2010); Andoko, A. (2004); Suyoto (2017), Subroto , et.al (2016), Sitepu (2002), Rans. (2005) and Wandi, et.al (2018).
Conclusion
Based on the results of multiple regression analysis that has a more domi-nant influence on purchasing decisions is the workforce (X2) because it has a value of coefficients of 77651.98. Thus it can be interpreted that the hypothesis that the variable of workforce more dominant influ -ence on production.
Based on the results of multiple regression analysis that has a more domi-nant influence on purchasing decisions is the first model regression (X4) because it has a value of coefficients of 77651.98. Thus it can be interpreted that the hypoth-esis that the first model regression variable more dominant influence on welfare.
Thanks to:
YPPTI sunan giri Lamongan, Rector of Lamongan Islamic University, Head of R & D of Pemas, KKN BBM 2018, Field Su -pervisor of KKN BBM 2018, all participants of KKN BBM 2018, Solokuro sub-district head, sub-district head of sub-district, Sub-district of Brondong, BUDI-DN, Lamongan District and parties that can not be men-tioned.
References
Andoko, A. 2004. Budidaya Cabai Merah Secara Vertikultur Organik. Penebar Swadaya. Jakarta. 85 hlm
Abbas,Wandi,et al. 2018. DEVELOPMENT OF AGRICULTURE SECTOR IN POV-ERTY REDUCTION IN EAST JAVA (Study of GKS Plus-GERBANGKER-TASUSILA Plus Period 2010-2017).
https://osf.io/preprints/inarxiv/4pa95/
Nurlenawati,dkk.2010. Respon pertumbuhan dan hasil tanaman cabai merah (capsi-cum annuum l.) Varietas prabu terha-dap berbagai dosis pupuk fosfat dan bokashi jerami limbah jamur merang. Program studi agroteknologi, fakultas pertanian universitas singaperbangsa karawang (unsika). Agrika, volume 4, nomor 1, mei 2010
Rans. 2005. Cabai (Capsicum spp). http:// warintek.progressio.com
.Suyoto, 2017. Cabai Sundari, Inovasi Petani Jadi Produk Unggulan Desa Lembor.
https://inovasidesa.or.id/2017/09/28/ cabai-sundari-inovasi-petani-jadi-produk-unggulan-desa-lembor/
Subroto, et al.2016. “Identification of Vari -ables Affecting the Determina -tion of Sustainable Agriculture Land in Jombang Regency, East Java . http://ejurnal.its.ac.id/index.php/ teknik/article/view/18297/3194
Sitepu RK. 2002. Impact of Economic Policy and Trade Liberalization on Rice Supply and Demand in Indonesia [Thesis]. Bogor (ID): Bogor Agricultural University.
Koutsoyiannis. 1977. Theory of Econo-metrics: An Introductory Exposition of Econometric Methods. Ed ke-2. London (GB): The MacMillan Press Ltd
Ghozali, 2013. Ekonometrika. Erlangga. Yogyakarta
Gujarati, Damodar, 2003. Basic Econometrics. Jakarta: