CHAPTER III
RESEARCH METHOD
A. Research Design
This study is Quantitative research; quantitative research is inquiry employing operational
definitions to generate numeric data to answer predetermined hypothesis or questions.1 It is using
quantitative approach because quantitative is the data that from of number using statistic data.
The type of this study is Quasi-Experimental design that was not based on the random
assignment of subject to the experiment group and control group. This design was chosen based
the situation of the subject of the study. The writer uses the experimental design because the
writer wants to know the effect of using animation pictures in the teaching learning English
vocabulary process.
In a typical group situation, schedules cannot be disturbed nor classes reorganized to
accommodate a research study. In such a case, one uses groups already organized into classes or
other pre-existing intact groups.
The nonrandomized control group, pre-test and post-test design is one of the most widely
used quasi-experimental designs in educational research.
Table 3.1
Design of pre-test and post-test
Group Pre-test Treatment Post-test
Experiment Group Y I X Y 1
Control Group Y 2 - Y 2
1
Where :
E : Experiment Group
C : Control Group
X : Treatment
Y 1 : Pre- Test
Y 2 : Post- Test
The writer uses the Quasi-Experimental design in this study. Because this study was compare
with two ways and the writer wants to measure the effectiveness of teaching vocabulary
animation picture using that ways.
B. Place of The Study
The studies conducted at academic year 2015/2016. It was conducted until the data complete
from students and to support the data from the English teacher at SMKN 1 Palangka Raya. The
study was about the effect of using animation pictures in teaching English vocabulary to the
tenth grade of SMKN 1 Palangka Raya located in Tambun Bungai street number 77.
C. Population and Sample Of The Study 1. Population of The Study
According to Ary stated that population is defined as all members of any well-defined class
of people, events, or objects.2
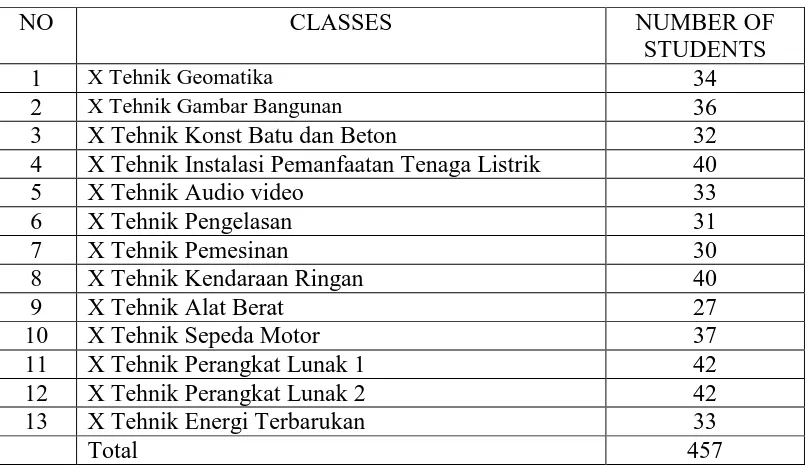
The population of this study the students of the tenth grade student
of SMKN 1 Palangka Raya. There are 457 of the tenth grade students that devided into thirteen
classes.
Table 3.2 The Population of Study
NO CLASSES NUMBER OF
STUDENTS
1 X Tehnik Geomatika 34
2 X Tehnik Gambar Bangunan 36
3 X Tehnik Konst Batu dan Beton 32
4 X Tehnik Instalasi Pemanfaatan Tenaga Listrik 40
5 X Tehnik Audio video 33
13 X Tehnik Energi Terbarukan 33
Total 457
2 Sample of The Study
According to Arikunto, sample is some or represent of population that is researched.3 It is a
group selected from population for observation in a study.
It is class X Tehnique SPM (Tehnik Sepeda Motor) and class X TKR (Tehnik Kendaraan
Ringan ) students who as the sample of the study. There is a condition to take a sample for this
study. That is the teaching of vocabulary of content words of noun, adverb, adjective and verb of
words. In this study the writer was used cluster sampling technique to select group of sample.
Cluster sampling is to list all the members of a target population and select the sample
from among them. Because the unit chosen is not and individual but a group of individual who
are naturally together or group by the school.4
3
Suharsimi Arikunto, Prosedur Penelitian Suatu Pendekatan Praktek, Jakarta: PT. Rineka Cipta, 2002. p. 131.
4
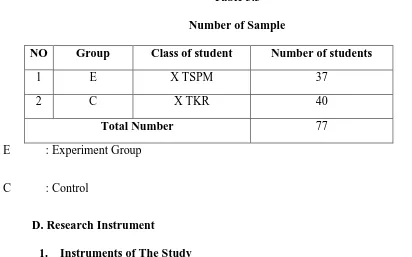
Based on the explanation above, the writer tooktwo classes X TSPM and X TKR which
was related to this study. The sample of the study is as shown in the following table:
Table 3.3 Number of Sample
NO Group Class of student Number of students
1 E X TSPM 37
2 C X TKR 40
Total Number 77
E : Experiment Group
C : Control
D. Research Instrument
1. Instruments of The Study
Instrument is very needed in the study. It is because the instrument is tool to get the data of
study, in which the data is the important things to help the writer in answering the problem of the
study and also to prove the hypothesis. The data also needed to find the aim of study. It is to
measure the effect of using animation picture in teaching english vocabulary to the tenth grade
student at SMKN 1 Palangka Raya. In collecting the data, the writer used instruments as follows:
Test
The writer collected the data of this study by using a test and the result of the test was used
to measurement the students’ vocabulary scores about animation pictures. The test is vocabulary
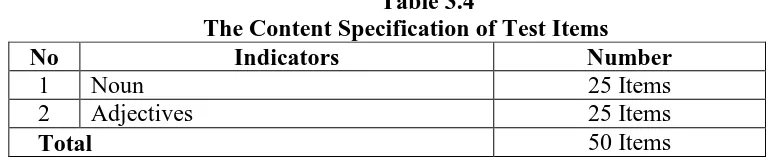
of certain words and word group.5 In this study, the writer used multiple - choice to check the
students’ vocabulary scores and the total number of test is 50 questions.
Table 3.4
The Content Specification of Test Items
No Indicators Number
1 Noun 25 Items
2 Adjectives 25 Items
Total 50 Items
The writer made test based on the material and be appropriated with syllabus that used by
the school.In this study, the writer uses multiple-choice to check the students’ vocabulary mastery. As Madsen’s suggestion that a good vocabulary test type for students who can read in the foreign language is
multiple-choice completion because it makes the students depend on the context clues and sentences meaning.6According to J.B Heaton, he states multiple choices in this type of recognition item the
stem is replaced by a picture. The testis sees the picture and has to select the most appropriate
word relating to the picture from 4 or 5 options.7
The writer gave pre-test and post-test to the both experimental and control group. Where the
items of the test consisted of 40 items, pre test is a test given before the writer gives treatment.
The function of pre test is to know how are the students’ vocabulary scores before they taught by
using animation pictures. Post test is a test given after a lesson or a period of instruction. The
function of post test is to know how are the students’ vocabulary scores after they taught by
using animation pictures.
5
J.B. Heaton, Writing English Language Test, England: Longman, 1975. P. 5. 6
Harold S. Madsen, technique in testing, New York: Oxford University Press, 1983, p.16 7
2. Research Instrument Try Out
The instrument try out is important because the result of try out is used to analyze and to
measure the instrument whether the test has some criterias of qualified test or not. The try out
was given to class X TPM of SMKN 1 Palangka Raya.The were procedures that in carrying out
this try out as follows:
a. The writer made and prepared the instrument of try out consisted of 50 items.
b. The writer tells the students how they must do the test of try out.
c. The writer gave the test items to the students
d. The writer collected the student’s work.
e. The writer calculated the result of the test
f. The writer analyzed the result of the test
g. If the results were valid, it meant that the test items as the instrument of this study is suitable
to be give.
h. Based on the analysis of validity found that there were 40 valid items and 10 invalid items.
3. Research Instrument Validity
Validity is the extent to which theory and evidence support the proposed interpretations of
test scores for an intended purpose.8
The test must aim to provide a true measure of the particular
skill which it is intended to measure.9
So, the writer used test which validity. Validity, on the
other hand, involves the degree to which we are measuring what we are supposed to, more
simply, the accuracy of the measurement does not accurately measure what is it supposed to,
8
Ibid, p. 258 9
there is no reason to use it even if it measures consistently (reliably). The test can be said valid if
it is able to measure what it is suppose to be measure.
To measure the validity of the instrument, the writer used the formulation of Product
∑XY : Multiplication Result between Score X and Y
N : Number of students
Furthermore, it was calculated using Test-t calculation below:
Anas Sudijono, Pengantar Statistik Pendidikan, (Jakarta: PT. Raja Grafindo Persada, 2008), P. 206. 11
Validity is divided into face validity, content validity, construct validity, and empirical
validity. Here, only the first two have been dealt with.12
With the measurement of validity using this criteria :
1) Face Validity
If a test item looks right to other testers, teachers, moderators, and testers.13
It can be
described as having face validity. The test used by the writer is suitable to others and at the same
level that is secondary school level. The face validity of the test items as follow:
a) The kind of test is vocabulary test “which is about nouns and adjective”.
b) The form of test items is multiple choice.
c) The language of item used English.
d) The test items are suitable to the secondary school.
Face validity concerns the appeal of the test to the lay judgment, typically that of the
candidate, the candidate’s family, members of the public and so on. Sometimes the students do
not know what is being tested when they tackle a test.
Sometimes they feel that the test doesn’t test what it is supposed to test. A test has face
validity if it is carefully constructed, it has a sic well thought-out format, its items are clear and
12
Lotfollah Karimi and Ali Gholami Mehrdad, Investigating Administered Essay and Multiple choice Tests in the English Department of Islamic Azad University, Hamedan Branch, Iran: Canadian Center of Science and Education, 2012, P. 70.
13
J. B. Heaton, Language Testing, (Published Tests, May 1989), P. 153. tobserved > ttable = Valid
uncomplicated, its difficulty level is appropriate for students, and the condition for all students is
the same.
2). Construct Validity
This type of validity assumes the existence of certain learning theories or construct
underlying the acquisition of abilities and skills.14
It is concerned with the extent to which a test
measure a specific trait or construct. Specifically, the construct validity measure vocabulary
mastery?15
It is type of validity that is essential for tests that are used to individuals on certain
abilities. Then, to measure the validity of the instrument, the writer is used the formulation
product moment by Pearson as follow:16
r = �. − .( )
(�. X2 − X) 2 .(n. Y2 − ( Y )2
where:
r : Pearson r
∑x : sum of score in X distribution
∑y : sum of score in Y distribution
X2 : sum of squared score in X distribution
Y2 : sum of squared score in Y distribution
∑XY : sum of product of paired X and Y score
14
J. B. Heaton, language testing. 1989. p. 154 15
Donald Ary, Introduction to research in Education; third edition,…. 1985, p 218 16
N : Number of paired X and Y score
The criteria of interpretation for the validity:17
particular course objectives. The test should be constructed as to contain a representative sample
of the course, the relationship between the test items and the cours objective always being
apparent.18
The writer makes question based on syllabus where the topic about descriptive text. A test is said to be content valid if its content constitutes a representative sample of the
language skills, structures, etc. with which it is meant to be concerned. Other terms used for
content validity are curricular validity, course validity, and, text validity.
According to Gronlund “content validity is the process of determining the extent to which
a set of test task provides relevant and representative sample of the domain of tasks under
consideration.”19
To fulfil the content validity, the test content is directly related with have been
taught to the student that have two ways namely using animation pictures like the method of loci
and without using animation pictures.
17
Ibid, p. 116 18
J. B. Heaton, Writing English Language Test, Logman, 1975, p. 153 19
To know the level of test validity, the result was correlated to criteria of r value they are:
0,800 - 1,000 : very high validity
0,600 - 0,799 : high validity
0,400 – 0,599: fair validity
0,200 – 0,399: low validity
0,000 – 0,199: very poor validity.20
The result of validity measurement of test instrument based on the criteria as follows:
(a) If the value of tobserved is greater than ttable , it means that the test item is valid and it
can be used as the instrument of the study.
(b) If the value of tobserved is lower than ttable , it means that the test item is invalid and it
cannot be used as the instrument of the study.
4. Research Instrument Reliability
Reliability also means the consistency with which a test measures the same thing all the
time. Reliability of a test refers to its consistency with which it yields the same rank for an
individual taking the test several times.21
The reliability of the whole test can be estimated by
using the formula:
J.B Heaton state Reliability is a necessary characteristic of any good test: for it to be valid
data all, a test must first be reliable as a measuring instrument. If the test is administrated to the
20
Riduwan, Metode & Teknik Menyusun Thesis, Bandung: ALFABETA, 2004, P.110 21
same candidates on different occasions (with no language practice work taking place between
these occasions). Then, to extent that is produces differing result, it is not reliable. 22
11
The steps in determining the reliability of the test were:
1) Making tabulating of testees’s scores.
2) Measuring the mean of the testees’s scores with the formula :
M== �
3) Measuring the total variants with the formula:
Vt=
∑Y2
= the square of score total
N = the number of testes
4) Calculating the instrument reliability using KR-21.
5) The last decision is comparing the value of 11 and t
6) To know the level of reliability of instrument, the value of 11 was interpreted based
on the qualification of reliability as follows:
0.800- 1.000 : Very High Reliability
0.600-0.799 : High Reliability
0.400-0.599 : Fair Reliability
0.200-0.399 : Poor Reliability
0.000-.0199 : Very Poor Reliability
From the measurement of instrument try out reliability it is known that the whole numbers of
test items are reliable and can be used as the instrument of the study.
5. Index of difficulty
According to Healton the index of difficulty or facility value is the fraction or percentage
of the students who answer the item correctly.23 It is use to show how easy or difficult the
particular item proved in the test. The index difficulty can be known by the formula:
23
J.B Heaton, Language Testing, 1974, P. 172.
11
>table = Reliable
11
FV = � �
Where:
FV = facility value (index of difficulty).
R = represent the number of correct answer.
N = the number of students taking the test.
Then the result of the formula above is related to be value of F.V as in the following on:
F.V 0.00-0.30 = Difficult
F.V 0.30-0.70 = Fair
F.V 0.70-1.00 = Easy
6. Index Homogeneity
Is use to know whether experimental group and control group, that are decided, come
from population that has relatively same variant or not. The formula is: 24
F = Bigger Variant
Smaller Variant
Notice:
F: Frequence
The hypothesis in homogeneity:
Fvalue ≤ Ftable, Means both of variant are homogeneity.
24
Fvalue > Ftable, Both of variant are homogeneity.
If calculation result of F is lower than F table by 5% degree of significance so HO is
accepted, it means both groups have same variant.
7. Index normality
It is used to know the normality of the data that is going to be analyzed whether both group
have normal distribution or not.
Chi square is used here: 25
2 = ( fo−fh )2 fh
Notice:
� = Chi square
fo= frequency from observation
fh= expected frequency
Calculation result of �is compared with x table by 5% degree of significance. If � is lower
than x table so the distribution list is normal.
25
The formula
They are: 26
a. Mean : Mᵡ = �� �
Where:
Mx: Mean
N: Number of case
Fx: Total result product between each score with frequency.
b. Median : M��= 1 + 1 2�−��
�� �
Where:
Mdn: Median
N: Number of ease
Fkb: Cumulative Frequency located in underscore content median
Fi: Authentic frequency ( frequency of score content median )
I: interval class
c. Modus : Mo =1 + � � −� X �
Where:
26
Mo: Modus
Fa: Frequency located in above interval content modus.
Fb: Frequency located in under content modus
d. Standard Deviation
SD= ��2 �
Where:
SD: Deviation Standard
I: interval class
Fx’: total result product between frequency each interval with X
N: Number of class
e. Standard Error
Sem = �� �−1
E. Data Collection Procedures
To get the data, the writer uses some ways in this study. Those ways are:
1. The writer chose the place of the study.
2. The writer made instrument try out.
3. The writer showed the try out to the class that have been determined
5. The writer checked the result of test of try out.
6. The writer gave pre test to both classes.
7. The writer checked the result of pre test.
8. The writer was gave treatment to both classes. Experiment group using ( animation picture)
and than control group using another media that is using ( plash card)
9. The writer gave post test to both classes.
10. The writer checked the result of post test.
11. The writer gave score to students’ answer (pre test and post test).
A. Data Analysis Procedures
To analyze the data has been collected; the writer uses some procedures in this study:
1. The writer collected score of test (pre test and post test).
2. The writer analyzed the data have been collected.
3. The writer gave score to the students’ test result by using the formula:
Score :�
� x 100%
B: frequency of the correct answers
N: number of test item
4. Tabulating the students’ score into distribution of frequency in the table, then find out the
mean of students’ score, standard deviation, and standard error of variable X1
(Experimental group) and X2 (Control group).
5. Calculating the data by using t-test to test the hypothesis of the study, whether the use
writer used t-test. Test “t” or “t” Test is statistical test which is used to examine the truth or
falseness of null hypotheses states that between two of Sample Mean taken randomly from
the same population, there is no significant different. 27
“t test” is used to measure whether
animation pictures give effect to students’ english score using the formula as follows: 28
M1 – M2
To know the hypothesis is accepted or rejected using the criterion:
If t-test (the value) ≥ ttable,it means Ha is accepted and Ho is rejected.
If t-test (the value) < ttable,it means Ha is rejected and Ho is accepted.
B. Interpreting the result of t-test. Previously, the writer counted the degrees of freedom (df)
with the formula: 29
Anas Sudijono, Pengantar Statistik Pendidikan,Jakarta : RajaGrafindoPersada, 1987, p.278. 28
Ibid, p. 284. 29
After that, the value of ttest was consulted on the ttable at the level of significance 1 % and 5
%. In this research, the writer uses the level of significance at 5 %. If the result or t-test is
higher than ttable, it means Ha is accepted.
6. The writer made the conclusion of data analysis obtained.