ENHANCING STUDENTS’ UNDERSTANDING OF STATISTIC
USING TI-NSPIRE GRAPHING CALCULATOR
Nor’ain Mohd. Tajudin 1,Noraini Idris2 1
Universiti Pendidikan Sultan Idris, Tanjong Malim, Perak 2
Faculty of Education University of Malaya
ABSTRACT
In general, the potential for graphing calculators (GC) to radically change the teaching of Statistics is enormous. Students can analyze data numerically and graphically, compare expected results to observe results, create models to describe relationships, and generate simulations to understand statistical situations in ways that would not be possible without technology. Further, it allows students to use real data in real situations, move easily between tabular representations, graphical representations, and symbolic representations of the data, and provides the opportunity to think about how each representation contributes to understanding the data. These activities will enable students to create relationships in their own minds and constructing their own knowledge derived from basic knowledge and experiences during statistics classes. This paper elaborates how the TI-Nspire GC can be used to enhance students’ understanding in learning Statistics and presents a quasi-experimental study which investigates form four students’ performance in learning Statistics using the tools. The results showed that students in the experimental group (GC strategy) had significantly better scores in the Statistics Achievement Test than those from the control group (conventional instructional strategy). These findings indicate that students who were exposed to the use of TI-Nspire GC performed better in the test. The use of this strategy enables students to exploit the fullest advantages of the use of GC in achieving in-depth understanding of statistical concepts and facilitating students in solving statistical problems.
Keywords: Graphing calculator, TI-Nspire graphing calculator strategy, conventional instructional strategy, statistics for secondary school
INTRODUCTION
implementation of using graphic calculator in teaching and learning of mathematics. In comparison, countries such as England, Australia, Singapore, Thailand, Japan and United States of America has longed implement the usage of graphic calculator as early as 1998. Since the scientific calculators are already used in the Malaysian Certificate Examination level, it would also be timely to think about using graphing calculators in the context of mathematics teaching and learning and thus in Malaysian public examination. This would bring Malaysian secondary mathematics education to be at par with other countries and thus, it is worth to spend a large amount of money acquiring the handheld devices.
Even though graphing calculators were distributed to several selected schools in 2002, not much success has been recorded as to their use in mathematics classroom practices. Most probably, the problem is that most teachers have not learnt mathematics using these technology tools before hence they were lack of knowledge of technological pedagogical content knowledge (TPCK) on how to use them in mathematics teaching. According to a study by Effandi and Norazah (2007), two factors have been identified as the main factors in the application of technology in the teaching and learning of mathematics. The first factor is the teachers’ perception that the use of technology is not able to help in the teaching and learning of mathematics. This was further worsened by the fact that teachers always claim that they do not have sufficient time to prepare for ICT integrated lessons. According to a research by Haslina et al. (2000), in the present teachers’ professional development courses, there are hands-on activities but this was not supported by relevant modules or manuals for the facilitators and the course participants. The activities conducted in those courses are teacher-centered and in most situations, courses are conducted using softcopy materials supplied by vendors. The approach was rather ineffective in the learning of the particular software which normally requires active participation from the participants.
Mathematics teachers need preparation in identifying what and how to teach in the era of 21st century. They need guidance to be able to do and how do they need to develop this knowledge for teaching mathematics. In other words, to be prepared to teach mathematics, teachers need an in-depth understanding of mathematics (content), teaching and learning (the pedagogy), and TPCK – “an overarching conception of their subject matter with respect to technology and what it means to teach with technology” (Niess, 2005, p.510). TPCK for teaching with technology means that as teachers think about particular mathematics concepts, they are concurrently considering how they might teach the important ideas embodied in the mathematical concepts in such a way that the technology places the concept in a form understandable by students.
Thus, this research attempts to provide the current best practices in integrating the use of latest graphing calculator technology (i.e. TI-Nspire) in teaching and learning of mathematics, to compare the effects of using graphing calculators in teaching and
learning of mathematics on students’ performance hence expanding the knowledge base for these technologies.
Mathematical Understanding and the Use of TI-Nspire Graphing Calculator
According to Skemp (1976, 1978), the concept of ‘understanding’ is a faux amis. He looks at understanding mathematics from two perspectives, both of which fulfill particular functions in everyday life. They are relational understanding and instrumental understanding. The former refers to knowing both what to do and why while the latter is only the ability to apply rules (knowing what to do) but without knowing the reasons (the why). Skemp (1978) further mentions that instrumental understanding is just a piece of rote memorization of basic skills and algorithms while relational understanding is robust, connected and full of interconnecting ideas and less dependence on memory. The knowledge acquired by a learner instrumentally might be rendered useless if the learner confronts a slightly different problem situation while knowledge gain through relational understanding is more adaptable to new tasks.
Perkins (1993) and his colleagues at Harvard University formulate a concept of understanding based on the performance perspective. Briefly, this performance perspective mentions that understanding a topic of study is concerned with the ability to perform in a variety of thought-demanding ways relating to the topic. Examples of thought-demanding ways are explaining, gathering evidence, finding examples, generalizing, applying concepts, analogizing and representing in a new way. Perkins (1993) further stresses that the more thought-demanding performances the student can display, the more confident the teacher would be that the student understands.
Hiebert and Carpenter (1992) define understanding in terms of the way information is represented and structured. They argue that the mathematical idea, procedure, or fact is understood if its mental representation which is the internal network is part of a network of representations. The number and the strength of the connections will determine the degree of understanding. Further, mathematical idea, procedure, or fact is understood thoroughly if it is linked to existing networks with stronger or more numerous connections. Hiebert and Carpenter also emphasized that the connections which create networks form several kinds of relationships, including similarities, differences, and inclusions and subsumptions.
Recently, Carpenter and Lehrer (1999) characterized understanding in mathematics and science in terms of mental activity. This mental activity contributes to the development of understanding and not as a static attribute of a person’s knowledge. The five forms of mental activity are; constructing relationships, extending and applying mathematical and scientific knowledge, reflection, articulation, and making knowledge one’s own.
Basically, the notions of understanding put forward by Skemp (relational understanding), Perkins (performance perspective), Hiebert and Carpenter (representation of knowledge) and Carpenter and Lehrer (five forms of mental activity) all point to the same thing; the main ingredient in understanding should be the ability of the learners to retain what they learn and transfer it meaningfully to novel situations.
The instrumental knowledge of statistics is knowledge of a set of planning that is fixed for performing statistics tasks. The characteristic of these plans is that they prescribe a step-by-step procedure to be followed in performing a given task, with each step determining the next (Skemp, 1978, p.14). However, the process of learning statistical concepts and skills are active. The students should learn by investigating, exploring, and collecting data by themselves. These activities will enable students to create relationships in their own minds and constructing their own knowledge derived from basic knowledge and experiences during statistics classes. These activities would have been too difficult to attempt without technology. Exploratory activity in statistics lesson may facilitate an active approach to learning as opposed to a passive approach where students just sit back passively listening to the teacher. This creates an enthusiastic learning environment. This clearly shows the application of constructivist learning environment.
One form of technology, the graphing calculator, has “become one of the most widely adopted technologies in education because they are a proven-effective, affordable, handheld device with direct linkages to curricula” (Roschelle & Singleton, 2008, p. 951).TI-Nspire technology extends current graphing calculator technology in ways that fit with research recommendations (Centre for Technology in Learning, SRI International, 2007). Specifically, TI-Nspire learning handhelds have bigger, sharper screens, allowing graphs to be explicitly labelled and for students to see graphed functions in more detail. Two important enhanced capabilities of the TI-Nspire graphing calculator are dynamically-linked multiple representations and save and review of student work.
Previous graphing calculators were designed with a screen that allowed for individual representation of mathematical analysis (e.g., students were unable to view a graph of a function and the mathematical equation at the same time). The TI-Nspire technology can display up to four representations namely algebraic, graphical, geometric, numeric and written on the same screen. These representations can be dynamically linked, so that changes made to one representation of a concept are automatically reflected in others instantly. Changes can be viewed simultaneously across multiple representations. The Centre for Technology in Learning (2007) noted that these linked representations helped focus students’ attention on the relationships among algebraic equations, graphs, and tables of data.
Furthermore, with TI-Nspire technology, students and the teacher can create, edit and save a sequence of mathematical steps in a document that can be saved and later re-opened. Research suggests that the save and review feature can improve teaching and learning by enhancing reflection, enabling formative assessment and increasing academic learning time. Ng. (2011) stated that the TI-Nspire should be used to stimulate students to think mathematically so that they can engage strongly with mathematical structures and concepts in ways that are not possible with traditional paper and pencil approaches.
In this study, by using the tool such as the TI-Nspire graphing calculator, students may have the benefits in developing their understanding of statistical concepts including grasp of basic concepts before they study further advanced topics. Therefore, in order to help students learn statistics with understanding the teacher should facilitate the construction of ideas concepts and processes through a careful selection of resource materials and relevant with the real world problems. Rather than just development of mechanical and computational skills, TI-Nspire graphing calculators also allow for cultivation of analytical adeptness and proficiency in complex thought process. Problems representing real-world situation and data with complicated numbers can also be addressed. This would offer new opportunities for students to encounter statistical ideas not in the curriculum at present. With appropriate use of the graphing calculator, students can avoid time-consuming, tedious procedures and devote a great deal of time concentrating on understanding concepts, developing higher order thinking skills, and learning relevant applications. In addition to paper-and-pencil, mental and estimation skills, the graphing calculator assists student to execute the procedures necessary to understand and apply the statistical concepts.
In this study, statistics achievement is one of the variables investigated by introducing the graphing calculators, specifically the TI-NSpire as teaching and learning tool in the mathematics classroom. Specifically, this study will find out whether the use of the TI-Nspire graphing calculators by students and teachers in the teaching and learning of the Statistics topics effective in increasing student achievement.
RESEARCH QUESTIONS
The research questions for this study are:
1. How TI-Nspire graphing calculator can be used to enhance students’ understanding in learning the Statistics topic?
2. What are the effects of TI-Nspire graphing calculator on the Statistics achievement of Form Four (16 years old) students?
METHODS AND PROCEDURES
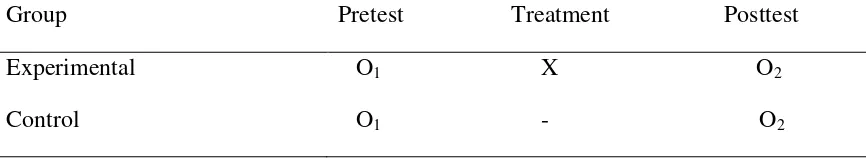
This study was a case study and employed the quasi-experimental nonequivalent control-group pretest posttest design. Figure 1 shows the diagrammatic representation of the nonequivalent control-group pretest posttest design. An X indicates an experimental treatment, and a “dash” indicates no experimental treatment. The O1s indicate the measurements made during the pretest while the O2s indicate the measurements made during the posttest. A pretest and post test was administered to both the control and experimental groups. The experimental group underwent an intervention where they learnt mathematics using the TI-Nspire CX graphing calculator for four weeks while the control group on the other hand learnt mathematics using conventional learning method. The conventional instruction strategy was a whole-class instruction. Students were not allowed to use the TI-Nspire graphing calculator. The following are the activities which were used by the teacher in the classroom; teacher explains the mathematical concepts using only the blackboard, teacher explains on how to solve mathematical problems related to the concepts explained, students are given mathematical problems to be solved individually, teacher handles discussion of problem solving, and teacher gives the conclusion of the lesson
Group Pretest Treatment Posttest
Experimental O1 X O2
Control O1 - O2
Figure 1. Research Design of the Study
The sample of the study was selected purposely from two secondary schools in Perak State, Malaysia. Results of Form Four students in the two selected schools were examined. Students from the average classes were selected as accessible group. For this purpose, the best and weakest classes were omitted as these groups of students may not have the same characteristics as those from the average classes. The fish-bowl which is the most unbiased sampling technique was used to select two intact classes of average students (Nachmias & Nachmias, 1981).For each school, one of the classes served as the experimental group (graphing calculator strategy group) while the other class served as the control group (conventional instructional strategy group). The total number of students in the sample was 49 in the control group and 46 in the experimental group.
The Statistics Achievement Test (SAT) is designed by the researcher to measure students’ performance on the Statistics topics. Initially, a test specification table for SAT is prepared by the researcher incorporating the different levels of ability or achievement according to Blooms Taxonomy. Furthermore, it was constructed based on the Form Four mathematics syllabus and the Form Four mathematics textbooks. It was a systematic formal test, using a paper-and-pencil procedure and it produced
numerical scores. The test covered four main Statistics subtopics vis-à-vis measures of central tendency and dispersion, concepts of histogram, concepts of frequency polygons and concepts of cumulative frequency. All the questions are submitted to the validators for content validation. The reliability index of Cronbach’s coefficient alpha SAT was determined to be 0.70. Thus, the reliability of the test is considered sufficiently acceptable.
The SAT was administered to all students in the sample. The test was conducted on two occasions as a pre-test, and post-test. The purpose of the pre-test was to examine the students’ prior knowledge in order to provide a baseline before the experiment. The post-test was used to measure the students’ knowledge after the treatments had been applied.
The data collected from the research instruments was analyzed quantitatively to answer the research questions. Data were obtained from the pretest and posttest of Statistics Achievement. The statistical analysis software SPSS was utilized to calculate the mean and standard deviation of the scores from the control and experimental groups of each participating school. In this study, firstly, the independent mean t-test was conducted on the SAT scores to determine if the difference between the experimental group and the control group of each participating schools prior to the intervention is significant or not significant. If the tests show that the difference between the two groups prior to the treatment is not significant, then the independent mean t-test will be conducted on the scores of the post-tests of each participating schools to determine whether the difference between the experimental group and the control group after the treatment is significant or not significant. If the tests show that the difference between the two groups prior to the treatment are significant, then the ANCOVA test will be conducted on the scores of the post-tests of each participating schools to determine whether the difference between the experimental group and the control group after the treatment is significant or not significant. The ANCOVA is used in this case as it will make correction to the difference that existed between the experimental and control groups prior to treatment so that the difference observed between the experimental and control groups after treatment is only due to the treatment and not because of the difference that existed between the two groups earlier (Fraenkal & Wallen, 2006). The use of the ANCOVA will also enable the study to determine whether the difference between the experimental and control groups after the treatment is significant or not significant.
How TI-Nspire Graphing Calculator can be used to Enhance Students’ Understanding in Statistics Topic
The following examples show how the TI-Nspire graphing calculator can be used to enhance students’ understanding in the Statistics Topic. There were two examples of lessons given in this article. Both examples were explained briefly in this article.
Lesson 1 consisted of two activities. The first activity was to achieve the learning objective of understanding a set of data by using a measures of central tendency and measures of dispersion. In this activity, the learning outcomes were students will be able to
1. Identify the types of statistical data- ungrouped data and grouped data.
2. Explore and calculate various measures of central tendency and measures of dispersion using TI-Nspire graphing calculator
3. Explore and predict the changes to measures of central tendency and measures of dispersion using TI-Nspire graphing calculator when the data change.
4. Predict and create formulas for measures of central tendency and measures of dispersion.
In this first activity (ungroup data), students will create a column for a data using “Add Lists & Spreadsheet to: New Document”. They will find the statistical calculation of the data using the statistical menu and the One-Variable Statistics box. Then, teacher needs to change the values of the data, and try to discuss the changes of each measure of central tendency and dispersion. Students will explore the possibilities of varying the data. In addition, teacher can guide students to give the definition of each measure and can ask students to predict the formula for each measure.
In second activity (group data), student will create four columns for the lower boundaries, upper boundaries, mid-points and frequencies of the data. To find the statistical calculation, students will do the same thing as for the ungroup data for Activity 1.As in Activity 1, teacher needs to change the values of the data, and try to discuss the changes of each measure of central tendency and dispersion. Students will explore the possibilities of varying the data. Teacher can also guide students to give the definition of each measure and can ask students to predict the formula for each measure. In addition, teacher will ask students to give opinions about the difference between Activity 1 and 2, and give the conclusion of doing these two activities.
Lesson 2 also consisted of two activities to understand the concept of histogram. The learning outcomes were students will be able to
1. Draw a histogram for ungrouped data and grouped data with equal class width using TI-Nspire using TI-Nspire graphing calculator.
2. Interpreting the information from histogram.
3. Explore and analyze the data from the histogram to solve statistics problem.
In the first activity, students will use the same set of ungroup data as in Activity 1 in Lesson 1(save in file named “score”) to create a histogram. Students will create a histogram by choosing 5: Add Data & Statistics, and 3: Histogram. Students can draw the histogram by touching their touchpad and move the cursor to each bar of the histogram or pressing the menu and choose 4: Analyze and A: Graph Trace. Based on students’ experience in Activity 1(Lesson 1), the teacher can ask students to change the class interval of the histogram based on the criteria such as : (i)Size of class interval: 4. (ii) The lower boundary of the first class interval: 3.5. Then, students can discuss the
changes that they had explored. As described, the students were able to build their plots to explore and analyze the data
For activity 2, students will use the set of group data as in Activity 2 in Lesson 1(save in file named “study time”) to create a new histogram. The teacher will ask students to discuss the steps that they need to be considered before drawing the histogram for grouped and ungrouped data. Then, teacher will ask students to do group discussions to solve problems related to the concepts of histogram in daily life using the TI-Nspire activity.
Students’ Achievements in Statistics Topics
Students’ Statistics achievement was measured by the overall test performance in Statistics Achievement Test (SAT). The test was a systematic formal test, using a paper-and-pencil procedure and it produced numerical scores. The total test performance for the SAT was 34. The test was conducted in the 4 sample schools twice, firstly as a pretest before the study and again as a posttest at the end of the study.
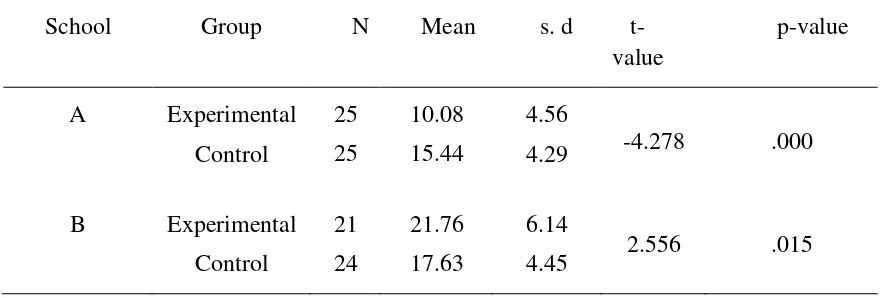
Table 1. Mean, standard deviation and t-values for both groups for pretest
School Group N Mean s. d
t-Table 1 shows the means and standard deviations for pre-SAT test for both experimental and control groups for School A and B. The results show that in pre-SAT test, the control group had a mean score of 15.44 (standard deviation = 4.29) and the experimental group had a mean of 10.08 (standard deviation = 4.56). The computed t-value between the pretests of the control and experimental group is -4.278 at p = .000. Hypothesis testing shows that this value is significant at p < 0.05. This also mean that the students in the control and experimental were not similar in their achievement in the Statistics topic prior to the treatment. For School B, the control group had a mean score of 17.63 for the pre- SAT test (standard deviation = 4.45) and the experimental group had a mean of 21.76 (standard deviation = 6.14). The computed t-value between the pretest of the control and experimental groups is t=2.556 at p = .015. Hypothesis testing shows that this value is significant at p < 0.05. This indicates that both groups were differs in their SAT tests prior to the treatment. Therefore, the ANCOVA test is conducted on the scores of the post-SAT tests to determine whether the difference
between the experimental group and the control group after the treatment is significant or not significant for both schools.
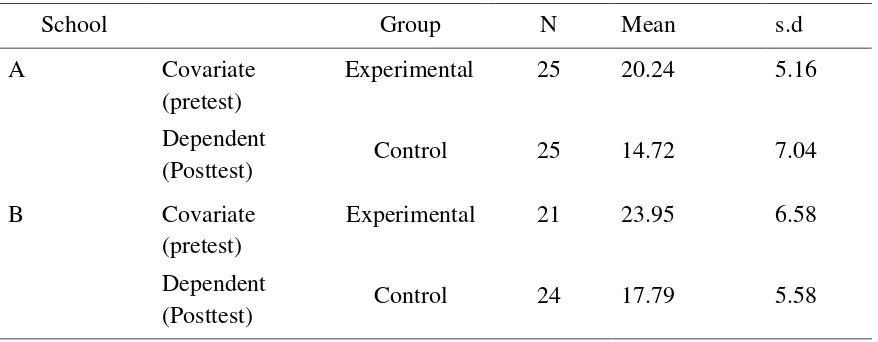
Table 2. Mean, standard deviation for experimental and control groups on pre and posttests of SAT
School Group N Mean s.d
A Covariate
(pretest)
Dependent (Posttest)
Experimental 25 20.24 5.16
Control 25 14.72 7.04
B Covariate
(pretest)
Dependent (Posttest)
Experimental 21 23.95 6.58
Control 24 17.79 5.58
Means and standard deviations of the students’ achievement in SAT tests based on the posttest given are shown in Table 2. For School A, the post-SAT test mean for the experimental group was 20.24 (standard deviation = 5.16) and the posttest mean for the control group was 14.72 (standard deviation = 7.04). Using the analysis of covariance, there was a significant difference on the mean performance scores in the SAT between the experimental and the control groups (F(1, 48) = 10.38, p < 0.05, partial eta squared = .181). The findings of the ANCOVA showed that the experimental group performed significantly better that the control group in learning Statistics topic.
For School B, the post-SAT test mean for the experimental group was 23.95 (standard deviation =6.58) and the posttest mean for the control group was 17.79 (standard deviation = 5.58). Using the analysis of covariance, there was a significant difference on the mean performance scores in the SAT between the experimental and the control groups (F(1, 43) = 5.272, p < 0.05). These findings indicate that the experimental group significantly performed better than the control group in learning the Statistics topic for both schools.
DISCUSSIONS
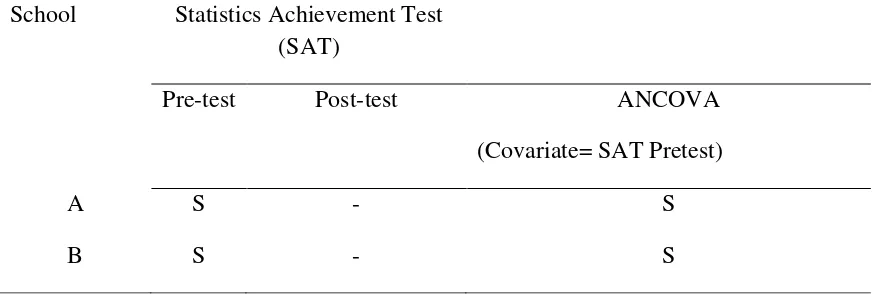
Table 3 presents the summary of the results of the independent means t-test at p< .05 for 2 secondary schools involving students’ statistics achievement in the topic of Statistics. The pretest results of both School A and B showed that students’ achievement from both control and experimental groups were not similar. However, the post test results indicated that students from the experimental group performed better than the control group. The findings indicate that students who were exposed to the use of graphing
calculators performed better in the test. Therefore, the findings have shown that the use of graphing calculators by students in the learning of Statistics is effective in improving their achievement. This study confirms other earlier studies (Nor’ain et al.,2011;Horton et al., 2004; Noraini Idris, 2004, Acelajado, 2004; Noraini Idris et al., 2003; Connors & Snook, 2001; Graham & Thomas, 2000; Hong et al., 2000; Adams, 1997; Smith & Shotberger, 1997; Quesada & Maxwell, 1994; Ruthven, 1990). The consensus of these reviews was that students who use graphing calculators displays better understanding of various mathematical concepts, improved problem solving, and higher scores on achievement tests.
However, this study contradicted a few study such as by Wilson and Naiman (2004), Upshaw (1994) and Giamati (1991) where their results have shown that the graphing calculator group had negative impact on students’ achievement. Their findings showed that that the graphing calculator group had not acquired effective schemas that enabled transfer to be enhanced due to the short duration of intervention (two weeks) whereby the learning of using the graphing calculator may have interfered with learning of the mathematical content. In this study, a long-term (four weeks) use of the tool was sufficient in establishing better students’ performances.
Table 3. Summary of the results of the t-tests for the students’ Statistics achievement
School Statistics Achievement Test (SAT)
Pre-test Post-test ANCOVA
(Covariate= SAT Pretest)
A S - S
B S - S
Note: S=significant at p<.05
Probably the use of graphing calculators assisted students in their learning of this topic because statistics concepts can be visualized through these graphing calculators to enhance their understanding. Also, graphing calculators allow visualization and drawing of graphs and constructing histogram, frequency polygon, ogive, which can help students grasp the statistical concepts. The use of graphing calculators provides opportunities for students to explore statistical concepts and encourage more learning activities in the mathematics classroom. Hence, supports better grasp and understanding of statistical concepts, leading to better achievement results.
Another reason for the marginally better performance of the TI-Nspire group could be that using this tool in learning mathematics makes less cognitive demand (reduction of
cognitive load) because a larger part of the cognitive process is taken over by the graphic calculator (Salomon et al., 1992; Pea, 1985). This allows students to focus attention on the problem to be solved rather than the routine computations, algebraic manipulations or graphing tedious graphs which require the switching of attention from the problem to the computation and then back to the problem. This means that reduction of cognitive load and distribution of cognition in graphing calculator medium requires students to focus only on one aspect and enhance the understanding of Statistical tasks. Therefore, more individual will be able to perform statistical tasks and allow them to work on application problems, thus stimulate students’ interest and facilitate the teaching and learning of Statistics.
In this study, it is important to note that students are no longer passive absorbers of information but rather constructive participants in the learning process. The TI-Nspire graphing calculator allowed them to interact with their environment by exploring and manipulating the graphing displays, checking the accuracy of the solution or observing the effect of different parameters in a problem on graphical displays. This findings confirmed with Bruner (1977) which stressed that active learning environment provide opportunity for students to understand and remember concepts they had discovered in their own exploration.
IMPLICATIONS TO TEACHING AND LEARNING
The use of graphing calculators provides an alternative to teaching mathematics. It allows more flexibility in terms of student activities. Students are exposed to activities that encourage exploration of mathematical concepts and this will help students see mathematics as a ‘fun’ subject.
TI-Nspire graphing calculators also assist teachers in maximizing the teaching time in the classroom. For example, teachers can very quickly show students different types of representation of data with the use of graphing calculators and they do not have to waste time construct the graphs, histogram, frequency polygon etc. manually. This will also allow teachers to encourage more student-centered activities. Through these activities students will be encouraged to do more discussion and group work.
In addition, teachers can make the best use of this technology by employing the “balanced approach”. This approach can be achieved by routinely employing three strategies that were recommended by Waits and Demana (2000): solves analytically using traditional paper and pencil algebraic methods, and then supports the results using a graphing calculator, solves using a graphing calculator, and then confirms analytically the result using traditional paper and pencil algebraic methods, and solves using graphing calculator when appropriate (because traditional analytic paper and pencil methods are tedious and/or time consuming or there is simply no other way!). It is hoped that this approach will exploit the fullest advantages of the use of graphing
calculator in achieving in-depth understanding of mathematical concepts and facilitating students in solving mathematical problems.
In this study, integrating the use of TI-Nspire graphing calculator in teaching and learning of topic, namely the Statistics shows promising implications for the potential of the tool in teaching Statistics at the Malaysian secondary school level. The findings from this study have provided valid evidence that to a certain extent, the TI-Nspire graphing calculator strategy is superior to conventional instruction strategy. Integrating the use of this tool can be beneficial for students as this instructional strategy has proven to improve students’ statistical performance.
In the past, students only produced numerical summaries such as the mean, mode, standard deviation (SD) or range. Making plots was a tedious task, and calculating the SD seems to have been considered so complicated that often it was not taught until students were nearly finished with their formal schooling, if ever. Consequently, students had little experience with variability and understanding its importance, with inspecting distributions and understanding how they can have the same characteristics yet be very different, with looking at alternative displays of the same data and understanding how they each reveal something new about the data. Here, the TI-Nspire graphing calculators make these ideas accessible. This technology has expanded the range of graphical and visualization techniques to provide powerful new ways to assist students in exploring and analyzing data and thinking about statistical ideas, thus allowing them to focus on interpretation of results and understanding concepts rather than on computational mechanics.
Furthermore, students will be able to build their histogram using the TI-Nspire graphing calculators, hence to explore and analyze the data. Students can investigate relationships between different categories within the data. For example, they can investigate whether there is any difference in the amount of change carried by boys and girls. This tool also allows students to move from constructing plots to thinking about the information that the plots convey. Students can consider more questions, such as describe the difference between the amount of change carried by boys and by girls, what do you think a histogram of the amount of change for girls would look like? Why is the X not an outlier in the box plot for the change carried by boys or girls? These activities will deepen their understanding of data analysis and came up with the solutions to the questions given. Furthermore, this learning strategy gives students and teachers more opportunities for communication, feedback, reflection, critical and reasoning thinking and hence creating a conducive learning environment.
Acknowledgment
The authors would like to express their appreciation to Malaysian Ministry of Education for kind contribution of Knowledge Transfer Grant no 057007-2012-004-02 for the financial support in this research.
REFERENCES
Acelajado, M. J. (2004). Use of graphing calculator: Effect on students’ achievement in ANMATH1 and anxiety in mathematics, In Yahya Abu Hassan, Adam Baharum, Ahmad Izani Mohd. Ismail, Koh Hock Lye and Low Heng Chin (Eds.) Integrating Technology in the Mathematical Sciences. USM Proceeding Series. Pulau Pinang: Penerbit Universiti Sains Malaysia,.
Adams, T. L. (1997). Addressing students’ difficulties with the concept of function: applying graphing calculators and a model of conceptual change. Focus on Learning Problems in Mathematics, 19(2),43-57.
Bruner, J. S. (1977).Process of Education. Cambridge, MA: Harvard University Press. Carpenter, T., & Lehrer, R. (1999). Teaching and learning mathematics with
understanding.In E. Fennema, & T. Romberg (Eds.), Mathematics classrooms that promote understanding(pp. 19-32). Mahwah, NJ: Lawrence Erlbaum Associates. Center for Technology in Learning, SRI International. (2007). The pedagogical
potential of TI-Nspire. (Research Note 9). [Brochure]. Retrieved from http://education.ti.com/sites/UK/downloads/pdf/ResearchNotes-Why TI-Nspire.pdf
Connors, M. A. and Snook, K. G. (2001). The effects of hand-held CAS on students achievement in a first year college core calculus sequence. The International Journal of Computer Algebra in Mathematics Education, 8(2),99-114.
Effandi Z. , Md.Yusoff, D. & Norazah, M. N. (2007). Technology in Teaching and Learning Mathematics. In Effandi Zakaria, Norazah Mohd Nordin, Sabri Ahmad(Eds), Trend in Teaching and Learning Mathematics. 1-14, Kuala Lumpur: Utusan Publications.
Fraenkel, J. R. & Wallen, N. E. (2006). How to Design and Evaluate Research in Education. New York: Mc Graw-Hill.
Gage, J. (2002). Using the graphic calculator to form a learning environment for the early teaching of algebra. The International Journal of Computer Algebra in Mathematics Education, 9(1),3-28.
Giamati, C. M. (1991). The effect of graphing calculator use on students' understanding of variations on a family of equations and the transformations of their graphs. (University of Michigan, 1990). Dissertation Abstracts International, 52, 103A. Graham, A. T. & Thomas, M. O.J. (2000). Building a versatile understanding of
algebraic variables with a graphic calculator. Educational Studies in Mathematics. 41(3),265-282.
Hong, Y., Toham, M., & Kiernan, C. (2000). Supercalculators and university entrance calculus examinations. Mathematics Education Research Journal, 12(3),321-336. Horton, R. B., Storm, J. & Leornard, W. H. (2004). The graphing calculator as an aid to
teaching algebra. Contemporary Issues in Technology and Teacher Education, 4(20),52-162. Hylton-Lindsay, A. A. 1998. The Effect of the Graphing Calculator on Meta-cognitive
Haslina A. , Yuzita, Y., Maryati, M. Y.& Rodziah, L. (2000). Implications of introducing Technology in Mathematics, Proceedings of the International Conference on Teaching and Learning, pp. 934-943.
Hiebert, J., & Carpenter, T. (1992). Learning and teaching with understanding. In D. Grouws (Ed.), Handbook of research on mathematics teaching and learning (pp. 65 - 100). Reston, VA: National Council of Teachers of Mathematics.
Keller, B., & Russell, C. (1997). Effects of TI-92 on calculus students solving symbolic problems. International Journal of Computer Algebra in Mathematics Education, 4, 77-97.
Lim C. S. & Kor L. K. (2004). Teaching statistics with graphical Calculators in Malaysia: Challenges and constraint. Micromath, 20(2),30-33.
Malaysian Ministry of Education (2012). Integrated Mathematics Curriculum forSecondary School. Kuala Lumpur: Kementerian Pendidikan Malaysia. Nachimias, D. & Nachimias, C. (1981).Research Methods in the Social Sciences
(2ndedition).New York: St. Martin’s Press.
Ng Wee Leng (2011) Using an advanced graphing calculator in the teaching and learning of calculus, International Journal of Mathematical Education in Science and Technology, 42(7), 925-938, DOI: 10.1080/0020739X.2011.616914.
Nor’ain M. T., Rohani A. T., Mohd Majid, K. & Wan Zah W. A. (2009). Instructional Efficiency of The Integration if Graphing Calculators in Teaching and Learning Mathematics. International Journal of Instruction, 2(2), 11-30.
Nor’ain M. T., Rohani A. T., Mohd Majid, K. & Wan Zah W. A. (2011). The Use of Graphing Calculators in Teaching and Learning of Mathematics on Performance and Metacognitive Awareness. American International Journal of Contemporary Research, 1(1), 59-72.
Noraini, I& Chew, C. M. (2011). Effect of Graphic Calculator-Based Performance Assessment on Mathematics Achievement. Academic ResearchInternational, 1(1), 5 -14.
Noraini, I. (2003). Communication in Mathematics: Usage of Graphing Calculator, InProceedings of the 1st National Conference on Graphing Calculators, Universiti Malaya, Kuala Lumpur, Malaysia, July 11-12, 2003. Kuala Lumpur: Faculty of Education, University Malaya.
Noraini, I. (2004). Exploration and Entertainment Mathematics: Why Graphics Calculator? In Rosihan M. Ali, Anton Abdulbasah Kamil, Adam Baharum, Adli Mustafa, Ahmad Izani Md. Ismail & V. Ravichandran. Proceedings of the 2nd National Conference on Graphing Calculators, Penang, Malaysia, Oct. 4-6, 2004. Pulau Pinang, Malaysia: Penerbit Universiti Sains Malaysia.
Noraini Idris (2006). Exploring the effects of TI-84 plus on achievement and anxiety in Mathematics. Eurasia Journal of Mathematics, Science and TechnologyEducation, 2(3),66-78.
Niess, M. L. (2005). Preparing teachers to teach science and mathematics with technology: Developing a technology pedagogical content knowledge. Teaching and Teacher Education, 21, 509-523.
Pea , R.D. 1985. Beyond amplification: using the computer to recognize mental functioning,Special issue: Computers and education. Educational Psychologist, 20(4), 167-182.
Perkins, D. (1993). An apple for education: Teaching and learning for understanding. American Educator, 17(3), 28-35.
Quesada, A. R. and Maxwell, M. E. (1994). The effects of using graphing calculators to enhance college students’ performance in precalculus. Educational Studies in Mathematics. 27,205-215.
Roschelle, J., & Singleton, C. (2008). Graphing calculators: Enhancing math learning for all students. In J. Voogt & G. Knezek (Eds.), International Handbook of Information Technology in Primary and Secondary Education. (pp. 951-962). New York, NY: Springer.
Ruthven, K. (1990). The influence of graphic calculator use on translation from graphic to symbolic forms. Educational Studies in Mathematics, 21, 431-450.
Salomon, G., Perkins, D. N. & Loberson, T. G. (1992). Partners in cognition: Extending human intelligence with intelligent technologies. Educational Researcher, 20(3), 2-9.
Skemp, R. (1976). Relational understanding and instrumental understanding. Mathematics Teaching, 77(December), 20-26.
Skemp, R.R. (1978). Relational understanding and instrumental understanding. Arithmetic Teacher, 26(3), 9-15.
Smith, K. B. and Shotsberger, P. G. (1997). Assessing the use of graphing calculators in college algebra: Reflecting on dimensions of teaching and learning. School Science and Mathematics. 97 (7), 368-377.
Upshaw, J. T. (1994). The effect of the calculator-based, graph-exploration method of instruction on advanced placement calculus achievement. (University of South Carolina, 1993). Dissertation Abstracts International,54, 4023A.
Waits, B. & Demana, F. (2000). The role of graphing calculators in mathematics reform. In Edward. D. Laughbaum. Hand-Held Technology in Mathematics and Science Education: A Collection of Papers. Columbus, OH: The Ohio State University.
Wilson, W. S. & Naiman, D. Q. (2004). K-12 Calculator usage and college grades.Educational Studies in Mathematics, 56, 119-122.
Corresponding Author:
Dr. Nor’ain Mohd. Tajudin
Department of Mathematics, Faculty of Science & Mathematics, Universiti Pendidikan Sultan Idris
Email: [email protected]