1
THE INFLUENCE OF PROFITABILITY, SOLVABILITY,
ASSET GROWTH, AND SALES GROWTH TOWARD FIRM VALUE
(Empirical Study on Mining Companies Which Listed on Indonesia Stock Exchange)Vidyanita Hestinoviana Suhadak
Siti Ragil Handayani
Faculty of Administrative Science Brawijaya University
Abstract
This research was conducted to determine what factors may affect the firm value in the mining companies, because the company has a main objective to increase the firm value. Factors examined are internal factor. This research uses Profitability, Solvability, Asset Growth, and Sales Growth as independent variable and firm value as dependent variable. The results show that: Profitability, Solvability, Asset Growth, and Sales Growth simultaneously effect the firm value. Individually, Profitability and Sales Growth have no significant effect to Firm Value with regression coefficient (B) for Profitability is 0.19 and Sales Growth is 0.003, while Solvability and Asset Growth have significant effect to the Firm Value with B of Solvability is 0.463 and Asset Growth is -0.022.
Keywords: Firm Value, Profitability, Solvability, Asset Growth, and Sales Growth
1. INTRODUCTION
Nowadays, the development of the business makes the many companies are emerging, it leads to intense competition. Therefore, to maintain business operations and compete with other companies, many things are needed such as strategy, new ideas, customer trust, even a large capital. One way that can be taken by the company to meet the needs of funds to increase the firm value of the company to remain competitive is through the shares issue to the public capital markets.
Capital market is a market in which individuals and institutions trade financial securities. Organizations/institutions in the public and private sectors also often sell securities on the capital markets in order to raise funds. Thus, this type of market is composed of both the primary and secondary markets. Capital markets can be used by investors as a tool to invest excess funds owned by the investor to acquire a large return. Investors here as people who have excess funds while companies as requiring funds to develop the work done.
The company was established to achieve certain objectives. The first objective the establishment of the company is to maximize profit obtained by the company. The second objective is to maximize prosperity of owners or shareholders. Third objective is to maximize its firm value. The three objectives of the company
actually are not substantially different, but there are some difficulties faced by each company to reach the objectives. (Susanti, 2010)
Firm value can be seen from the value of shareholder which indicated by the return on investment to shareholders. Shareholder value will increase if the firm value increases too. Firm value is an important concept for investors, because it is an indicator for the market to assess the company as a whole. Each owner will shows to potential investors that their company are right to be a firm as an investment destination. With the good firm value, it will affect the investor's decision to invest in the company.
Furthermore, for increasing the firm value, companies sometimes faces some failures. The possibility can occur when shareholders decide to entrust the management to others. Shareholders gave the responsibility to the management to run the company well in order to increase firm value which followed by the increasing of shareholder value. According to agency theory, the relationship between owners and managers is essentially difficult to create, because of the conflicting interests. It can lead to a failure to increase the firm value.
Firm value is the price that buyers are willing to pay if the company is sold. Firm value is a reflection of the addition of company’s equity
with company’s debt (Kusumadilaga, 2010).
namely internal factors and external factors. Internal factors in the form of tax payments, firm size, growth, uniqueness, financial risk, profitability, dividend payments, and non-debt tax shield. External factors such as inflation, interest rate, foreign exchange rate fluctuations and capital market conditions (Analisa, 2011).
Of the several factors that affect the firm value, profitability is one of the factors that are considered to affect the firm value. Profitability measures the company's ability to generate earnings. Profitability ratio in this research is represented by return on equity (ROE). ROE is a ratio that shows the rate of return earned by the
Profitability ratios measure the success of management practices, as indicated by the profit generated by the sales and investment. The high profitability indicates that the prospect of the company is good. It will certainly attract investors to invest in the company. To maintain the continuity of a company, a company must be in profitable condition. Without the profit would be very difficult for companies to be able to attract capital from outside (Syamsuddin, 2009:59). Therefore, the profitability may affect the firm value.
In practice to cover the shortage of funds, the company has several funding options that can be used. Sources of funding can be obtained from its own capital and loans (bank or other financial institution). Companies can choose from one of the sources of funds or a combination of both. Solvability ratio (leverage) is the ratio which used to measure the extent of the asset financed by debt companies. This means that how much of the debt burden covered by the companies compared to its asset. In a broad sense it is said that this ratio used to measure the company's ability to pay its The higher the solvability ratio, the higher the risk of loss is encountered, otherwise if the company has a low solvability ratio would have a smaller risk of loss (Syamsuddin, 2009:53). Therefore, if a company has a high risk of loss will affect the firm value.
The growth of the company is a factor that can affect the firm value. In general, fast-growing company that will get positive results as a significant increase in sales and market share expansion. In addition, rapid growth can also enhance the positive image of the company, but the company must be careful for the success obtained caused the company being vulnerable to the negative issues. Rapid growth will force companies to think of a strategy to maintain and develop what have been obtained by the company.
Company growth is expected by the to invest in the company (Kusumajaya, 2011). In this research, the growth indicated by asset growth and sales growth. Company growth indicates the progress of a company, so it will be good prospects for the company. With good prospects in the future will increase the firm value and attract more investors.
Similar research has been conducted on firm value by Analisa (2011), in this research used the company size, leverage, profitability, and dividend policy as independent variable. And the result shows that profitability has significant positive effect, while leverage has a positive effect not significant. Difference in this research with previous research is the addition of asset growth and sales growth into an independent variable in addition to profitability and solvability.
The objectives in this research are to know that profitability significantly affects the firm value; to know that solvability significantly affects the firm value; to know that asset growth significantly affects the firm value; to know that sales growth significantly affects the firm value.
2. LITERATURE REVIEW
2.1. Profitability
Profitability is ability of the company to get profit and an overview of company performance in manages the company. Get satisfactory profit is become fundamental goal of company. Profitability is one of the important indicators to assess a company. Profitability is also used to measure a company's ability to generate earnings as well as to determine the effectiveness of the company in managing its resources. Wahlen et al
(2010:246) mentioned that “Examining the
firm's future profitability and the expected return
from investing in the firm's equity securities”.
Profitability ratios measure the success of management practices, as shown by the profit generated by the sale and investment. Growth in profitability is characterized by changes in the profit margin on sales. With a high level of profitability means that the company will operate at a low cost that will ultimately result in higher profits. Profitability ratios are a group of ratios that show the combined effects of liquidity, asset management, and debt on operating results. Brigham and Houston (2009) mentioned that there are 5 profitability ratios, namely operating margin, profit margin, return on asset, return on equity, and basic earning power.
This research use Return on Equity (ROE) to calculate the profitability of the company. ROE as a profitability ratio is a very important indicator for investors. ROE required by investors to measure a company's ability to obtain net income related to the dividend. High profitability will be better for investors, because it shows a good investment prospects. For companies with low ROE, investors will assess the company as a high risk investment (Leach, 2010).
2.2. Solvability
Solvability is meant as a firm's ability to pay its debts (both short and long term) when the company liquidated. Solvability ratio is the ratio used to measure a company's ability to find source of funds to finance their activities (Kuswandi, 2006:182). Solvability ratio (leverage) is the ratio which used to measure the extent to which corporate asset financed from debt, meaning how much debt expense borne by the company compared to its asset.
The higher the solvability ratio, the higher the risk of loss faced, but also a chance to get big profit. Conversely, if the company has low solvability ratios, certainly have a lower risk of loss. With a solvability ratio analysis, the company will know some things relating to the use of equity and loan capital and to know the ratio of a company's ability to meet its obligations. Samsul (2008:146) describes three types of ratios to calculate solvability, namely Debt to Asset Ratio (DAR), Debt to Equity Ratio (DER), and Long Term Debt to Equity Ratio (LTDER).
According to Brigham and Houston
(2009:93), “Debt to Asset Ratio (Debt Ratio) is a ratio used to measure the ratio of total debt with
total asset”. In other words, how much of
company asset financed by debt or how much of
corporate debt that impact on asset management. The higher this ratio the more funding with debt, it is increasingly difficult for companies to obtain additional loans because it was feared the company was not able to cover its debts with its asset. Conversely the lower this ratio, the smaller companies financed from debt.
LTDER is the ratio of long-term debt with its own capital. The goal is to measure what proportion of total equity used as collateral long-term debt. How to calculate it is to compare the long-term debt equity provided by the company. The greater this ratio indicates greater risk borne by the company, so it will affect the value of the company itself. Therefore, the smaller the level of solvability ratio, it will lead the increasing of the firm value.
2.3. Company Growth
Growth in this research is proxied with asset growth and sales growth. Growth is the change in total asset or sales either increase or decrease experienced by companies within one year. Growth ratio is a ratio that aims to measure the ability of companies to maintain its position in the growth of the economy and in the industry. Growth ratios should be calculated according to Tambunan (2008:155) is Net Income Growth Ratio, Total asset Growth Ratio, Net Sales Growth Ratio, and Total Equity Growth Ratio. How to calculate the growth rate is the value in the second year minus the value in first year and then divided by the value in the first year.
This research uses the asset and sales growth. Asset growth is the changes (increase or decrease) of total asset which owned by company. Asset growth measured as percentage of the changes of total asset in a given year to the previous year. Based on that definition, can be explained that aseet growth is the changes of total asset either increase or decrease which faced by company in a given time. Sales growth also has same explanation, namely the changes of total sales, either increase or decrease, from the year before which faced by company. (Kusumajaya, 2011)
2.4. Firm Value
The goal of any company is to maximize the value of the company, since the goal is
welfare of the shareholders which presented the company's stock price (Harris and Mongielo, 2012). Thus, the higher the value of company's stock, the higher the level of welfare of shareholders.
Hunt (2009:62) stated that “Enterprise value is value of the company’s total market
capitalization, i.e., its equity plus its net debt. It is sometimes known as market value, firm value, or
aggregate value”. Firm Value is an economic
measure which reflects the market value of whole business, or can be said that firm value is the price that must be paid by the candidate buyer when the company was sold. When someone buy a company, he not only get all the income and inventory and everything else, he also get the cash held by the company. So, in effect, he pays to buy the company and then get some of that back immediately. For a debt-free company, that's great. But many companies also have debt. That means he is taking on the obligation to pay that debt as well.
This research uses Tobin’s Q to measure
the firm value. Tobin's Q is the replacement cost of the cost required to get the same asset with the asset of the company. This ratio is named according to the initiators James Tobin in 1969. When Tobin's Q is lower than 1, then the company would be an interesting acquisition target, either to be combined with other companies or for liquidation. Logically buyer of company will obtain the asset at a cheaper price than if the asset is sold back. Conversely, if a high value of Tobin's Q is an indication that the company has high
growth potential that the firm’s value is more than
the value of its asset (Widjaja and Maghviroh, 2011:120-121).
3. Hypothesis
3.1. The effect of Profitability toward Firm Value
Profitability is the net profit rates that can be achieved by the company during run its operations. To maintain the continuity of a company, a company must be in profitable condition. Without the profit would be very difficult for companies to be able to attract capital from outside (Syamsuddin, 2009:59). High profit will give indication that company's prospect is good and it will affect the firm value of a company.
H1 : Profitability significantly affects the firm value
3.2. The effect of Solvability toward Firm Value
Solvability ratio (leverage) is the ratio which used to measure the extent of the asset financed by debt companies. The higher the solvability ratio, the higher the risk of loss is encountered, otherwise if the company has a low solvability ratio would have a smaller risk of loss. Therefore, if a company has a high risk of loss will affect the firm value (Syamsuddin, 2009:53).
H2 : Solvability significantly affects the firm value
3.3. The effect of Asset Growth and Sales Growth toward Firm Value
In this research, the growth indicated by asset growth and sales growth. Asset growth can mean two things, namely the growth of current asset and fixed asset. Growth in current asset indicates that increased the company's operations and fixed asset growth indicates that increasing in
the company’s investment. Sales growth showed
an increase in the number or the sales price. Asset growth and sales will affect the company's ability to generate earnings and it will lead the increasing of firm value. Company growth indicates the progress of a company, so it will be good prospects for the company. So, the asset growth and sales growth affect the firm value.
H3 : Asset Growth significantly affects the firm value
H4 : Sales Growth significantly affects the firm value
4. Research Framework
5. RESEARCH METHODS
5.1. Type of Research
In this research, some tests done to test the hypotheses that have been made. Tests were conducted to determine whether there was a relationship between variable and other variable, as already hypothesized. Therefore this research is explanatory research. Explanatory research is research that is explanation and aims to test a theory or hypothesis to strengthen or even reject
Profitability (X1) Solvability (X2) Asset Growth (X3) Sales Growth (X4)
the theory or hypothesis of the research that already exists.
5.2. Research Variables and Measurements 5.2.1. Dependent Variable
Dependent variable is a variable which is affected by independent variable. This research use Firm Value as dependent variable.
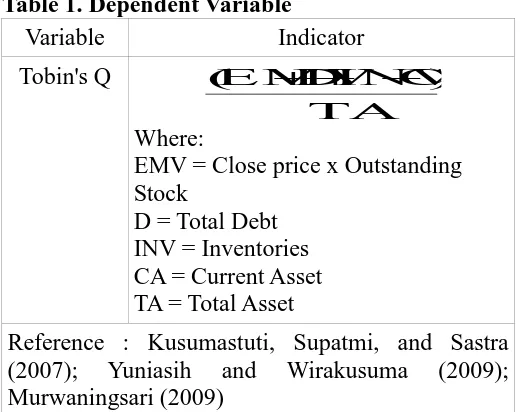
Table 1. Dependent Variable
EMV = Close price x Outstanding Stock
D = Total Debt INV = Inventories CA = Current Asset TA = Total Asset
Reference : Kusumastuti, Supatmi, and Sastra (2007); Yuniasih and Wirakusuma (2009); research use Profitability, Solvability, asset Growth, and Sales Growth as independent
5.3. Population and Sample of Research 5.3.1. Population of Research
The population of this research is mining companies which listed in Indonesia Stock Exchange Market in 2009-2011 which amounts to 31 companies.
5.3.2. Sample of Research
The sampling technique used was purposive sampling with criteria:
1.Companies provide complete financial report in 2009-2011.
2. Companies have complete data which related with research variables.
3. Companies with positive ROE ratio. Based on these criteria, 15 companies obtained from total 31 companies which listed on Indonesia Stock Exchange period 2009-2011. 6. Method of Data Analysis
6.1. Descriptive Statistic
Descriptive statistic is used to determine the level of profitability, solvability, asset growth, sales growth, and firm value in mining companies which listed in IDX. Measurement which used in this research is minimum value, maximum value, mean, and standard deviation.
6.2. Classical Assumption Test
This classical assumption test used to know and test the worthiness of regression model which is used in this research. This test is used to make sure that there are no multicollinearity and heteroscedasticity in regression model and make sure that the data distribute normally.
1. Normality Test simple regression. Multiple regression analysis is a regression analysis using a linear function of two or more independent variables to explain the dependent variable. Multiple linear regression equation in this research is
e
β1 –β4 = Regression Coefficient
X4 = Sales Growth e = Error Term 7. Hypothesis Testing
7.1. Coefficient of Determination
Coefficient of determination or R2 is percentage of variability in the dependent variable that is explained by an independent variable. Coefficient of determination always has a value between 0 and 1. Small value of R2 means that the ability of the independent variable in explaining the dependent variable is limited. However, if the R2 value close to 1 means that the independent variable provides almost all the information needed to predict the dependent variable (Hansen and Mowen, 2006:93).
7.2. Simultaneous Significance Test (F-test) F test can be done by looking at the significance value of F at the output the regression results using SPSS with significance level = 0.05
(α = 5%). If the significance value is greater than α, then the hypothesis is rejected. However, if the
significance value is less than α, then the
hypothesis is accepted.
7.3. Individual Parameter Significance Test (t-test)
T-test can also be done by looking at the significance of the t-value of each variable in the regression results output using SPSS with
significance level = 0.05 (α = 5%). If the significance value is greater than α, then the
hypothesis is rejected (regression coefficient is not significant). However, if the significance value is
less than α, then the hypothesis is accepted (significant regression coefficient).
8. ANALYSIS AND DISCUSSION
8.1. Data Analysis
8.1.1. Descriptive Statistic Analysis
Based on descriptive statistic analysis which is shown in Table 3, shows the characteristics of the samples used in this study include: the number of samples (N), mean, minimum value, maximum value and standard deviation of each variable.
Table 3. Descriptive Statistics
Source: SPSS Output, 2013
In Table 3 above is shown that the numbers of samples used in this study are 45 research samples consist of 15 mining companies listed on the Indonesia Stock Exchange in the year 2009-2011. The average or mean of Tobin's Q is equal to 1.434714. Minimum and maximum values of Tobin's Q are 0.211 and 5.1363. The standard deviation of Tobin's Q is equal to 1.1261125; this number is smaller than the mean of Tobin's Q. It is indicated that during 2009 until 2011 the movement of firm value variable (Tobin's Q) does not fluctuate.
The average or mean of ROE is equal to 21.568793. Minimum value of ROE is 0.4196 and the maximum value is 51.0087. The standard deviation of ROE is equal to 12.9807434, this number is smaller than the mean of ROE. This indicates that during the years 2009-2011 the movement og variable profitability (ROE) does not fluctuate.
The average or mean of Long term Debt to Equity Ratio (LTDER) is equal to 0.673514. LTDER minimum value is 0.0434 and the maximum value is 4.3825. The standard deviation is equal to 0.9019354 of LTDER, that number is greater than the mean LTDER. This indicates that during the years 2009-2011 movement variable solvability (LTDER) is volatile.
The average or mean of Asset Growth amounted to 15.105473. The minimum and the maximum value of Asset Growth are -16.0638 and 91.2236. The standard deviation of Asset Growth is equal to 22.2186731, that number is greater than the mean of Asset Growth. This indicates that during the years 2009-2011 Asset Growth's movement is volatile.
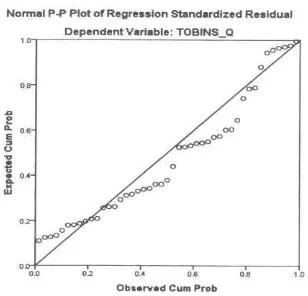
8.1.2. Classical Assumption Test 8.1.2.1. Normality Test
Table 4. Normality Test Using Histogram Graph
Source: SPSS Output, 2013
Table 5. One Sample Kolmogorov-Smirnov Test
Source: SPSS Output, 2013
Normality test results using graph analysis shows that the graph provides the distribution pattern of normal or near-normal, because the graph shows the points spread around the diagonal line. In addition the value of the Kolmogorov-Smirnov also showed significance amounted 0.294 which is more than 0.05. So, the regression model already has a normal distribution.
8.1.2.2. Heteroscedasity Test
In this research, there is no heteroscedasity in the regression model that can be seen in figure 1 below which shows the pattern spread and do not form a particular pattern. So, the regression can be used to predict the firm value.
Figure 1. Scatterplot Source: SPSS Output, 2013 8.1.2.3. Multicollinearity Test Table 6. Collinearity Statistics
Source: SPSS Output, 2013
From Table 6 above shows that all independent variables had tolerance values above 0.1 and VIF values below 10. Thus, it can be said that there is no multicollinearity created.
8.1.2.4. Autocorrelation Test Table 7. Runs Test
Source: SPSS Output, 2013
Table 7 shows that form the test results, the value of asymptotic significant is 0.548 (> 0.05), which means random residual value. So it can be concluded that there is no autocorrelation among residual value.
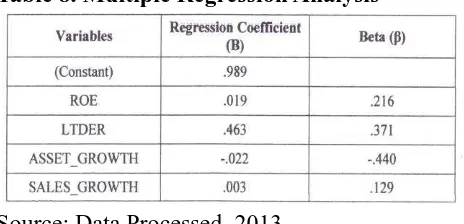
8.1.2.5. Multiple Regression Analysis
Table 8. Multiple Regression Analysis
Source: Data Processed, 2013
Based on SPSS output coefficient which summarized in Table 8, it is obtained equation model as follows:
Y = 0.989 + 0.019X1 + 0.463X2 – 0.22X3
+ 0.003X4
Where,
X1 = Profitability (ROE) X2 = Solvability (LTDER) X3 = Asset Growth
X4 = Sales Growth
From the regression equation can be explained that:
1. From SPSS output results obtained the constant value of 0.989. This indicates that if the value of ROE, LTDER, assets growth, and sales growth are 0, then the firm value's value is 0.989.
2. From SPSS output results show the value of regression coefficient for variable Return on Equity (ROE) amounted to 0.019. This means that if the ROE increased by 1 point, then the firm value will increase by 0.019.
3. From SPSS output results show the value of regression coefficient for variable Long-term Debt to Equity Ratio (LTDER) amounted to 0.463. This means that if the LTDER increased by 1 point, then the firm value will increase by 0.463.
4. SPSS output results show the value of regression coefficient for variable Asset Growth amounted to -0.022. This means that if the Asset Growth increased by 1 point, then the firm value will decrease by 0.022.
5. From SPSS output results show the value of regression coefficient for variable Sales Growth amounted to 0.003. This means that if the Sales Growth increased by 1 point, then the firm value will increase by 0.003.
8.2. Hypotesis Testing
8.2.1. Coefficient of Determination
Table 9. Result of Coefficient of Determination
Source: SPSS Output, 2013
From Table 9 above, it can be seen that the value of R square is equal to 0.337. This shows the ROE, LTDER, Asset Growth, and Sales Growth influence on firm value by 33.7%, while 66,3% is influenced by other variable which are not examined. Because the coefficient of determination is less than 50% or close to 0, it can be concluded that the ability of the independent variables in explaining the dependent variable is limited.
8.2.2. Simultaneous Significance Test (F-test) Table 10. Result of F-test
Source: SPSS Output, 2013
Based on ANOVA SPSS output which is shown in Table 10 above, obtained F-count is equal to 5.081 and the significance value is equal to 0.002, with the F-table in 2.61. Because the F-count (5,081) > F-table (2.61) and
significance value (0.002) < α (0.05), it can be
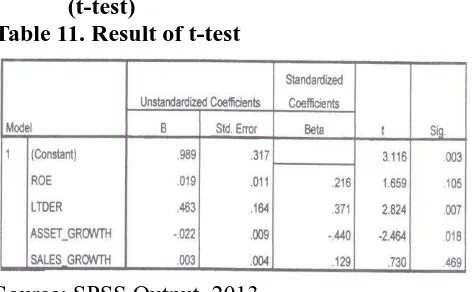
8.2.3. Individual Parameter Significance Test (t-test)
Table 11. Result of t-test
Source: SPSS Output, 2013
SPSS output coefficient of the results shown in table 4.13, it can be concluded the results of testing the effect of partially independent variable consisting of ROE, LTDER, Asset Growth, and Sales Growth to value the company at mining company listed on the Stock Exchange in 2009-2011 are as the following:
1. The Effect of Profitability (X1) Toward Firm Value (Y)
The results of SPSS output shows that the sig for ROE is equal to 0.105. With α =
0.05 then the sig > α. So that H1: Profitability Significantly Affects The Firm Value is rejected.
2. The Effect of Solvability (X2) Toward Firm Value (Y)
The result of SPSS output shows that the
sig for LTDER is 0.007 with α = 0.05 the
sig < α. Besides, t-count of LTDER amounted to 2,824 with t-table at 2.01954, so that the t-count > t-table. Then H2: Solvability Significantly Affects The Firm Value is accepted.
3. The Effect of Asset Growth (X3) Toward Firm Value (Y)
The result of SPSS output shows that the
sig for Asset Growth is 0.018 with α = 0.05 then sig < α. Besides, t-count of Asset Growth amounted to 2,464 with t-table at 2.01954, so the t-count > t-table. Then H3: Asset Growth Significantly Affects The Firm Value is accepted.
4. The Effect of Sales Growth (X4) Toward Firm Value (Y)
The result of SPSS output shows that the sig for Sales Growth is equal to 0.469.
With α = 0.05 then the sig > α. So that H4: Sales Growth Significantly Affects the firm value is rejected.
8.3. Discussion
8.3.1. The Simultaneous Effect of Independent Variable Toward Dependent Variable In this research, there is significant influence between independent variables consisting of profitability, solvability, asset growth, and sales growth toward firm value. The variables of profitability, solvability, asset growth, and sales growth simultaneously only amounted to 33.7% in giving effect to the change of firm value which is shown by the coefficient of determination (R square) of 0.337. This suggests that 66.7% the changes of firm value in mining industries is influenced by other factors which are not included in this research. Those other factors such as inflation, interest rate and foreign exchange rate which are external factor. These factors can be taken into consideration of investors in analyzing the firm value to be addressed to invest, other than the financial statements which reported by companies on Indonesia Stock Exchange (IDX).
8.3.2. The Effect of Independent Variable
Toward Dependent Variable
Individually
Table 12. The Average of Variables
Source: Data Processed, 2013
Figure 2. Chart of The Average of Variables Source: Data Processed, 2013
Variables 2009 2010 2011
Tobin's Q 1,836 1,779 0,689
ROE 0,202 0,204 0,241
LTDER 0,780 0,643 0,598
Asset Growth 0,048 0,150 0,255
Sales Growth -0,015 0,330 0,303
1 2 3 -0,500
0,000 0,500 1,000 1,500 2,000
Tobin's Q ROE LTDER Asset Growth Sales Growth
Year
A
v
e
ra
g
1. The Effect of Profitability (X1) Toward Firm Value (Y)
This result rejects first hypothesis (H1) which state that profitability significantly affects the firm value. It also answers the first problem formulation. Empirical evidence suggests that ROE in the year 2009-2011 has increased, but not significantly or very small, while the firm value has decreased significantly. It can be seen in Figure 2 where the firm value (Tobin's Q), which is indicated by the blue line, has decline sharply, while ROE which is shown with orange lines has increased very little even in figure 4.3 is shown almost like a straight line. Therefore, ROE does not have a significant effect on the changes of firm value.
2. The Effect of Solvability (X2) Toward Firm Value (Y)
The result accepts second hypothesis (H2) which states that solvability significantly affects the firm value and also answers the second problem formulation. Based on the theory proposed by Modigliani and Miller or often called the MM theory in 1963, states that the use of debt can increase the firm value because debt interest costs are costs that reduce income tax payments. Theoretically, an increase in debt will be able to increase the firm value, but the empirical evidence proves that every year LTDER of mining companies in 2009-2011 has decreased so that the firm value has decreased too. This is shown in Figure 2 where Tobin's Q and LTDER equally decreasing in 2009 until 2011. Therefore, LTDER have a significant effect on firm value. 3. The Effect of Asset Growth (X3) Toward Firm
Value (Y)
The result accepts third hypothesis (H3) which states that asset growth significantly affects the firm value, and also answers the third problem formulation. Empirical evidence suggests that the increase in assets of mining companies each year 2009-2011 was not followed by a significant increase in ROE, so the firm value does not increase but actually decreased. This is indicated by Figure 2 which asset growth has increased significantly, but the ROE did not increase significantly. This suggests that firms are less able to take advantage of the company's assets to gain maximum profit. Therefore, the increase in the value of assets of the company making the
firm value actually decreased. It can be concluded that the asset growth affect negatively on firm value.
4. The Effect of Sales Growth (X4) Toward Firm Value (Y)
The result refuses fourth hypothesis (H4) which states that sales growth significantly affects the firm value, and also answers the fourth problem formulation. Empirical evidence suggests that sales growth decline in 2011, followed by a decline in the firm value. In 2010, sales have risen sharply, but the firm value has decreased. It is supported with no significant increase in ROE in 2010 when the sales have increased sharply. Fluctuating sales growth in 2009-2011 led to sales growth does not have a significant effect on the change in firm value. This is shown by Figure 2 where Tobin's Q decreased from year 2009 to 2011, while sales growth increased in 2010 then decreased in 2011.
Based on this research above, the results showed differ with the existing theory. Seeing from the empirical evidence, mining companies use MM theory that mentioned if the debt ratio becomes higher, would be followed by the firm value. The firm value also becomes higher. It's because mining companies have a specific pattern. Mining companies use more debt to run its operations, such as renting mining area from the government and rent heavy equipment they needs. Moreover, for many mining companies' transactions cannot issue the proper source of documents, such as for the permission expenses that must be paid by company. Therefore, the research on mining companies differs from existing theories.
9. CONCLUSION AND SUGGESTION
9.1. Conclusion
Based on the analysis and discussion of the influence of profitability, solvability, asset growth, and sales growth toward firm value at mining companies on 2009-2011, it can be concluded the following results:
1. Independent variables used are profitability (ROE), solvability (LTDER), asset growth, and sales growth simultaneously influence the firm value (Tobin's Q) on mining companies listed on Indonesia Stock Exchange (IDX) in 2009-2011.
in this research uses ROE (Return on Equity) to determine the level of profitability, has no effect on the changes of firm value. Therefore, profitability is not one factor which can be used to perform an analysis of the changes on firm value of mining companies.
3. The result shows that solvability, which in this research uses LTDER (Long-term Debt to Equity Ratio) to calculate the level of solvability, has an influence on the change in firm value. It can be concluded that solvability became on factor which can be used to analyze the changes of firm value in mining companies.
4. Asset growth in this research to be one factor which can be used to analyze the changes of firm value in the mining companies because in this research indicated that the asset growth has a significant effect on the form value.
5. Sales growth variable shown in this research has no effect on firm value. Therefore, the sales growth cannot be used as one factor in analyzing the changes of firm value in mining companies.
6. The result is differ from the existing theories, because mining companies has special pattern such as use more debt to run its operations.
9.2. Suggestion
From this research, the suggestion for investors and next research can be concluded as follows:
1. For investors, not all financial ratios which reported by companies in Indonesia Stock Exchange (IDX) can be used as a parameter for predicting the changes of firm value. Therefore, investors should also consider about other factors in predicting the firm value.
2. For management, they should be give more attention in company's profitability and sales growth, because in this research the profitability and sales growth has no significant effect to firm value. The management should increase the company performance.
3. For the next research, because of R Square in this research is 33.7% or still below 50%, which means 66.3% firm value is influenced by other factors besides the variables used in this research. Therefore, next research should include external
factors, such as inflation, interest rate, and foreign exchange rate as an independent variable in the research.
REFERENCES
Brigham, E. and Houston, E. 2009. Fundamentals of Financial Management. 12th Edition. USA: Cengage Learning, Inc.
Hansen, D.R. and Mowen, M.M. 2006. Managerial Accounting. 8th Edition. USA: Thomson South-Western.
Hunt, P. 2009. Structuring Mergers and Acquisitions: A Guide to Creating Shareholder Value. 4th Edition. USA: Aspen Publisher.
Kusumastuti, S., Supatmi, and Sastra, P. 2007. Pengaruh Board Diversity Terhadap Nilai Perusahaan dalam Perspektif Corporate Governance. Jurnal Akuntansi dan Keuangan, 9(2): 88-98
Leach, R. 2010. Ratios Made Simple. Great Britain: Harriman House Ltd.
Samsul, M. 2006. Pasar Modal and Manajemen Portofolio. Jakarta: Erlangga.