FOOD CONSUMPTION AND NUTRITIONAL STATUS OF CHILDREN PARTICIPATING AT POSYANDU PROGRAM IN CIANJUR REGENCY
(Konsumsi Pangan dan St at us Gi zi Anak Peser t a Posyandu di Kabupat en Ci anj ur)
Hadi Riyadi1 and Faisal Anwar1
ABST RAK
The economic crisis striking in Indonesia in 1997 is considered to have a big impact on the decreased quality of public health par-ticularly for the poor people. From the results of evaluation on Posyandu (Health and Nutri-tion Integrated Service Center) carried out in November and December 1998, it has been found that the economic crisis has led to an increased number of undernourished children under five year old. The results of National Census show that the prevalence of under-nourishment for under five year old children in 1989 was 37.5% (7 986 279 children under five year old) and in 2003 27.3% (5 117 409 chil-dren). The absolute value of undernourist indi-cated that so far the nutritional programs have not yet been adequately effective and effi-cient in reducing nutritional problems.
The nutritional status of a community is influenced by a lot of interrelated and com-plex factors. At the level of households, the nutritional status is affected by the household ability to provide adequate food in both quan-tity and quality, mother’s pattern of upbring-ing children, knowledge of nutrition, and other socio-cultural factors. This indicates a close relation between food security along with its
1 Lecturer on Department of Community Nutrition, Faculty of Human Ecology, Bogor Agricultural University (IPB).
nutritional status and public health (Azwar, 2004).
An improved status of community nutri-tion has a quite significant effect on the im-provement of human resource quality. A nutri-tional status is a determinant factor of living quality and work performance. A high infant mortality rate, children under five years old and pregnant women, and a decreased work performance as well as retarded mental de-velopment and intelligence are as a result di-rectly or indidi-rectly of malnutrition.
Riyadi (1995) defines nutritional status as a body health condition of a person or a group of people resulting from the consump-tion, absorpconsump-tion, and utilization of nutrients in food. The physical size of a person is closely related to the nutritional status; for this rea-son anthropometry is accepted as a good indi-cator and reliable to determine a nutritional status.
Goals and Obj ectives
The objectives of this research were : 1. To identify food consumption of children
under five years old.
METHODS
Design
This research used a cross-sectional de-sign with samples of households who have children under five. The study was conducted in the District of Cianjur, the Province of West Java and two subdistricts were selected. The research has been conducted in 2006-2007. This article is part of study of Nutrition Pro-gram Implementation: Its Utilization by Households, Coverage, Effectiveness, and Im-pact on Nutritional Status in Poor Areas.
Sampling
The populations in this research are children under five years old. The populations were selected in two subdistricts (Karang Ten-gah and Ciranjang) of Cianjur District, West Java. Sampling was done using stratified ran-dom sampling with proportional allocation where high and low frequency visit stand as stratum. Sample size was also proportional with respect to Posyandu size. Sample sizes of children under five years old are 186 in Karang Tengah, while 114 in Ciranjang. Total sample sizes are 300 under-five-years children.
Cianjur District was selected since there were variations in nutrition program imple-mented and variations in achieving the pro-gram objectives (Personal Communication with Staff of Health Services, Cianjur, February 10, 2006). The two subdistricts were chosen to increase heterogeneity of samples, so that the performance of nutrition program was truly represented by the selected samples.
Data collection
The data collected consists of :
1. Data on food consumption and food fre-quency.
2. Nutritional status data (age, sex, weight and height).
The data were collected through ques-tionnaires. The data on food consumption was collected with the food frequency and 1 x 24 hour food recall. Data of nutritional status was obtained by measuring height and weighing the weight of Children.
Data Analysis and Management
Data processing involves editing questionnaires, coding, and arrangement of file structure, data entry, editing files, raising variables, combining and separating files. Data
processing and analysis used Excel and Statis-tical Analysis System.
The estimations of means and standard deviation made for all quantitative variables. The estimation results were presented in the forms of tables and diagrams.
RESULTS
Consumption and Nutrition Adequacy of Children
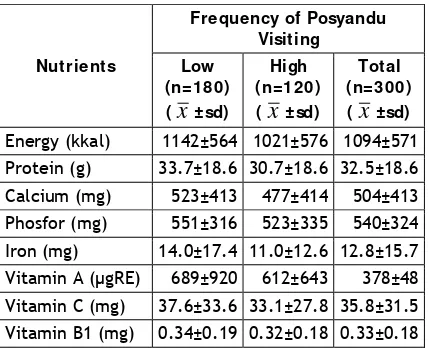
Energy Consumption. Food has been the primary need for human to live healthily (Harper, Deaton & Driskel, 1986). The more varied the food stuffs consumed, the more varied the nutrients would be obtained, re-sulting in the improvement of nutritional quality. Consumption and energy/nutrients adequacy are presented at Table 1 and Table 2. The average energy consumption is 1094 kcal/day as seen at Table 1.
Table 1. Statistics of Nutrients Consumption of Children under Five Years Old Energy (kkal) 1142±564 1021±576 1094±571 Protein (g) 33.7±18.6 30.7±18.6 32.5±18.6 Calcium (mg) 523±413 477±414 504±413 Phosfor (mg) 551±316 523±335 540±324 Iron (mg) 14.0±17.4 11.0±12.6 12.8±15.7 Vitamin A (μgRE) 689±920 612±643 378±48 Vitamin C (mg) 37.6±33.6 33.1±27.8 35.8±31.5 Vitamin B1 (mg) 0.34±0.19 0.32±0.18 0.33±0.18
On the average, this energy consumption only fulfills 80% of the nutrition adequacy rec-ommended by RDA. It can be seen from the two participation groups (Table 1) that the energy consumption of the children of low par-ticipation group (1142 kcal/day) is a little higher than that of high participation group (1021 kcal/day).
two-third of the recommended energy ade-quacy level (RDA) (Table 2).
Tabel 2. Statistics of Nutritional Adequacy of Children Under Five Years Old
Nutrients
Frequency of Posyandu Visiting Low Protein (%) 132.7±70.9 125.6±79.9 129.9±74.6 Calcium (%) 105.1±82.9 96.7±86.2 101.8±84.2 Phosfor (%) 198.2±109.0 192.7±122.1 196.0±114.2 Iron (%) 170.5±209.3 137.8±158.7 157.6±191.2 Vitamin A (%) 181.9±235.3 164.6±167.2 175.0±210.8 Vitamin C (%) 90.7±80.5 81.0±68.7 86.9±76.1 Vitamin B1 (%) 59.9±32.3 58.2±34.9 59.2±33.3
Protein Consumption. Table 1 shows that the average protein consumption among children is 32.5 g/day. As a whole, the protein consumption is much higher than the recom-mended protein adequacy level (129. 0%). On the other hand, if seen from each participa-tion group (Table 1), it can be said that the average protein consumption of low participa-tion group is 33.7 mg which has no significant difference from that of high participation group (30.7 mg). The protein adequacy level of the children is greater than the recom-mended level (Table 2). This protein usually derives from salty fish.
Calcium Consumption. The calcium con-sumption by children is generally high, with the average consumption of 504 mg per day. The average protein consumption in low par-ticipation group is 523 mg higher than that of the children in high participation group (477 mg) (Table 1). The consumption level indicates that their need has been satisfied (Table 2). The calcium source greatly consumed by them is from anchovies.
Phosphor Consumption. The average consumption of phosphor is 540 mg/day (Table 1) in which the level has doubled the recom-mended phosphor adequacy level (Table 2). The consumption of both groups is not signifi-cantly different.
Iron Consumption. The tables show that the average iron consumption is approximately 12.8 mg/day. Iron consumption for the low group is rather higher (14.0 mg/day) than that of the high group (11.0 mg/day). The ade-quacy level of iron has reached 150%. The iron
consumption level in the low group is 170% whereas that of high group reaches 138% (Table 2).
Vitamin A Consumption. The average consumption of vitamin A is 658 ugRE or reaches 175% of the recommended level. The consumption of vitamin A for the low group is 689 ugRE and has reached 182% of the recom-mended level whereas that of the high group reaches 165 ugRE and has reached 165% of the recommended level.
Vitamin C Consumption. The average consumption of vitamin C is 35.8 mg or only reaches 87% of the recommendation. There is no big difference in vitamin C consumption between low and high groups. This indicates that food quality is varied among the children, which may not be related to their participa-tion at posyandu.
Vitamin B1 Consumption. The average consumption of vitamin B1 is 0.33 mg or meets 59% of the recommended adequacy. The vitamin B1 consumption has no difference in both participation groups.
Food Frequency of Children
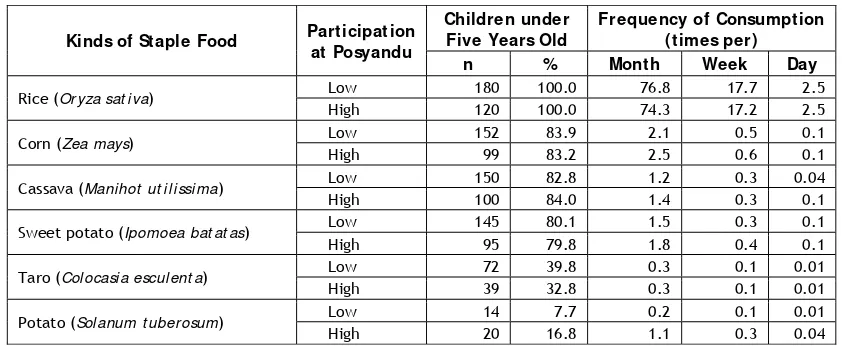
The Frequency of Staple Foods. Cereal food types (rice, corn, and wheat) contain high carbohydrates and sufficient protein content which will be utilized as energy sources (Wi-narno, 1995). The food frequency among chil-dren is presented to see their eating hab-its/patterns in the research area. From Table 3, the cereals consumed by the children in-clude rice, corn, cassava and sweet potato, and more than 80 % of them consume these foods.
No difference in the frequency of cereal food consumption between the two groups. These cereal foods are mostly purchased, and they are rarely planted or given by other peo-ple. Rice is commonly purchased – this is claimed by 90% of the respondents.
fish (pi ndang) are generally consumed once a week.
There is no difference in the frequency of animal protein consumption between the two groups. Most of these products are pur-chased. Only a little portion of the products are obtained from the animals raised by the respondents. There are 10% respondents stating that fresh water fish products are ob-tained from their own ponds or they are given by their neighbors.
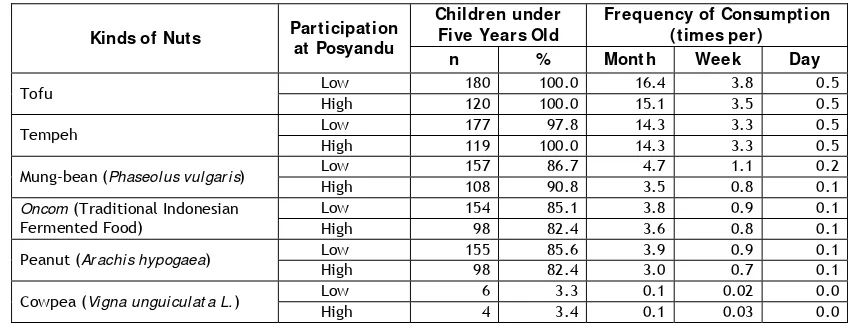
Frequency of Legumes Consumption. Soybeans are the sources of vegetable pro-teins. They are not commonly consumed eve-ryday by the children (Table 5). Tofu and fer-mented soybean (t empeh) are consumed by more than 98% of the children with the
fre-quency of 3 times per week. This might hap-pen because these products are easily ob-tained and cheap. The research conducted by the Research Development Center of Nutrition in Bogor proves that the consumption of t em-peh as one of the supplementary major food may increase body weight and improve the nutritional status of the children (Winarno, 1995). Other types of nuts are rarely con-sumed.
There is no difference in the frequency of soybean consumption between the two groups. Food of vegetable protein sources are almost 100.0 % bought by respondents. Only few respondents those stated they obtained it from others people or self-cultivated.
Table 3. Statistics of Staple Food Consumption Frequency of Children under Five Years Old
Kinds of Staple Food Participation at Posyandu
Table 4. Statistics of Animal Protein Consumption Frequency of Children under Five Years Old
Table 5. Statistics of Legumes Consumption Frequency of Children under Five Years Old
Kinds of Nuts Participation at Posyandu
Oncom (Traditional Indonesian Fermented Food)
Frequency of Leaf Vegetables. Vegeta-bles are sources of vitamin and minerals, those very useful for children under five. Generally, green vegetable is rich of important nutrients and its present on meals will improve the nutritional quality entirely.
Children under five rarely consumed leaf vegetables (Table 6). Frequency of leaf vege-tables consumption only 1 time per week for mostly respondents. Kinds of those consumed leaf vegetables once a week are spinach, sawi (Br assi ca r ugosa), carrot, long-bean (Caj anus caj an), and cabbage. There is no difference in the frequency of leaf vegetables consumption between the two groups.
Such vegetables as spinach, kangkung (Ipomoea r ept ans), carrot, sawi, cabbage, long-bean and mel i nj o leaves are commonly purchased by the respondents. Cassava and papaya leaves can be obtained by purchasing
them or taking them from the respondents’ garden or they obtained the leaves from their neighbors.
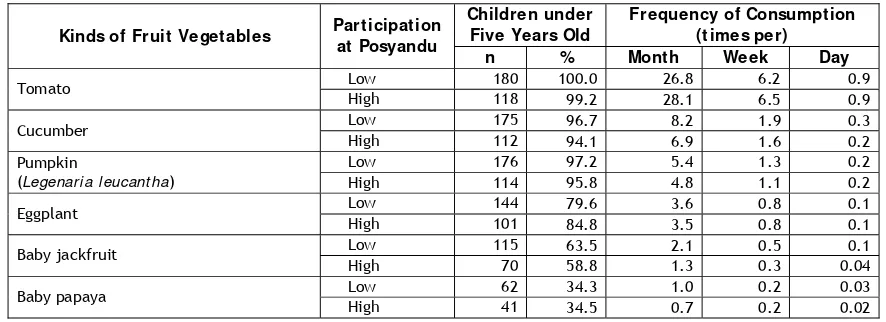
Frequency of Fruit Vegetable. Like leaf vegetables, fruit vegetables are also rarely consumed by the children (Table 7). From these types of vegetables, tomato are the most frequently consumed by the children i.e. 6 times per week or almost everyday. Fruit vegetables those consumed once a week are cucumber and pumpkin. There is no difference in the frequency of the consumption between the two groups.
Frequency of Fruit. Fruits are also vi-tamin and mineral sources. The largest sources of vitamin C derive from fruits especially the fresh ones. In general, these fruits are not consumed daily by the children (Table 8). Or-anges and banana are often consumed by the children i.e. 3 times a week since they are
Table 6. Statistics of Leaf Vegetables Consumption Frequency of Children under Five Years Old
Table 7. Statistics of Fruit Vegetables Consumption Frequency of Children under Five Years Old
Kinds of Fruit Vegetables Participation at Posyandu
Table 8. Statistics of Fruits Consumption Frequency of Children under Five Years Old
Kinds of Fruits Participation at Posyandu
easy to find and relatively cheap whereas pa-paya and mango are only consumed once a week. There is no difference in fruit consump-tion between the low and high participaconsump-tion groups.
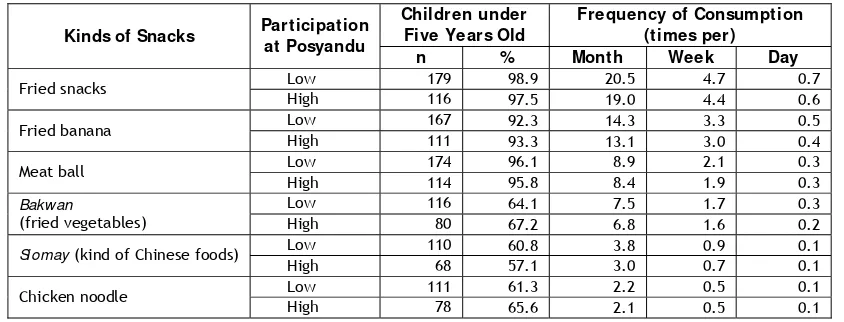
Frequency of Snacks. Snacks containing carbohydrates are not consumed every day by the children (Table 9). Research by Widiyawati (2004) states that snacks frequently consumed by the children include chiki potato chips, candies, chocolate, and nuts. There is no dif-ference in snacks consumption between the low and high participation groups. They are generally purchased from the small shops or traveling sellers.
Frequency of Miscellaneous Food. These miscellaneous foods such as sugar and monosodium glutamate (MSG) are almost consumed daily by the children (see Table 10).
This is because their mothers always put these foods into their meals to make them tastier. There is no difference in miscellaneous foods consumption between the low and high par-ticipation groups. Like the other foods, they are generally purchased by the children.
Nutritional Status of Children
Table 9. Statistics of Snacks Consumption Frequency of Children under Five Years Old
Kinds of Snacks Participation at Posyandu
Table 10. Statistics of Miscellaneous Food Consumption Frequency of Children under Five Years Old
Kinds of Miscellaneous Food Participation at Posyandu
On the whole, the average body weight of children is 11.32.7 kg, with the lowest body weight of 6.3 kg and the highest of 26.1 kg. The body weights in both participation groups are not much different, but the body weights of boys tend to be greater than those of girls in both participation groups.
The average body height of all children is 85.410.0 cm, with the lowest body height of 59.5 cm and the highest of 112.1 cm. The body heights of children are relatively not dif-ferent between the two participation groups. Boys have greater body heights than girls in both participation groups. In the low group, the body heights of boys are about 2 cm higher than the girls. In the high group, the body heights of boys are about 4 cm higher than the girls.
Weight f or Age of Children (W/ A)
The nutritional status discussed in this report is based on the resulted measurement of body weights and heights, so the analysis
uses the weight for age (W/A), height for age (H/A), and weight for height (W/H). The data processing uses WHO software, Antro 2005 and the new WHO anthropometric standard.
Based on the calculation of Z-score of W/A and the threshold point - 2SD for the underweight, the prevalence of underweight among children (less than five years old) is 30.0%. The underweight prevalence is much higher at the research location than that in Indonesia (23.1 %) obtained by SUSENAS 2005 (National Survey of Social Economic). The un-derweight prevalence among children in the low participation group (34.3%) is much higher than that among children in the high participa-tion group (23.5%).
as the result obtained by SUSENAS in Indone-sia.
The prevalence of overweight children is very low, i.e. 0.7 %. Overweight is more prevalent in the high participation group than in the low group. From Figure 1 it is clearly seen that the Z-score median of W/A for the children in the research site is much further to the left than the WHO standard of 2005. The median Z-score for the children in the re-search location is coming closer to the stan-dard deviation of -1.5 or underweight.
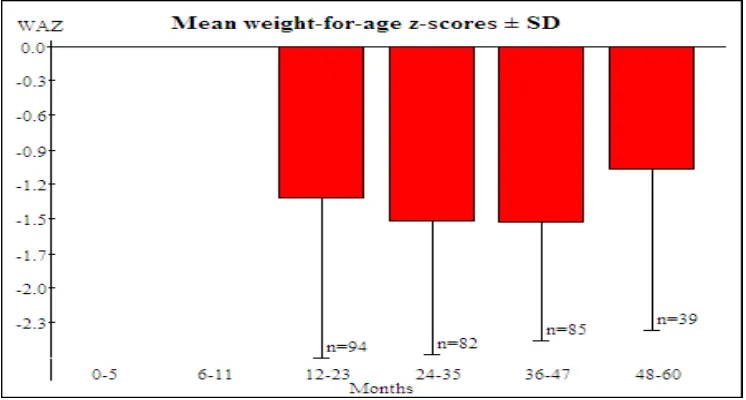
The Z-score (-1.52) for the children of the low participation group is worse that that (-1.13) of the high participation group. Like the underweight prevalence, the Z-scores be-tween different sexes do not have a consistent pattern. In the low participation group, the Z-score of W/A is higher for boys; whereas in the high participation group it is higher for girls. The gender-based analysis shows that the curve of Z-scores is not much different be-tween boys and girls (see Figure 2). From Fig-ure 5.3 it can be seen that in terms of age groups, the Z-score of W/A is the worst in its deviation for the age group of 24-47 months.
Figure 1. Distribution of Children based on the Z-score of W/A
Figure 3. Z-score of W/A Value of Children based on Age Group
Height f or Age of Children (H/ A)
A body height at a certain time is the resulted cumulative growth since birth, there-fore it can be used as a previous picture of nutritional status in the past. Body height is also the most sensitive index for detecting the socio-economic changes. The prevalence of stunted growth as a whole is 43.7%. This prevalence is closer to the prevalence in Indonesia 5-6 years ago.
The comparison of the prevalence of stunted growth between participation groups shows that the prevalence is greater for chil-dren in the low participation (46.4%) than in the high participation group (39.5%). The stunted prevalence between different genders does not take a consistent pattern. In the low participation group, the stunted prevalence is
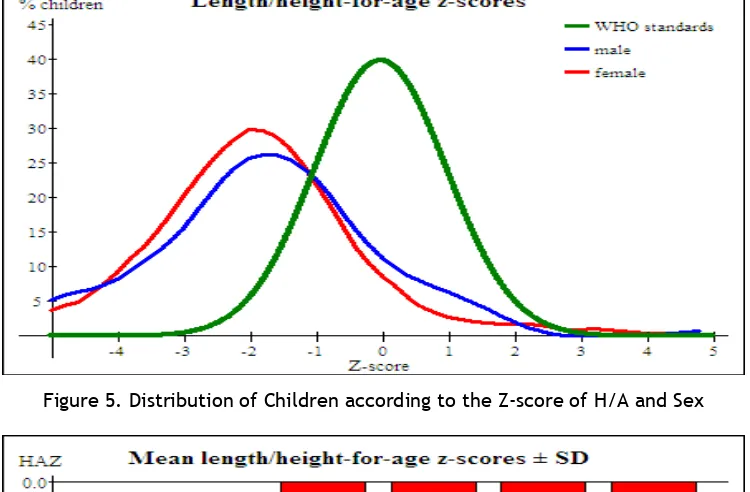
higher among boys; whereas in the high par-ticipation group, it is greater among girls. The sever e st unt ed prevalence (based the criteria of -3 SD) in this research is 20.3%. Eating habit with a lack of animal protein and inade-quate daily intake of energy can be the cause of sever e st unt ed growth among children. It can be seen from Figure 4 that the median Z-score of H/A for the children in the research location is farther to the left than the standard of WHO, i.e. getting closer to -2 standard deviation or st unt i ng.
The gender-based analysis shows that the curve for the Z-score of H/A is slightly worse in the girls than in the boys (see Figure 4). The Z-score of H/A (-1.9) for children in the low participation group is worse than that of the high participation groups (-1.6).
Figure 5. Distribution of Children according to the Z-score of H/A and Sex
Figure 6. Z-score of H/A Value of Children based on Age Group
Like the underweight prevalence, Z-score of H/A between different genders does not take a consistent pattern. In the low par-ticipation group, the boys have a higher Z-score of H/A, whereas in the high group the girls have a higher Z-score of H/A. Like in Fig-ure 3, in FigFig-ure 6 in terms of age groups it can be seen that the Z-score of H/A is the worst in the age group of 24-35 months.
Weight f or Height of Children (W/ H)
Based on the calculation of Z-score of W/H with the wast ed criteria of < -2 SD, the wasted prevalence is found to be 12.3 %. The prevalence of wasted children in the low par-ticipation growth (14.9%) is much higher than that of the high participation group (8.4%). The prevalence among the boys is higher than among the girls in both participation groups.
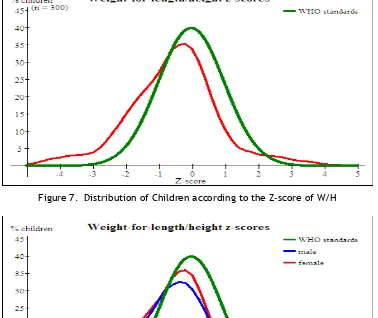
The prevalence of sever e wast ed (Z-score of <-3 SD) in this research is very low, i.e. 4.7 %. From Figure 7 it is clear that the median Z-score of W/H for the children in the research location is rather away to the left compared to the WHO standard of 2005. The median Z-score of W/H for the children in the area is approaching the standard deviation of -0.5 or wasting.
Figure 7. Distribution of Children according to the Z-score of W/H
Figure 8. Distribution of Children based on the Z-score of W/H and Sex
CONCLUSION AND RECOMENDATION
Conclusion
1. The average consumption of energy for children under five years old is still below the recommended dietary allowance (80 % of RDA), whereas the protein consumption is already above the RDA.
2. The prevalence of underweight, stunted, andwasted among children are respectively 30.0 %, 43.7 %, and 12.3 %
3. The activities at posyandus have a positive impact on the nutritional status of children under five year’s olds. The more frequent the visit to posyandus, the better the three nutritional statuses would be
Recommendation
The consumption of children under five years old have impact on the nutritional status of them, so that mothers having children un-der five years old should improve the con-sumption of children. And then the nutritional knowledge of mothers is necessary to make effort in improving the consumption of chil-dren.
ACKNOWLEDGEMENT
The researchers would like to extend its gratitude to the Neys-van Hoogstraten Founda-tion (NHF), the Netherlands for funding this research project. Thank you and appreciation to Ali Khomsan, Dadang Sukandar, and Eddy S. Mudjajanto from Department of Community Nutrition, Faculty of Human Ecology, Bogor Agricultural University as other researchers who also involved in this project.
BIBLIOGRAPHY
Azwar A. 2004. Aspects of Health and Nutrition in Food Security. Paper of National Workshop on Food and Nutrition 2004. LIPI (Indonesian Institute of Science). Jakarta.
Hardinsyah & D Martianto. 1988. Evaluation of Energy and Protein Adequacy Level and Nutritional Quality of Food Consumption. Wirasari, Jakarta.
Harper IJ, BJ Deaton, & JA Driskel. 1986. Food, Nutrition, and Agriculture (Suhardjo, translator) (2nd Ed.). UI Press, Jakarta.
Riyadi H. 1995. Evaluation and Measurement of Nutritional Status. Lecture Notes of Departement of Community Nutrition and Familly Resources, Faculty of Agriculture, IPB, Bogor.
Widiyawati R. 2004. Relation of Mother’s Nutritional Knowledge and behaviour with Children under Five’s Parenting Style in East Bogor Sub-district, Bogor City. Undergraduate script (unpublish- ed). Department of Community Nutrition and Family Resources, Faculty of Agriculture, Bogor Agricultural University (IPB), Bogor.
Winarno FG. 1997. Food Chemistry and Nutrition. Gramedia Pustaka Utama Ltd., Jakarta.