O R I G I N A L A R T I C L E
Defecting From the Gutenberg Legacy:
Employing Images to Test Knowledge Gaps
Maria Elizabeth Grabe, Ozen Bas, & Irene Ingeborg van DrielThe Media School, Indiana University, Bloomington, IN 47405, USA
Education-based knowledge gaps are well-documented across countries, media platforms, and content. Without exception, knowledge is measured through words not images. Given the centrality of sight in the natural history of Homo sapiens, the extraordinary visual acu-ity of humans, and the proliferation of screen-based visual media environments in contem-porary life, an experiment was conducted to test the knowledge gap visually. Participants watched 8 audiovisual news stories. Simple recognition of story details and comprehen-sion of that information were tested in verbal and visual modalities. Results offered the first confirmation of the knowledge gap in visual terms. Yet, gaps were significantly smaller employing visual than verbal measures, pointing to the need for continued efforts to develop visual measures for future memory studies.
Keywords:Knowledge Gap, Information Processing, Images, Experiment, Memory, Visual Processing.
doi:10.1111/jcom.12150
Over the past 40-plus years more than 200 studies have documented a persistent education-based information acquisition divide called the knowledge gap. Despite the robust findings, a number of scholars are growing uneasy about existing concep-tualizations and measures of knowledge in contemporary knowledge gap research. Some of this contrariety is spurred by cognitive science evidence of visual processing as a potent mode of learning. Yet invariably, knowledge gaps have been measured through verbal tests. Visual memory and comprehension measures have not been employed, because researchers seem reluctant to operationalize knowledge in visual terms. Doris Graber (2001) referred to this research orientation as The Gutenberg Legacy, in which the written word is canonized as a conduit of information impor-tant for participatory citizenship. Images, by contrast, are treated as lacking serious information value—perhaps because they are inherently entangled with emotion by being processed via affective pathways in the brain. Dating back at least as far as the
Enlightenment, emotion is seen as irreconcilable with logic and reason. This tradi-tion still anchors most contemporary predictive models of knowledge acquisitradi-tion and active citizenship (Marcus, Neuman, & MacKuen, 2000; Somit & Peterson, 1998) in the imperative of rational choice, enabled by verbal language.
The importance of verbal language in the cultural history ofHomo sapiensstands beyond question. Yet, in the panoramic scope of evolutionary adaptation the human brain has had relatively little time to specialize for oral (40,000 to 50,000 years; see Holden, 2004) and written communication (about 5,000 years; see Houston, 2004). In comparison, visual acuity is not an acquired skill or literacy—it is a vital sense, capacitated by neurological adaptations over millions of years, that affords contempo-rary human cognition and behavior (Damasio, 1994; Gazzaniga, 1998; Parker, 2003). The idea that visual acuity drove the evolutionary course that producedHomo sapiens
might appear lionized and distant as justification for contemporary media research. Yet media use patterns are transformed by rapidly unfolding and sweeping shifts from written words to audiovisuals. According to Cisco (2014), mobile traffic has increased 81% in 2013 and the forecast is that in 2018 video use will make up 69% of all global mobile data traffic.
The signs are clear. A post-Gutenberg era has sprung. Screen-based media envi-ronments with their life-like full motion images (entangled with ambient sound and speech) are likely to become as central as the printed word has been for the past five centuries. Testing information acquisition through user-preferred modalities made good research sense in a newspaper age; scholarly focus on the visual modality is urgently necessary now. The experimental work reported here makes an effort to advance a media research trajectory that recognizes the human acuity for visual processing and growing preference for using media in that modality. Specifically, we (re)tested the knowledge gap, a 4-decade-old theory built on verbal assessments of information gain. In doing so, we employed visual and verbal measures comparatively to understand two different layers of knowledge acquisition: encoding (recognition memory) and comprehension of information.
Verbal knowledge gaps
Since the mid-1970s, more than 200 studies have consistently documented differential knowledge gain across education or socioeconomic status (SES) groups (see Gaziano, 1997, 2010; Hwang & Jeong, 2009). Evidence is robust across cultural contexts (Bon-fadelli, 2002; Hwang & Jeong, 2009; Nguyen & Western, 2007; Van Dijk & Hacker, 2003; Yang & Grabe, 2011), media platforms (Grabe, Kamhawi, & Yegiyan, 2009; Kim, 2008; Wei & Hindman, 2011), and content (Ettema, Brown, & Luepker, 1983; Grabe, Yegiyan, & Kamhawi, 2008; Jerit, Barabas, & Bolsen, 2006). Moreover, individual dif-ferences among audience members have been tested to explain the gap (Eveland & Scheufele, 2000; Kwak, 1999; Neuman, Just, & Crigler, 1992; Price & Zaller, 1993).
Lockhart, 1972; Shiffrin & Schneider, 1977; Tulving & Thompson, 1973) of informa-tion processing (applied to media—see Lang, 2000), the knowledge gap (or news learning studies) tested memory formation at encoding, storage, and retrieval levels. Yet, most studies focused on encoding, using recognition tests (Grabe, Lang, Zhou, & Bolls, 2000; Grabe et al., 2009; Shoemaker, Schooler, & Danielson, 1989; Tremayne & Dunwoody, 2001) and confirmed that lower education groups processed (encoded) news information less efficiently than higher education groups (Grabe et al., 2000, 2008, 2009; Yang & Grabe, 2011). As a departure point of connection to survey and experimental evidence on the knowledge gap, we hypothesize that people with higher levels of education will outperform those with lower levels of education in verbal recognition tests of news information (H1).
A number of scholars have, however, grown uneasy about conceptualizing, quantifying, and measuring knowledge (Bonfadelli, 2002; Gaziano, 1997; Prior, 2014; Selwyn, 2004; Woodall, Davis, & Sahin, 1983) as encoding (recognition memory) rather than comprehension of news (Eveland, Marton, & Seo, 2004; Findahl & Höijer, 1985; Gaziano, 1997; 2010; Graber, 1988; Hindman, 2009; Hwang & Jeong, 2009; Robinson & Levy, 1986; Snoeijer, de Vreese, & Semetko, 2002; Woodall et al., 1983). The traditional view of informed citizenship as memory for cold hard facts is challenged by reconceptualizations of informed citizenship as applied understanding, comprehension, and even emotional involvement with social issues.
Visual primacy and the knowledge gap
In evolutionary circles explanations for why the human brain is better adapted for visual than verbal information processing are often based on the relatively short his-tory of verbal language in the natural hishis-tory ofHomo sapiens. In this regard, Paivio (1971) argues that words are processed in a linear fashion—one at a time—while visuals are processed faster and holistically as an entanglement of verbal and visual memory records. When one of these routes fails at the retrieval stage, the other often can successfully manage the task (Paivio, 1971). This acknowledgement of visual pri-macy inHomo sapiens(and other primates) has unwrinkled the path for ontological shifts in cognitive and neuroscience thinking about the enmeshment of rationality and emotion.
InDescartes’Error, Damasio (1994) argued on the basis of neurological evidence that humans are not primarily thinking beings who also feel, but feeling beings who also think. Visual processing is singled out as the leading conduit of emotional involvement and the dominant mode of learning and building synaptic connections (Barry, 2005; Damasio, 1994). Yet, knowledge gain has been consistently measured through verbal means. Visual memory and comprehension instruments are strik-ingly underdeveloped because knowledge is not operationalized in visual terms. “The belief that audiovisuals are poor carriers of important information has become so ingrained in conventional wisdom,” Graber (2001) observes, “that it has throttled research” (p. 93). Her calls (Graber, 1988, 1990, 1996, 2001) for revising the way media and political communication scholars think about the importance of images as information sources have not been answered earnestly, which instigates the next hypothesis. Regardless of education level, recognition and comprehension scores will be higher when measured visually than verbally (H3).
level has been linked to political knowledge which is measured through the written word, that requires literacy. It thus seems unsurprising that political knowledge and comprehension of political complexities—measured through the written word—are linked to formal education (Jennings, 1996; Nie, Junn, & Stehlik-Barry, 1996). Graber (1996) interprets these findings as a matter of literacy in aid of verbal processing. We argue that literacy also serves verbal knowledge measures. On the other hand, visual information processing requires no literacy, develops practically at birth, and enables most citizens to learn about their social world from a very young age. For unclear reasons, visual processing and visual measures of knowledge remain customarily idle in scholarly pursuits to understand informed citizenship.
It is noteworthy that when Tichenor, Donohue, and Olien (1970) first formu-lated the knowledge gap hypothesis, they suggested that audiovisual learning might enhance knowledge levels among less literate groups: “Since television use tends to be less correlated with education, there is a possibility that television may be a ‘knowledge leveler’ in some areas. Whether TV does in fact have such a leveling function seems to be an urgent matter for further research” (p. 170). More than 40 years later, there is no consensus about the potential of audiovisual learning as an equalizer across edu-cation groups. Some studies showed that visuals aid (Grabe et al., 2009; Gunter, 1987; Katz, Adoni, & Parness, 1977; McCarthy & Warrington, 1988) while others found that they inhibited memory especially when news stories contained discrepant informa-tion across visuals and verbals (Brosius, Donsbach, & Birk, 1996; Van der Molen & Klijn, 2004; Zhou, 2005) or when they were highly compelling (Grabe, Lang, & Zhao, 2003; Miller & Leshner, 2007; Newhagen & Reeves, 1992). Yet, these studies did not measure memory visually. They mostly tested the effects of audiovisual content using verbal information measures or, as Graber (2001) points out, “In tests of what viewers learn from television news, scholars have usually asked only for recall of the verbal message, assuming that the visuals mirrored the verbal texts or conveyed no signifi-cant substantive information at all” (p. 93). Thus, because visuals are not considered to have much information value, they are not used as an index of consequential processes such as memory formation or comprehension of social issues (Graber, 1990).
Indeed, most existing knowledge tests do not measure image-based recognition and comprehension. If cognitive scientists are right in arguing thatHomo sapiens
is generously endowed with visual information processing abilities—compared to verbal processing, which is a recent environmentally driven adaptation—the knowledge gap between higher and lower education groups might disappear if visual knowledge measures are employed. Grounded in this line of thinking, but lacking evidence for formal hypotheses, a research question (RQ1) prompts the comparison of education-based knowledge gaps measured through visual versus verbal modalities for both recognition and comprehension measures.
The time factor
Demographic factors such as education, age, and gender as well as the type of memory (episodic, source, spatial) and stimuli characteristics (emotional dimensions, faces, digits, word-pairs) have been tested for influencing memory decay. Few of these stud-ies have employed stimuli that resemble news.
Dixon, Simon, Nowak, and Hultsch (1982) tested the effect of a week delay on three adult groups and found that although younger participants recalled text materi-als better than middle-aged and older participants, memory decreased over time for all three age groups. Meeter, Murre, and Janssen (2005) investigated memory for news among 14,000 participants worldwide asking questions about news that ranged from as recent as 2 days to 2 years old. Over time, participants forget information regardless of their initial learning rate. Some evidence points to education as inhibiting forget-ting: the higher the education level, the slower the memory decay (Karrasch & Laine, 2003; Morrow & Ryan, 2002). In a knowledge gap study that employed a 48-hour time delay in measures of encoding, storage, and retrieval, Grabe et al. (2009) found evi-dence of greater memory declines for the low than high education group, across all three measures. With a week long delay, Bas and Grabe (2013) found that low edu-cation participants had stronger memory decay than higher educated participants. This offers some point of traction for a hypothesis (H4) predicting that, regardless of modality, the low education group will be associated with more recognition memory and comprehension decay than the higher education group.
Given the sparseness of evidence related to the interaction of audience education level, memory test modality, and time delay, the last research question (RQ2) asks for a comparison of modalities and participant education levels for each of the memory measures (recognition and comprehension).
Method
Design
This experiment employed a mixed factorial 2 (participant education level)×2 (test
modality)×2 (time) model. Education level (high and low) was a between-subjects factor while modality (visual or verbal) and time (two times of measurement 1 week apart) were treated as within-subjects factors. The different levels of modality were represented by verbal and visual memory measures. Four random story sequences were constructed to control for the effects of order.
Participants
Eighty subjects participated in this study conducted in a small Midwestern city in the United States. Low (N=40) and high (N=40) education participants were recruited
potential gender effects, equal numbers of men and women were recruited for the two education groups. The lower age limit was set at 25 to allow time for education to unfold while the upper age limit was fixed at 55 years. The average age of participants in this study was 34 (high education=32; low education=36). Two participants in
the low education group and seven in the high education group self-identified as ethnic minorities. An a priori power analysis revealed that with 76 subjects, effect sizes of .25 should be detected with .95 power in this experimental design. With 80 participants, this study was adequately powered to detect effects.
Stimuli
Eight news stories were selected from a pool of 26 ABC news stories reported by Brian Ross. His investigative reporting style is marked by the inclusion of factual informa-tion linked to related contextual issues. For example, factual informainforma-tion about sexual harassment of teenagers in the workplace was tied to the context of employees who are uninformed about their rights and managers who receive little training on profes-sional conduct. All stories aired on television and became available on the ABC news website, some with additional material. They did not contain negatively compelling images as operationalized by Newhagen and Reeves (1992). The civic importance of the story issue and its potential to resonate across gender and socioeconomic groups were used as guidelines for selection. For example, a story about illegal trade of Chi-nese prisoner body parts was excluded based on the argument that its international scope might not draw similar levels of interest and identification from all participants. The chosen eight stories were about (a) corruption in higher administration of Federal Public Housing, (b) illegal immigrant child labor in agriculture, (c) sleep-deprivation among airline pilots, (d) malfunctioning brakes on Toyota cars, (e) abusive and illegal debt collection practices, (f) sexual harassment of teenage employees in the fast food industry, (g) animal abuse in milk production, (h) lethal but legal drugs.
Dependent variables
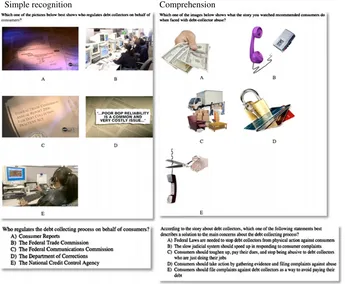
Simple recognition Comprehension
Figure 1 Question examples of visual (above) and verbal (below) version of simple recogni-tion and comprehension.
recognition (visual and verbal) of who regulates debt collection is enough for a correct answer, as shown in Figure 1. Comprehension, on the other hand, required not only remembering information given in the story (i.e., advice to consumers on how to pro-tect themselves against collector abuse) but also application of that information in selecting an answer. Verbal and visual questions for recognition and comprehension were designed so that content and difficulty levels were comparable across modalities. Stimuli did not include negatively compelling images and therefore the memory and comprehension tests were also void of such material. Still images of people (serving coffee, walking on the street, in interview), objects (blueberries, tape recorder, cars), and places (airport, street scenes, home interior) were used.
Procedure
a simple advance button to move linearly through the eight stories. After each story, participants answered evaluative questions. These and demographic and media use items (administered after viewing was completed) served as memory distractors. Memory and comprehension measures were completed next. Participants were thanked and scheduled for the second data collection a week later. There were no stimuli to watch at the second time point. Similar procedures were followed to collect memory data at Time 2.
Findings
Mixed (between- and within-subjects) ANOVA (analysis of variance) procedures were conducted on simple recognition and comprehension measures: 2 (educa-tion level of participants: higher and lower)×2 (test modality: visual and verbal measures)×2 (time: immediately after exposure and a week later). Results are
sum-marized in Table 1. Post hoc paired comparisons were done to identify the critical cells in significant models.
Testing the knowledge gap across the board
The first and second hypotheses required testing main effects for education. Knowl-edge gaps were confirmed for both verbal simple recognition and verbal comprehen-sion measures. Higher educated participants (M=5.96;SE=.19) had higher verbal
simple recognition scores than lower educated participants (M=3.79;SE=.19).
Sim-ilarly, verbal comprehension scores were significantly higher for the high (M=3.70; SE=.12) than low (M=2.11;SE=.12) education group.
Testing the impact of modality
Hypothesis 3 made a forecast for modality main effects on both recognition and comprehension tests such that visual tests would produce higher scores than verbal tests. This hypothesis was also supported. As Table 1 shows, there was a significant main effect in the predicted direction for test modality on simple recognition (visual:
M=6.04,SE=.12; verbal:M=4.88,SE=.13) and comprehension (visual:M=3.15, SE=.08; verbal:M=2.91,SE=.08).
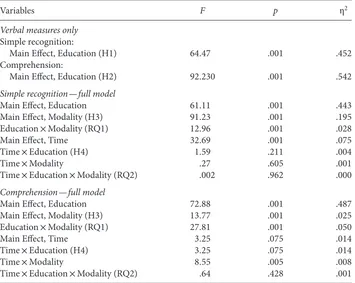
Tests at the crossing of education and modality
RQ1 prompted a sequence of tests to assess the influence of different question modalities on knowledge acquisition across education groups. In short, there were significant interaction effects for modality and education on recognition and com-prehension, as depicted in Figures 2 and 3. Overall, the low education group was more sensitive to modality differences. Post hoc paired comparisons confirmed that asking questions visually narrowed the knowledge gap. Yet, there was a per-sistent gap between education groups on both visual (low education: M=5.39, SE=.16; high education:M=6.69,SE=.16),t(78)= −5.50,p=.001, and verbal (low
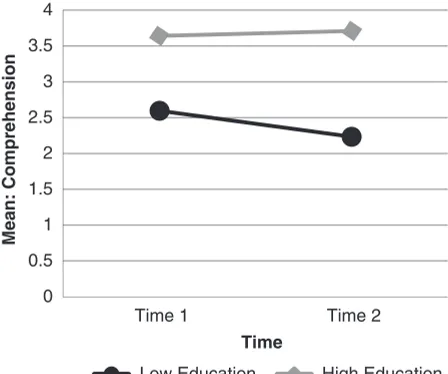
Table 1 F-Test Results for Analysis of Variance on Simple Recognition and Comprehension Measures
Variables F p η2
Verbal measures only Simple recognition:
Main Effect, Education (H1) 64.47 .001 .452
Comprehension:
Main Effect, Education (H2) 92.230 .001 .542
Simple recognition—full model
Main Effect, Education 61.11 .001 .443
Main Effect, Modality (H3) 91.23 .001 .195
Education×Modality (RQ1) 12.96 .001 .028
Main Effect, Time 32.69 .001 .075
Time×Education (H4) 1.59 .211 .004
Time×Modality .27 .605 .001
Time×Education×Modality (RQ2) .002 .962 .000
Comprehension—full model
Main Effect, Education 72.88 .001 .487
Main Effect, Modality (H3) 13.77 .001 .025
Education×Modality (RQ1) 27.81 .001 .050
Main Effect, Time 3.25 .075 .014
Time×Education (H4) 3.25 .075 .014
Time×Modality 8.55 .005 .008
Time×Education×Modality (RQ2) .64 .428 .001
Note:df=1.
p=.001, recognition measures. Yet, from Figure 2 it is clear that the gap narrowed on
visual measures. Moreover, both education groups, low:t(39)=7.40,p=.001; high: t(39)=5.70,p=.001, scored significantly higher in visual, low: M=5.39,SE=.16;
high: M=6.69, SE=.16, than verbal, low: M=3.79, SE=.19; high: M=5.96,
SE=.19, recognition.
Figure 3 shows that comprehension data followed the trend of simple recogni-tion. The knowledge gap was smaller for the visual than verbal measures, yet large enough to be statistically significant for both modalities:t(78)= −6.01,p=.001 and t(78)= −9.60,p=.001, respectively. Strikingly, while the low education group per-formed significantly better on visual (M=2.69,SE=.11) than on verbal (M=2.12, SE=.12) comprehension questions: t(39)=5.00, p=.001, higher-educated people
did not differ significantly in their comprehension of news across the two modalities: visual:M=3.60,SE=.11; verbal:M=3.70,SE=.12,t(39)= −1.87,p=.069.
Testing the time factor
0 1 2 3 4 5 6 7 8
Mean: Simple
recognition
Visual
Low Education
Modality
Verbal
High Education
Figure 2 Interaction effect for education level of participant and modality on simple recogni-tion.
formation of news. The low education group was expected to show more simple recognition and comprehension memory decay than the high education group.
There were main effects for time on simple recognition measures (see Table 1) such that memory decay significantly progressed from Time 1 (M=5.83,SE=.13) to
a week later, at Time 2 (M=5.10,SE=.12). Comprehension faded less dramatically
over time (Time 1:M=3.12,SE=.08; Time 2:M=2.94,SE=.09), indicated by the
main effect that only approached significance (see Table 1). It appears that once infor-mation is comprehended, as opposed to being simply encoded, it is less vulnerable to decay.
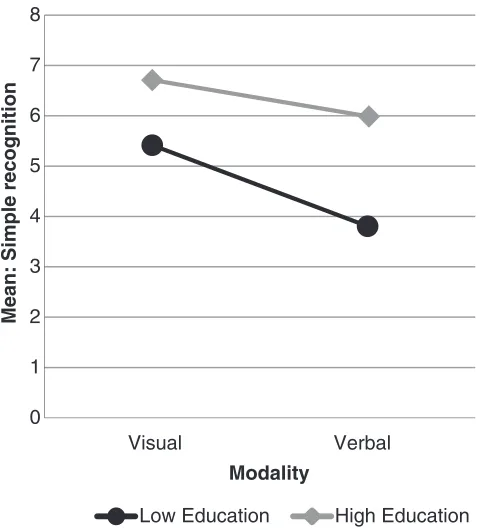
The fourth hypothesis, predicting a Time×Education interaction effect, found sparse support in this data set (see Table 1). The Time × Education interaction
on simple recognition was not significant and it only approached significance on comprehension. Thus, recognition memory for simple facts, regardless of modality, decayed across education groups at a similar rate. Yet, comprehension decayed faster for the low education group. In fact, post hoc paired comparisons showed that the low education group was comprehending significantly better at Time 1 (M=2.59, SE=.12) than Time 2 (M=2.23,SE=.13),t(39)=2.07,p=.045. The high education
group’s comprehension held at exactly the same level (M=3.65, SE=.13) over
0 0.5 1 1.5 2 2.5 3 3.5 4
Mean: Comprehension
Visual
Low Education Modality
Verbal
High Education
Figure 3 Interaction effect for education level of participant and modality on comprehension.
comprehension gap was significant at both time points: Time 1, t(78)= −6.42, p=.001 and Time 2,t(78)= −7.74,p=.001.
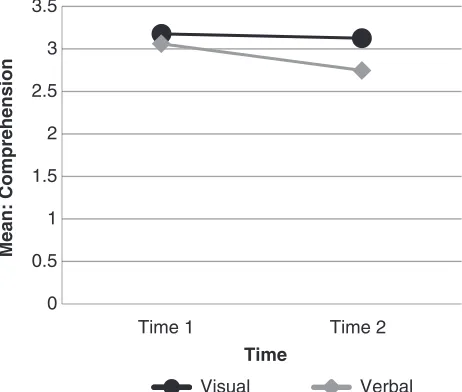
Although there were no predictions for Time ×Modality interaction effects, a significant one (on comprehension) emerged from the ANOVA procedures used here to test hypotheses (see Table 1 and Figure 5). Regardless of participant education level, visual comprehension decayed less over time than verbal comprehension.
0 0.5 1 1.5 2 2.5 3 3.5 4
Mean: Comprehension
Time 1
Low Education Time
Time 2
High Education
0 0.5 1 1.5 2 2.5 3 3.5
Mean: Comprehension
Time 1
Time
Visual
Time 2
Verbal
Figure 5 Interaction effect for time and modality on comprehension.
Post hoc paired comparisons of cells showed that there was a significant difference,
t(79)=3.94, p=.001, between visual (M=3.13, SE=.09) and verbal (M=2.75, SE=.12) comprehension at Time 2 and also a statistically notable decay of verbal
comprehension (Time 1:M=3.07,SE=.09; Time 2:M=2.75,SE=.11) over time, t(79)=2.85,p=.006. No other cell comparisons produced significant differences.
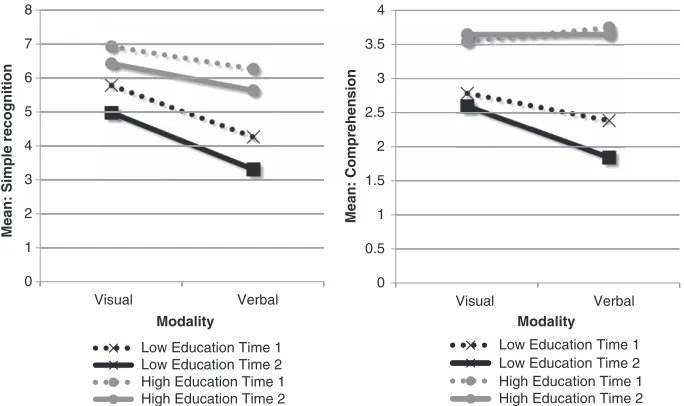
RQ2 prompts testing for a three-way interaction of Education, Modality, and Time to compare gap sizes across visual and verbal modalities, over time. Neither the simple recognition nor comprehension three-way interactions were significant (see Table 1). The absence of interactions on both knowledge measures suggests that the intersection of independent variables is statistically unremarkable. Nonetheless, secondary analyses and visualizing them in graphic form provided clues to latent associations that might not surface in an overall interaction assessment. Figure 6 offers a side-by-side view of these results. The simple recognition graph illustrates the parallel influence of time on memory decay for both education groups with verbal testing producing lower scores than visual testing. Unsurprisingly, all post hoc paired comparisons were statistically significant, as can be expected from pre-viously reported main effects and two-way interactions. Thus, while there is plenty of variance within levels of independent variables, it does not spill out in statistical association across independent variables.
0
Figure 6 Three-way interaction effects for education level of participant, question modality, and time on simple recognition and comprehension.
showed significant over time decay in verbal,t(39)=2.279, p=.009, compared to
visual,t(39)=.977,p=.334, comprehension scores. To clarify this point, Figure 6
graphically shows how citizens with lower levels of education had diminished capac-ity in showcasing their comprehension of issues in verbal tests across time points. Visual tests of comprehension did not produce a significant depreciation over time, as is also clear from Figure 6.
Concluding thoughts
main effect sizes were small. Thus, the knowledge gap remains robust regardless of test modality and time delay. In that sense, Tichenor et al.’s (1970) knowledge gap hypothesis gained another evidentiary foothold in this data set.
Althaus (2012) recommends our discipline would benefit from normative assess-ments that situate evaluative scholarly stances within larger debates. The inevitability of audiovisual screen-based technology as the dominant future conduit of media use prompted us to take stock of existing knowledge measures, stretching and adapting them into visual instruments of measurement. Doing so strays from the dominant research paradigm, grounded in enlightenment convictions about the supremacy of rational thought, facilitated by words. Testing the knowledge gap visually aligns with political scientists such as Doris Graber and Markus Prior who have pioneered the idea that both visual and verbal modalities should be used to measure news retention and knowledge (Graber, 1994, 1996; Prior, 2014). As Prior (2014) cautioned, how-ever, it is not always possible to ask questions visually. In working to accomplish this goal we discovered the extraordinary challenge of posing the same questions in two modalities, which probably explains why researchers have avoided visual measures for so long. Yet, as Figure 1 demonstrates, comparable measures for both modalities testing simple recognition and applied conceptual knowledge (comprehension) can be accomplished.
Moving beyond simple recognition measures generated important insights. A growing number of scholars have noted that recognition memory tests might not offer an assessment of knowledge that would capacitate informed citizenship. Compared to other measures of information gain (e.g., simple recognition, cued recall, or free recall), lasting comprehension is arguably the grandest of achievements in knowledge acquisition. This cognitive accomplishment is also central to the traditional mission of journalism: to inform citizens, across all demographic lines, for participatory democratic practice.
different habitual cognitive strategies (e.g., automaticity, elaboration, analytical) that serve optimal functioning in response to environmental demands. Clearly, different memory measures produce rifts across education groups. Of particular interest is the intersection of education, modality, and time delay. Lower education groups show memory decay most clearly for verbal comprehension. Future research, with adequate statistical power to detect three-way interactions, is needed to shed more light on how images might cognitively capacitate people with lower education levels. Moreover, field experiments and ethnographic work could advance insight into how different education groups use media in an increasingly screen-based environment. This study’s data set suggests that, in the longer term, high-education groups seem better positioned to employ encoded information to the benefit of comprehension. These information navigation skills are likely to perpetuate existing education-based social and economic hierarchies. From a macro vantage point, incorporating media literacy (with emphasis on visuality) in formal education curricula seems overdue.
This study offers an increment in slow-rising evidence that images should be included in assessments of knowledge. The structural exclusion of citizens with lower levels of formal education from experimental studies through the overuse of convenient undergraduate subject pools is a matter of weak (but sometimes tolerable) external validity in social science practice. What is untenable, however, is continued verbal-only measures of how citizens acquire information from media. This tradition engenders a type of measurement bias against citizens with lower levels of education who have greater ability to exhibit what they encode and comprehend through visual assessments. At the risk of overstatement: It is time for an amiable ontological defection from The Gutenberg Legacy.
References
Althaus, S. L. (2012). What’s good and bad in political communication research? Normative standards for evaluating media and citizen performance. In H. A. Sametko & M. Scammell (Eds.),The Sage handbook of political communication(pp. 97–112). Thousand Oaks, CA: Sage.
Barry, A. (2005). Perception theory. In K. Smith, S. Moriarty, G. Barbatsis, & K. Kenney (Eds.),Handbook of visual communication(pp. 45–62). Mahwah, NJ: Lawrence Erlbaum. Bartlett, F. (1932).Remembering: A study in experimental and social psychology. London,
England: Cambridge University Press.
Bas, O., & Grabe, M. E. (2013). Emotion-provoking personalization of news: Informing citizens and closing the knowledge gap?Communication Research.Advance online publication. doi:10.1177/0093650213514602
Basil, M. (1994). Empirical examination of modality-specific attention to television scenes. Communication Research,21(2), 208–231. doi:10.1177/009365094021002004.
Bonfadelli, H. (2002). The Internet and knowledge gaps.European Journal of Communication,
17(1), 65–84. doi:10.1177/0267323102017001607.
Cisco (2014, February 5).Cisco Visual Networking Index:Global Mobile Data Traffic Forecast Update,2013–2018. Retrieved from http://www.cisco.com/c/en/us/solutions/collateral/ service-provider/visual-networking-index-vni/white_paper_c11-520862.html
Craik, F., & Lockhart, R. (1972). Levels of processing: A framework for memory research. Journal of Verbal Learning and Verbal Behavior,11(6), 671–684. doi:10.1016/S0022-5371(72)80001-X.
Damasio, A. (1994).Descartes error: Emotion, reason and the human brain. New York, NY: G. P. Putnam’s Sons.
Dixon, R., Simon, E., Nowak, C., & Hultsch, D. (1982). Text recall in adulthood as a function of level of information, input modality, and delay interval.Journal of Gerontology,37(3), 358–364. doi:10.1093/geronj/37.3.358.
Edwardson, M., Kent, K., Engstrom, E., & Hofmann, R. (1992). Audio recall immediately following video change in television news.Journal of Broadcasting & Electronic Media,
36(4), 395–410. doi:10.1080/08838159209364189.
Ettema, J., Brown, J., & Luepker, R. (1983). Knowledge gap effects in a health information campaign.Public Opinion Quarterly,47(4), 516–527. doi:10.1086/268809.
Eveland, W., Marton, K., & Seo, M. (2004). The influence of online news on the content and structure of public affairs knowledge.Communication Research,31(1), 82–108. doi:10.1177/0093650203260203.
Eveland, W., & Scheufele, D. (2000). Connecting media use with gaps in knowledge and participation.Political Communication,17(3), 215–237. doi:10.1080/105846000414250. Findahl, O., & Höijer, B. (1985). Some characteristics of news memory and comprehension.
Journal of Broadcasting & Electronic Media,29(4), 379–396. doi:10.1080/08838158509386594.
Gaziano, C. (1997). Forecast 2000: Widening knowledge gaps.Journalism and Mass Communication Quarterly,74(2), 237–264. doi:10.1177/107769909707400202.
Gaziano, C. (2010). Notes on “Revisiting the Knowledge Gap Hypothesis: A Meta-analysis of Thirty-five Years of Research”.Journalism & Mass Communication Quarterly,87(3–4), 615–632. doi:10.1177/107769901008700311.
Gazzaniga, M. (1998).The mind’s past. Berkeley, CA: University of California Press. Grabe, M. E., Kamhawi, R., & Yegiyan, N. (2009). Informing citizens: How people with
different levels of education process television, newspapers, and web news.Journal of Broadcasting & Electronic Media,53(1), 90–111. doi:10.1080/08838150802643860. Grabe, M. E., Lang, A., & Zhao, X. (2003). News content and form implications for memory
and audience evaluations.Communication Research,30(4), 387–413. doi:10.1177/00936 50203253368.
Grabe, M. E., Lang, A., Zhou, S., & Bolls, P. (2000). Cognitive access to negatively arousing news: An experimental investigation of the knowledge gap.Communication Research,
27(1), 3–26. doi:10.1177/009365000027001001.
Grabe, M. E., Yegiyan, N., & Kamhawi, R. (2008). Experimental evidence of the knowledge gap: Message arousal, motivation, and time delay.Human Communication Research,
34(4), 550–571. doi:10.1111/j.1468-2958.2008.00332.x.
Graber, D. (1988).Processing the news: How people tame the information tide. White Plains, NY: Longman.
Graber, D. (1994). Why voters fail information tests: Can the hurdles be overcome?Political Communication,11(4), 331–346. doi:10.1080/10584609.1994.9963044.
Graber, D. (1996). Say it with pictures.The Annals of the American Academy of Political and Social Science,546, 85–96. doi:10.1177/0002716296546001008.
Graber, D. (2001).Processing politics: Learning from television in the Internet age. Chicago, IL: University of Chicago Press.
Gunter, B. (1987).Poor reception: Misunderstanding and forgetting broadcast news. New York, NY: Routledge.
Hindman, D. (2009). Mass media flow and differential distribution of politically disputed beliefs.Journalism & Mass Communication Quarterly,86(4), 790–808. doi:10.1177/ 107769900908600405.
Holden, C. (2004). The origin of speech.Science,303(5662), 1316–1319.
Houston, S. D. (2004).The first writing script invention as history and process. New York, NY: Cambridge University Press.
Hwang, Y., & Jeong, S. (2009). Revising the knowledge gap hypothesis: A meta-analysis of thirty-five years of research.Journalism & Mass Communication Quarterly,86(3), 513–532. doi:10.1177/107769900908600304.
Jennings, M. (1996). Political knowledge over time and across generations.Public Opinion Quarterly,60(2), 228–252. doi:10.1086/297749.
Jerit, J., Barabas, J., & Bolsen, T. (2006). Citizens, knowledge, and the information environment.American Journal of Political Science,50(2), 266–282. doi:10.1111/ j.1540-5907.2006.00183.x.
Karrasch, M., & Laine, M. (2003). Age, education and test performance on the Finnish CERAD.Acta Neurologica Scandinavica,108(2), 97–101. doi:10.1034/j.1600-0404. 2003.00037.x.
Katz, E., Adoni, H., & Parness, P. (1977). Remembering the news: What the picture adds to recall.Journalism Quarterly,54, 231–239. doi:10.1177/107769907705400201.
Keating, C., Randall, D., & Kendrick, T. (1999). Presidential physiognomies: Altered images, altered perceptions.Political Psychology,20(3), 593–610. doi:10.1111/0162-895X.00158. Kim, S. (2008). Testing the knowledge gap hypothesis in South Korea.International Journal of
Public Opinion Research,20(2), 193–210. doi:10.1093/ijpor/edn019.
Kwak, N. (1999). Revisiting the knowledge gap hypothesis education, motivation, and media use.Communication Research,26(4), 385–413. doi:10.1177/009365099026004002. Lang, A. (2000). The limited capacity model of mediated message processing.Journal of
Communication,50, 46–70. doi:10.1111/j.1460-2466.2000.tb02833.x.
Lang, A., Zhou, S., Schwartz, N., Bolls, P., & Potter, R. (2000). The effects of edits on arousal, attention, and memory for television messages.Journal of Broadcasting & Electronic Media,44(1), 94–109. doi:10.1207/s15506878jobem4401_7.
Marcus, G., Neuman, W., & MacKuen, M. (2000).Affective intelligence and political judgment. Chicago, IL: University of Chicago Press.
McCarthy, R., & Warrington, E. (1988). Evidence for modality-specific meaning systems in the brain.Nature,334, 428–431. doi:10.1038/334428a0.
Meeter, M., Murre, J., & Janssen, S. (2005). Remembering the news: Retention data from a study with 14,000 participants.Memory & Cognition,33, 793–810. doi:10.3758/ BF03193075.
Morrow, L., & Ryan, C. (2002). Normative data for a short-term working memory test.The Clinical Neuropsychologist,6(3), 373–380. doi:10.1076/clin.16.3.373.13850.
Neuman, W., Just, M., & Crigler, A. (1992).Normative data for a short-term working memory test. Chicago, IL: University of Chicago Press.
Newhagen, J., & Reeves, S. (1992). The evening’s bad news.Journal of Communication,42(2), 25–41. doi:10.1111/j.1460-2466.1992.tb00776.x.
Nguyen, A., & Western, M. (2007). Socio-structural correlates of online news and
information adoption/use: Implications for the digital divide.Journal of Sociology,43(2), 167–185. doi:10.1177/1440783307076894.
Nie, N., Junn, J., & Stehlik-Barry, K. (1996).Education and citizenship in America. Chicago, IL: University of Chicago Press.
Ortony, A. (1978). Remembering, understanding and representation.Cognitive Science,2, 53–69. doi:10.1207/s15516709cog0201_4.
Paivio, A. (1971).Imagery and verbal processes. New York, NY: Holt, Rinehart and Winston. Parker, A. (2003).In the blink of an eye: How vision sparked the big bang of evolution. New
York, NY: Perseus.
Price, V., & Zaller, J. (1993). Alternative measures of news reception and their implications for research.Public Opinion Quarterly,57(2), 133–164. doi:10.1086/269363.
Prior, M. (2014). Visual political knowledge: A different road to competence.Journal of Politics,76(1), 41–57. doi:10.1017/S0022381613001096.
Robinson, J., & Levy, M. (1986).The main source: Learning from television news. Beverly Hills, CA: Sage.
Rosenberg, S., Kahn, S., & Tran, T. (1991). Creating a political image: Shaping appearance and manipulating the vote.Political Behavior,13(4), 345–367. doi:10.1007/BF00992868. Selwyn, N. (2004). Reconsidering political and popular understandings of the digital divide.
New Media & Society,6(3), 341–362. doi:10.1177/1461444804042519. Shiffrin, R., & Schneider, W. (1977). Controlled and automatic human information
processing: II.Psychological Review,84, 127–190. doi:10.1037/0033-295X.84.2.127. Shoemaker, P., Schooler, C., & Danielson, W. (1989). Involvement with the media: Recall
versus recognition of election information.Communication Research,16(1), 78–103. doi:10.1177/009365089016001004.
Snoeijer, R., de Vreese, C., & Semetko, H. (2002). The effects of live television reporting on recall and appreciation of political news.European Journal of Communication,17(1), 85–101. doi:10.1177/0267323102017001608.
Somit, A., & Peterson, S. A. (1998). Biopolitics after three decades: A balance sheet.British Journal of Political Science,28, 559–571.
Tichenor, P., Donohue, G., & Olien, C. (1970). Mass media flow and differential growth in knowledge.Public Opinion Quarterly,34, 159–170. doi:10.1086/267786.
Tremayne, M., & Dunwoody, S. (2001). Interactivity, information processing, and learning on the World Wide Web.Science Communication,23(2), 111–134.
doi:10.1177/1075547001023002003.
Tulving, E., & Thompson, D. (1973). Encoding specificity and retrieval processes in episodic memory.Psychological Review,80, 352–373. doi:10.1037/h0020071.
Van Dijk, J., & Hacker, K. (2003). The digital divide as a complex and dynamic phenomenon. The Information Society,19(4), 315–326. doi:10.1080/01972240309487.
Wei, L., & Hindman, D. (2011). Does the digital divide matter more? Comparing the effects of new media and old media use on the education-based knowledge gap.Mass
Communication and Society,14(2), 216–235. doi:10.1080/15205431003642707. Woodall, W., Davis, D., & Sahin, H. (1983). From the boob tube to the black box: Television
news comprehension from an information processing approach.Journal of Broadcasting,
27(1), 1–23. doi:10.1080/08838158309386469.
Yang, J., & Grabe, M. E. (2011). Knowledge acquisition gaps: A comparison of print versus online news sources.New Media & Society,13(8), 1211–1227. doi:10.1177/1461444 811401708.