171
J Trop Soils, Vol. 21, No. 3, 2016: 171-178DOI: 10.5400/jts.2016.21.3.171
J Trop Soils, Vol. 21, No. 3, 2016: 171-178 ISSN 0852-257X
Litter and Soil Carbon Stock in Cultivated and Natural Area of
Intergrated Forest for Conservation Education of Wan
Abdul Rachman Great Forest Park
Leoni Dellta Ellannia1, Agus Setiawan1 and Ainin Niswati2
1Department of Forestry, Faculty of Agriculture,University of Lampung,2Department of Soil Science, Faculty of Agriculture,University of Lampung, Jalan Sumantri Brojonegoro No. 1, Bandar Lampung, Indonesia,
e-mail: [email protected]
Received 29 January 2016/ accepted 10 August 2016
ABSTRACT
Intergrated Forest for Conservation Education of Wan Abdul Rachman (IFCE WAR) Great Forest Park is a conservation forest zone which has natural area and cultivated area. The natural area in Wan Abdul Rachman Great Forest Park consists of secondary forest, whereas the cultivated area consists of agroforestry with cacao plants and agroforestry with coffee plants. The different land use in both areas caused the difference in carbon sink specifically in litter and soil. The research was aimed to study the difference of litter and soil carbon stock in natural and cultivated area in IFCE WAR Great Forest Park. The observation plots included in the current study was determined using purposive sampling method. The research was conducted in June until August 2015. Data was analyzed using analysis of variance and continued with honestly significant difference test. The results showed that there was no difference of litter carbon stock in cultivated area and natural area in IFCE WAR Great Forest Park, whereas the soil carbon stock in natural area was higher than that in cultivated area.
Keywords: Agroforestry, conservation forest, litter carbon stock, secondary forest, soil carbon stock
INTRODUCTION
Climate change has become a global problem and has attracted worldwide attention. Various impacts of climate change have emerged as natural disasters. The cause of this problem is the earth’s surface warming due to fossil fuel combustion. The combustion products increased the amount of greenhouse gas emissions into atmosphere,
especially carbon dioxide (CO2). In 2012 the amount
of CO2 emission worldwide was about 34.5 billion
tons, increased approximately 1.4% compared to
that in the previous year (Olivieret al. 2013).
Greenhouse gas production and release of CO2
into atmosphere can be mitigated by storing CO2 in
some places. Through photosynthesis, plants absorb
CO2and convert it into nutrients and oxygen.
However, the existing vegetation in the biosphere has not been able to absorb all carbon emissions. In 2012, Indonesia has produced 0.49 billion tons of
carbon dioxide (Olivier et al. 2013). The major
contributor of CO2 emission in Indonesia is
conversion of forest land into other land uses. In
ABSTRAK
Hutan Pendidikan Konservasi Terpadu Taman Hutan Raya Wan Abdul Rahman (HPKT Tahura WAR) adalah areal hutan konservasi yang memiliki areal budidaya dan areal alami. Pemanfaatan lahan areal alami di Tahura WAR terdiri dari hutan sekunder dan areal budidaya yang ditanami kakao dan agroforestri kopi campuran. Perbedaan pemanfaatan lahan menyebabkan kedua area memiliki simpanan karbon yang berbeda, khususnya pada serasah dan tanah.Penelitian ini bertujuan untuk mengetahui perbedaan karbon serasah dan karbon tanah tersimpan di areal budidaya dan areal lindung. Plot di pelitian ini ditentukan dengan menggunakan metodepurposive sampling. Penelitian ini dilakukan pada bulan Juli-Agustus 2015. Data dianalisis dengan menggunakan Analysis of Variance diikuti dengan Uji Beda Nyata Jujur.Berdasarkan hasil penelitian, tidak ada perbedaan yang nyata pada C serasah tersimpan di areal alami dan budidaya. Selain itu, C tanah tersimpan di areal alami lebih tinggi dibandingkan areal budidaya di HPKT Tahura WAR.
2012, the forest area in Indonesia was about 134 million hectares (Direktorat Jenderal Planologi Kehutanan 2012). Forest as a dominant ecosystem
has an important function in CO2 sequestration in
large quantities. In forest, carbon is stored in vegetation including trees that produce litter. In addition to forest, soil plays as carbon pool that able to sequester more carbon in the form of soil organic
matter up to 2 Gigatons yr-1 (Lal 2008).
In general, forests have three major functions, namely for protection, production and conservation. Conservation forest plays an important role for preserving natural resources and ecosystems, therefore, hardly any timber harvesting activities in this area. However, due to economic pressures, people have cleared the forest land and planted crops, which is in contrast with the function of conservation forest. This condition will decrease carbon sequestration ability of forest land, so the amount of carbon stored in forests, especially in litter
and soil will be reduced (Mondeet al. 2008).
One of the existing conservation forests in the Lampung Province is the Integrated Forest for Conservation Education of Wan Abdul Rachman (IFCE WAR) Great Forest Park which has natural area and cultivated area. The difference of land use in both areas may affect forest ability to sequester carbon. This study aims to estimate the amount of litter carbon stock and soil carbon stock both in natural and cultivated areas of IFCE WAR Great Forest Park.
MATERIALS AND METHODS
Study Site
The study was conducted in IFCE WAR Great Forest Park, which is about 1.143 ha. It is located in Bandarlampung, Indonesia, between 105°09’22.17"-105°11’39.13" E and 5°24’ 09.78"-5°26’11.41" S as shown in Figure 1 (Unit Pelaksana Teknis Daerah Taman Hutan Raya Wan Abdul Rachman 2009). The structure of vegetation in this forest area is shown in Table 1. The study was conducted in June until August 2015.
Research Design and Plot Description
Soil samples and litter samples were taken using purposive sampling method, according to the representative study site conditions in IFCE WAR Great Forest Park. In this study, the experiments were designed in completely randomized design with two factors. The first factor was land use that consisted of 3 plots of natural area and 3 plots of cultivated area. The second factor was soil depth at 0-10 cm, 10-20 cm and 20-30 cm. Litter samples were also taken from 6 land uses with 3 replications. The natural area in IFCE WAR Great Forest Park consists of secondary forest, which is not utilized by local people. On the other hand, the cultivated area, which is also part of Wan Abdul Rachman Great Forest Park, has been utilized by
Figure 1. Location of soil and litter sampling in Wan Abdul Rachman Great Forest Park, Lampung.
RESEARCH LOCATION, PLOTS MAP OF ANALYSIS OF LITTER AND SOIL CARBON STOCK IN CULTIVATION AND
NATURAL AREA 15 - 25% (Slightly steep) 24 - 45% (Steep)
local people as agroforestry with cacao plants and agroforestry with coffee plants. Observation plots in the natural area consisted of more plant species than in the cultivated area. Twenty two species were observed in the plots of natural area, whereas 11 species were observed in the plots of cultivated area (Table 1). Plot 1 of the natural area was located at the highest elevation with an altitude of 1,029 meters above sea level. In this plot 12 plant species were identified and the predominant plant species was
Litsea firma. Plot 2 of the natural area was located at 1,006 meters above sea level. About 8 plant species were observed in this plot and the
predominant plant species were Litsea firma and
Vitex pinnata. Plot 3 of the natural area was located at altitude of 950 meters above sea level. About 10 plant species were identified in this plot and the
predominant species was Villebrunea rubescens.
Plot 1 of the cultivated area was located at the altitude of 525 meters above sea level, whereas plot 2 of the cultivated area was located at 540 meters above sea level. Both plots consisted of only 3 plant species and the predominant species was
Theobroma cacao. The difference between both
plots was the predominant tree in plot 1 wasDurio
zibethinus,whereas the predominant tree in plot 2 was Dalbergia latifolia. Plot 3 in the cultivated area, which was located at the altitude of 369 meters, consisted of 10 plant species. The predominant plant
species in this plot wasErythrina lithosperma.
Soil Carbon Sampling and Analysis
The soil samples were collected at 0-10 cm, 10-20 cm and 20-30 cm depth using ring sample. The disturbed soil samples were collected to Table 1. Plants species observed in natural area and cultivated area of IFCE WAR Great Forest
Park.
Species Natural area Cultivated area
Aleurietes moluccana
Ficus ampelas
-Dehaasia cuneata
-Pterocymbium javanicum
-Litsea firma
-Acmena melanostica
-Bridelia glauca
-Anona sp.
-Archidendron microcarpum
-Oraxylum indicum
-Macaranga tanarius
-Villebrunea rubescens
-Ricinus communis
-Vitex pinnata
-Coffea robusta
Archidendron pauciflorum
-Litsea roxburghii
-Artocarpus integra
-Spondias pinnata
-Etlingera solaris
-Aglaia elaegnoidea
-Ficus hispida
-Dalbergia latifolia -
Durio zibhetinus -
Theobroma cacao -
Parkia speciosa -
Erythrina lithosperma -
Archidendron pauciflorum -
Persea Americana -
Lansium domesticum -
determine soil organic carbon content (percentage of organic C) and undisturbed soil samples were taken to determine soil bulk density. The disturbed soil samples were air-dried at room temperature, then soil organic C content was measured using Walkey and Black method. The undisturbed soil
samples were oven-dried at 105°C and weighted in. Bulk density of the soil samples was estimated using the following equation (Hairiah 2011).
Kd = depth of soil samples (cm)
=bulk density (g cm-3)
%C = organic carbon percentage content value.
The soil carbon stock per hectare was calculated using the following equation.
Litter Carbon Sampling and Analysis
Litter samples were taken from litter trap with
the size of 1 m2 and the height of approximately 60
cm. Litter that has been collected within two weeks (Harrison 2013) in a litter trap were weighed in. Litter was oven-dried at 80°C for 48 hours and weighed in. The litter biomass was estimated using the following equation (Hairiah and Rahayu 2007).
(g)
according to Biomass Expansion Factor (BEF).
BEF value could estimate the carbon stock in forests which is equal to 50% of the biomass (IPCC 2006;
Paladinicet al. 2009). Therefore, the litter carbon
stock (Cl) can be estimated using the following formula: Cl = Biomass x 50%.
Data Analysis
The data were analysed using analysis of variance for completely randomized design with two factors and three replications, and continued with honestly significant difference (HSD) test with 5% of significance level.
Tabel 2.p-value of bulk density, soil organic C content (%C), and soil C stock.
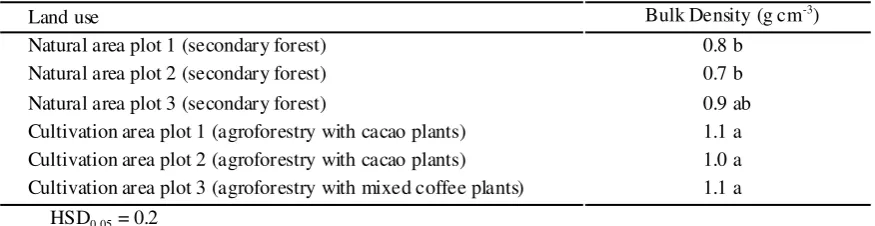
Table 3. Soil bulk density in natural area and cultivated area of IFCE WAR Great Forest Park.
Values followed by the same letter in the same column are not significantly different at the level of 5% HSD Source Bulk Density % C Soil C Stock (√ )
---p value
---Land use 0.00* 0.00* 0.00*
Soil depth 0.20ns 0.00* 0.00*
Land use*soil depth 0.71ns 0.02** 0.97ns
Land use Bulk Density (g cm-3
)
Natural area plot 1 (secondary forest) 0.8 b
Natural area plot 2 (secondary forest) 0.7 b
Natural area plot 3 (secondary forest) 0.9 ab
Cultivation area plot 1 (agroforestry with cacao plants) 1.1 a
Cultivation area plot 2 (agroforestry with cacao plants) 1.0 a
Cultivation area plot 3 (agroforestry with mixed coffee plants) 1.1 a
HSD0.05= 0.2
p-value
RESULTS AND DISCUSSION
Soil Carbon Stock
Based on the results (Table 2) land use and soil depth affected the soil carbon stock but there was no interaction between land use and soil depth that would affect the soil carbon stock. On the other hand, the content of soil organic C was significantly influenced by land use, soil depth and interaction between them, and bulk density was significantly influenced by land use but it was not influenced by soil depth and there was no interaction between land use and soil depth that would affect the soil bulk density.
Soil C stock in a land could be influenced by
the bulk density (g cm-3) and soil organic carbon
content (% C). The results showed that the bulk density of soil samples in a cultivated area was significantly higher than the natural area (Table 3).
The land use change in forest may increase bulk density (Lal 1996). Soil carbon content (%C) in each land use could be seen in Table 4. There were significant difference of soil organic C content between natural area and cultivated area, with the highest soil organic C content was observed in plot 3 of natural area. Land use differences led to soil organic carbon content differences in both areas
(Van Straatenet al. 2015). Soil erosion and soil
temperature in cultivated area could be higher than that in natural area, which further affect the soil organic carbon content. Soil depth also affected the soil organic C content (% C), in which the highest soil organic carbon content was observed at 0-10 cm (Table 4).
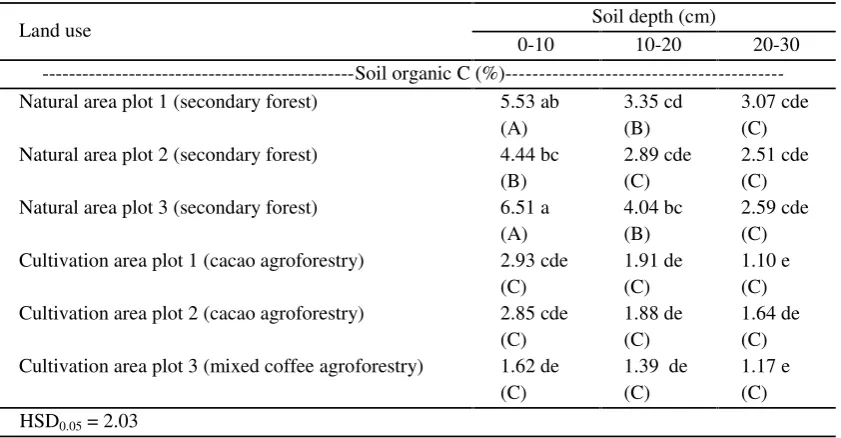
The significant difference of soil organic C content between land use at different soil depth could be seen, especially at 0-10 cm soil depth (Table 4). In this depth, it showed that the soil organic content in plot 3 of natural area was significantly Table 4. Soil organic C content at different land use and soil depth in natural area and cultivated
area of IFCE WAR Great Forest Park.
Values followed by the same letter in the same row and column are not significantly different at the level of 5% HSD. Lowercase was read vertical and capital letter (in parentheses) was read horizontal.
Table 5. Soil carbon stock at different soil depths in natural area and cultivated area of IFCE WAR Great Forest Park.
Values followed by the same letter in the same column are not significantly different at the level of 5% HSD
Land use Soil depth (cm)
0-10 10-20 20-30
---Soil organic C (%)-
---Natural area plot 1 (secondary forest) 5.53 ab 3.35 cd 3.07 cde
(A) (B) (C)
Natural area plot 2 (secondary forest) 4.44 bc 2.89 cde 2.51 cde
(B) (C) (C)
Natural area plot 3 (secondary forest) 6.51 a 4.04 bc 2.59 cde
(A) (B) (C)
Cultivation area plot 1 (cacao agroforestry) 2.93 cde 1.91 de 1.10 e
(C) (C) (C)
Cultivation area plot 2 (cacao agroforestry) 2.85 cde 1.88 de 1.64 de
(C) (C) (C)
Cultivation area plot 3 (mixed coffee agroforestry) 1.62 de 1.39 de 1.17 e
(C) (C) (C)
HSD0.05= 2.03
Depth (cm) Soil C (Mg C ha-1) Soil C ( Transformation√ )
(Mg C ha-1)
0-10 35.68 5.85 a
10-20 22.31 4.63 b
20-30 20.54 4.32 b
higher than that in plot 2. The soil organic C content in the depth of 10-20 cm and 20-30 cm show no siginificant difference between natural area and cultivated area. The finding indicates that different
land use (i.e. secondary forest and agroforestry)
only affected the content of soil organic C in the soil surface (0-10 cm).
There was significant difference of soil C stock, especially at the depth of 0-10 cm as shown in Table 5. Soil C stock in 0-10 cm depth was 35.68 Mg C
ha-1, which was higher than that in 10-20 cm depth
(22.31 Mg C ha-1) and 20-30 cm depth (20.54 Mg
C ha-1). Litter that was accumulated on the soil
surface decomposed into soil organic matter, which further resulted in an accumulation of C in soil organic matter at the soil surface. Litter is a source of food or energy for soil microbes. The decrease of the amount of litter at the depth of 10-20 cm and 20-30 cm may reduce the supply or input of soil C, which further decreases soil microbial activity
(Fontaineet al. 2007). Vertical root distribution also
affects organic matter content in the soil because the roots are able to distribute organic material into
the soil (Hess et al. 2014). A decrease of the root
number in the soil can reduce the organic material content, hence the carbon cycle rate in the soil can be slowed down (Jobbagy and Jackson 2000).
Soil C stock in natural area of IFCE WAR Great Forest Park was significantly different from that in cultivated area. The results of analysis of variance and honestly significant difference test at 5% of significance level were shown in Table 6. Soil C stock in each plot of natural area was significantly different with that in plots of cultivated area. Based on Table 6, the highest soil C stock was observed in
plot 3 of natural area, i.e. about 38.81 Mg C ha-1.
Furthermore, soil C stock in plot 3 of natural area was higher than that in plot 1 and 2 of natural area.
Soil C stock in plot 1 was 31.68 Mg C ha-1 and in
plot 2 was 26.11 Mg C ha-1. Plot 3 of natural area
was located at the lowest altitude among the plots in natural area hence the sediment transport through erosion would be accumulated at the plot 3 of natural area. Plot 1 and 2 of natural area was located at higher elevation and surrounded by steep slopes, as a result plot 1 and 2 had higher erosion rate and the soil C stock in both plots were lower than that in plot 3.
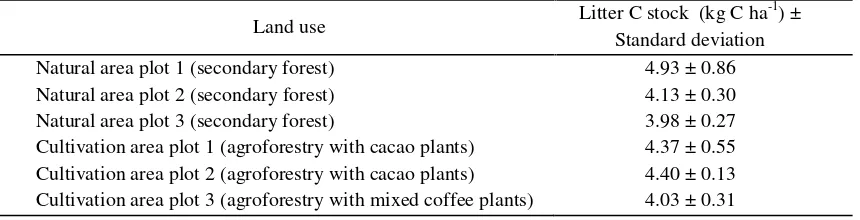
There was no significant difference between soil C stock in secondary forests (plot 1 and 2 of natural area) and agroforestry plots with cacao plants (plot 1 and 2 of cultivated area). Due to the agroforestry plots with cacao plants have gentler slope than plot 1 and plot 2 of secondary forest, soil Table 7. Litter C stock in natural area and cultivated area of IFCE WAR Great Forest Park.
Land use Litter C stock (kg C ha
-1 ) ± Standard deviation
Natural area plot 1 (secondary forest) 4.93 ± 0.86
Natural area plot 2 (secondary forest) 4.13 ± 0.30
Natural area plot 3 (secondary forest) 3.98 ± 0.27
Cultivation area plot 1 (agroforestry with cacao plants) 4.37 ± 0.55 Cultivation area plot 2 (agroforestry with cacao plants) 4.40 ± 0.13 Cultivation area plot 3 (agroforestry with mixed coffee plants) 4.03 ± 0.31
Land use Soil C stock
(Mg C ha-1)
Soil C Stock (Mg C ha-1) (Transformation√ )
Natural area plot 1 (secondary forest) 31.68 5.58 ab
Natural area plot 2 (secondary forest) 26.11 4.88 abc
Natural area plot 3 (secondary forest) 38.81 6.05 a
Cultivation area plot 1 (agroforestry with cacao plants) 22.11 4.62 bc
Cultivation area plot 2 (agroforestry with cacao plants) 22.32 4.65 bc
Cultivation area plot 3 (agroforestry with mixed coffee plants) 14.79 3.81 c
n = 3 HSD0,05= 1.38
Table 6. Soil C stock in different land use (natural area and cultivated area) in IFCE WAR Great Forest Park.
that was transported from higher altitude would
accumulate at the lower altitude (i.e. agroforestry
plots with cacao plants), therefore agroforestry plots with cacao plants are able to store the soil carbon well. Soil C stock in plot 1 and 2 of agroforestry
plots with cacao plants was 22.11 Mg C ha-1 and
22.32 Mg C ha-1, respectively. The lowest Soil C
stock was found in plot 3 of agroforestry plot with mixed coffee plants (cultivated area), which had soil
C stock of 14.79 Mg C ha-1.
The significant difference of soil carbon stock was observed between plots 1 and 3 of natural area and agroforestry plot with mixed coffee plants (Table 6). Soil carbon stock in natural area was higher than that in the cultivated area. This finding corresponds
to the study of Monde et al. (2009) and
Hombegowda et al. (2015), which showed that
forest can store higher soil C than applied agroforestry land. Sediment transport on forest land was lower than that on the agroforestry land, which further affected soil C concentration (Junaidi 2013;
Zhanget al. 2013). Land with tillage was able to
produce higher CO2 emission compared to land
without tillage (Reicosky 2001; Al-Kaisi and Yin 2005). Therefore, the cultivated area that applied soil tillage had lower soil organic carbon content than the natural area.
The decomposition rate of organic matter in the cultivated area was higher than in the natural area, which was affected by microclimate differences in both areas. Soil surface in natural area received slight of sunlight, as a result the soil became more humid and the decomposition process would be slow. The cultivated area with high sunlight intensity and warmed soil temperature would accelerate the decomposition process. Microclimate differences, particularly the moisture greatly
affected litter decomposition (Lee et al. 2014).
Decomposition is the process of organic material breakdown by soil microbes into simpler compounds
by releasing CO2 (Aprianis 2011). Litter
decomposition rate in cultivated area was high, consequently soil C stock in cultivated area emitted more carbon to atmosphere. Therefore, the soil C stock in the cultivated area was low.
Litter Carbon Stock
Analysis of variance on the litter C stock indicated that there was no significant difference of litter C stock between natural area and the cultivated area of IFCE WAR Great Forest Park. The average litter C stock is shown in Table 7. The highest litter
C stock was observed in plot 1 of natural area (i.e.
4.93 kg C ha-1) and the lowest litter C stock was
observed in plot 3 of cultivated area (i.e. 4.03 C kg
ha-1). The study of Zhanget al.(2013) showed that
the different vegetation changes did not affect litter
C stock in a field. Montane et al. (2010) also
reported that the litter quantity did not increase accumulation of soil organic C, but the litter quality did. Vegetation composition differences between cultivated area and natural area only lead to differences in the litter quality that affected litter decomposition rate. Litter quality was affected by N concentration, lignin concentration, C: N ratio, N: P ratio, lignin:N ratio, leaf dry matter content, holoselolusa concentration and others. The microbial existence and activity in manipulating the decomposition process depends on these factors thus the litter quality has an important role in the litter carbon sequestration and as a soil C input.
CONCLUSIONS
In conclusion, land use affected the soil C stock resulted in higher soil C stock in natural area (secondary forest) of Intergrated Forest for Conservation Education Wan Abdul Rachman Great Forest Park (IFCE WAR Great Forest Park) than in cultivated area. Land use change also affected soil organic carbon content at 0-10 cm soil depth, therefore soil at 0-10 cm depth had the highest soil C stock. On the other hand, there was no difference of carbon (C) stored in the litter in the natural area and cultivated area of IFCE WAR Great Forest Park.
REFERENCES
Al-Kaisi MM and X Yin. 2005. Tillage and crop residue effects on soil carbon and carbon dioxide emission in corn–soybean rotations.J Environ Qual34: 437-445.
Aprianis Y. 2011. Produksi dan laju dekomposisi serasah Acacia crassicarpa A. Cunn. di PT. Arara Abadi. Tekno Hutan Tanaman4: 41-47. (in Indonesian). Fontaine S, S Barot, HLM Barré, N Bdioui, B Mary and C
Rumpel. 2007. Stability of organic carbon in deep soil layers controlled by fresh carbon supply.
Nature 450: 277-280.
Direktorat Jenderal Planologi Kehutanan. 2012. Data dan Informasi Pemanfaatan Hutan Tahun 2012. Kementerian Kehutanan. Jakarta. 145p. (in Indonesian).
Hairiah K, A Ekadinata, RR Sari and S Rahayu. 2011.
Hairiah K and S Rahayu. 2007. Pengukuran Karbon Tersimpan di Berbagai Macam Penggunaan Lahan. World Agroforestry Centre ICRAF. Bogor. 77p. (in Indonesian).
Harrison ME. 2013. Standard Operating Procedure: Forest Litter-fall. Orangutan Tropical Peatland Project. Palangkaraya. 20p.
Hess NJ, GE Brown and C Plata. 2014. Belowground Carbon Cycling Processes at the Molecular Scale: An EMSL Science Theme Advosory Panel Workshop (No. PNNL-2219). Pacific Northwest National Laboratory (PNNL), Richland, WA (US). Hombegowda HC, O van Straaten, M. Köhler, and D.
Hölscher. 2015. On the rebound: soil organic carbon stocks can bounce back to near forest levels when agroforests replace agriculture in southern India.
Soil Discussions 2: 871-902.
Intergovernmental Panel on Climate Change. 2006. Agriculture, forestry and other land use. Guidelines for National Greenhouse Gas Inventories (Vol. 4). IGES, Japan.
Jobbagy EG and RB Jackson. 2000. The vertical distribution of soil organic carbon and its relation to climate and vegetation. Ecol Appl10: 423-446. Junaidi E. 2013. Peranan penerapan agroforestry terhadap
hasil air daerah aliran sungai (DAS) Cisaande.J Penelitian Agroforestry 1: 41-53.
Lal R. 1996. Deforestation and land-use effects on soil degradation and rehabilition in western Nigeria. I. Soil physical and hydrological properties. Land Degrad Develop 7: 19-45.
Lal R. 2008. Carbon sequestration. Philosophical Transactions of the Royal Society B: Biol Sci 363: 815-830.
Lee H, J Fitzgerald, DB Hewins, RL McCulley, SR Archer, T Rahn and HL Throop. 2014. Soil moisture and soil-litter mixing effects on surface soil-litter decomposition: A controlled environment assessment. Soil Biol Biochem72: 123-132.
Lugina M, KL Ginoga, A Wibowo, A Bainnaura and T Partiani. 2011. Prosedur Operasi Standar untuk Pengukuran dan Perhitungan Stok Karbon di Kawasan Konservasi. Pusat Penelitian dan Pengembangan Perubahan Iklim dan Kebijakan Baand Penelitian and Pengembangan Kehutanan. Bogor. 28p. (in Indonesian).
Monde A, N Sinukaban, K Murtilaksono and N Pandjaitan. 2008. Dinamika karbon (C) akibat alih guna lahan hutan menjadi lahan pertanian. J
Agroland : 22-26.
Montané F, J Romanyà, P Rovira and P Casals. 2010. Aboveground litter quality changes may drive soil organic carbon increase after shrub encroachment into mountain grasslands. Plant Soil 337: 151-165. Olivier JG, G Janssens-Maenhout, M Muntean and JAHW Peters. 2013. Trends in Global CO2Emissions 2013 Report. PBL Publishers. The Hague. 60p.
Paladinic E, D Vuletic, I Martinic, H. Marjanovic., K. Indir, M. Benko and V. Novotny. 2009. Forest biomass and sequestered carbon estimastion according to main tree components on the forest stand scale.
Periodicum Biologorum 111: 459-466.
Reicosky DC. 2001. Effects of conservation tillage on soil organic carbon dynamics: field experiments in the US corn belt. Sustaining the global farm. Purdue University, West Lafayette, 481-485.
Unit Pelaksana Teknis Daerah Taman Hutan Raya Wan Abdul Rachman. 2009. Buku Informasi Taman Hutan Raya Wan Abdul Rachman. Dinas Kehutanan Provinsi Lampung. Bandarlampung. 38p.
Van Straaten O, MD Corre, K Wolf, M Tchienkoua, E Cuellar, RB Matthews and E Veldkamp. 2015. Conversion of lowland tropical forests to tree cash crop plantations loses up to one-half of stored soil organic carbon.Proc Nat Acad Sci12: 9956-9960. Wang S, H Ruan and Y Han. 2010. Effects of microclimate,
litter type, and mesh size on leaf litter decomposition along an elevation gradient in the Wuyi Mountains, China. Ecol Res25: 1113-1120. Zhang K, X Cheng, H Andg, C Ye, Y Zhang and Q Zhang.
2013. Linking litter production, quality and decomposition to vegetation succession following agricultural abandonment. Soil Biol Biochem57: 803-813.