11 2.1 Previous Study
Study concerning topic of belief adjustment model has been conducted by previous researchers. Below are summary of previous study which supports this current study.
1. Luciana Spica Almilia and Supriyadi (2013)
The method used in this study is 2x2 experimental method, that is disclosure pattern (SbS and EoS) and the information order (++-- or --++), and to support the testing data in this study, the researcher used a statistical test ANOVA and t-test. The results of these tests show that the recency effect would occur if the disclosure pattern used is step by step (SbS). The results also indicate that one of the methods that can be used to eliminate the order effect, especially the recency effect is the end of sequence (EoS) disclosure pattern. When investors receive evidence simultaneously (EoS) either with a sequence pattern good news followed by bad news (++--) or bad news followed by good news (--++), then the investor will provide more objective assessment. It is because investors make a comprehensive assessment on all information received both positive and negative information.
The current study and the prior study has similarity as follows:
2. The experimental procedure used in this prior study and this current study is paper and pencil test experiment, which is the participant will manually answer the questionnaire given by the researcher.
3. Both of the current study and the prior study examine the revision of decision made by investors in determining the value of company stock as the dependent variable.
4. The participants used in this prior study and this current study are students from private universities in Surabaya which has taken a course of financial statement analysis and investment management (non-professional investors). 5. The research type and the type of research data employed in this prior study
and this current study is an experimental research by using primary data. However, the differences of this current study with this prior study are described as follows:
1. The research experimental method used in the prior study was 2x2 experimental method, that is disclosure pattern (Step by Step and End of Sequence) and the information order (++-- or --++), while the current study uses 2x2x2x2 experimental method, that is, disclosure pattern (SbS and EoS), the information order (++-- or --++), the type of information (accounting information and non-accounting information), and investors overconfidence (overconfidence or non-overconfidence).
between investors overconfidence level on investment decision making, while the prior study was only employ ANOVA statistic test, independent sample t-test and descriptive statistics to test the hypothesis.
2. Luciana Spicaet al. (2013)
This study is aimed to examine the effect of the information order presentation on investment decision making and to examine the influence of the information disclosure pattern on information decision making. Independent variables used in this study is the information disclosure pattern (Step by Step and End of Sequence), the information order presentation (++-- or -- ++) which is a series of positive information followed by negative information or reverse, and the type of information (accounting, non-accounting and accounting information as well as a mixed of non-accounting information). This research is an experimental research using 2x2x3 experimental method which is intended to test the causal relationship between the variables that will be manipulated and continued with the research hypothesis testing.
The current study and the prior study has similarity as follows:
1. The participants used in the prior study and the current study are students from private universities in Surabaya who has already have some knowledges in the field of investment, has already taken the course of financial statement analysis and investment management (non-professional investors).
2. The experimental procedure used in this prior study and this current study is paper and pencil test experiment, which is the participant will manually answer the questionnaire given by the researcher.
3. The dependent variable examined in the prior study and the current study is the investment decision making by investors.
4. The grand theory used in the prior study and the current study is The Belief Adjustment Theory.
5. The research type and the type of research data employed in this prior study and this current study is an experimental research by using primary data. However, the differences of this current study with this prior study are described as follows:
uses 2x2x2x2 experimental method, that is, disclosure pattern (SbS and EoS), the information order (++-- or --++), the type of information (accounting information and non-accounting information), and the investors overconfidence (overconfidence or non-overconfidence).
2. The prior study was aimed to examine the effect of the information order presentation on investment decision making and to examine the influence of the information disclosure pattern on information decision-making, while the current study is aimed to examine whether there is any different judgment between the investor who receives good news followed by bad news (++--) and the one who receives bad news followed by good news (--++) information order in SbS and EoS disclosure pattern by using accounting information and non-accounting information and to examine whether there is any effect of investor overconfidence characteristics on investment decision making.
3. The analysis techniques employed in the current study are Mann-Whitney test, independent sample t-test, descriptive statistics and also uses additional analysis technique, that is calibration technique to measure the correlation between investors overconfidence level on investment decision making, while the prior study was only employ independent sample t-test by using manipulation check to test the hypothesis.
3. Dipankar Ghosh and Anne Wu (2012)
performance measures on financial analyst recommendation to divest or invest in a company. The independent variables used in this study were performance measures (financial and non-financial) and their favorableness (favorable or unfavorable). Participants used in this study in a total of 116 financial analysts received the experimental materials, with the amount of data that can be processed is 104 participants. Data analysis techniques used in this study was descriptive statistics and to test the hypothesis proposed, the researchers used ANOVA test.
The results showed the measurement of financial and non-financial performance and their favorableness have interactive impact on the analyst recommendations. The results indicate that the recommendations were almost "definitely sell" was given when both financial and non-financial measures were unfavorable. The recommendations did not change materially during the financial measures remained unfavorable, where the size of the non-financial favorableness was not relevant when the financial measures are unfavorable. When the financial measures look favorable, non-financial measure had a differential effect on analyst recommendations depending on whether these measures were favorable or unfavorable. When non-financial measures were unfavorable, the recommendations closer to "hold", but when the non-financial measures expected to favorable, the recommendation were closer to "definitely buy".
The current study and the prior study has similarity as follows:
paper and pencil test experiment, which is the participants will manually answer the questionnaires given by the researcher and directly returned them to the researcher upon completion.
3. One of the independent variable used in the prior study and the current study is the financial and non-financial information.
However, there are some differences in the current study and the prior study as described as follows:
1. The research method employed in the prior study was 2x2 between-subject design experimental method, that is the performance measures (financial and non-financial information) and the favorableness (favorable or unfavorable), while the current study uses 2x2x2x2 experimental method, that is, disclosure pattern (SbS and EoS), the information order (++-- or --++), the type of information (accounting information and non-accounting information), and investors overconfidence (overconfidence or non-overconfidence).
2. Participants used in the prior study were financial analyst (professional investor) while the current study employs undergraduate business student from private university in Surabaya who has already have some knowledges in the field of investment, has already taken the course of financial statement analysis and investment management (non-professional investors).
current study uses Mann-Whitney test, independent sample t-test, descriptive statistics and also uses additional analysis technique to test the overconfidence variable, which is tested using calibration technique to measure the correlation between investors overconfidence level on investment decision making.
4. Irwan Trinugroho and Roy Sembel (2011)
This study is aimed to test the excessive trading hypothesis, investors who have higher overconfidence indicated by the level of miscalibration have a tendency to excessively engaged in stock trading practices. The dependent variable used in this study is the behavior of cognitive bias, that is, the level of investor overconfidence. While the independent variables used in this study is the total stock trading frequency and stock trading volume.
Participants used in this study were undergraduate management student at Sebelas Maret University, Indonesia, who has joined on minimal courses of financial management and have never invested in the stock market. These participant criteria were selected in order to represent the original characteristics that can be easily manipulated in this experimental study. In addition, students have the academic ability to have a good understanding on investment.
of stock trading and stock trading volume before and after the bad news in high-level and low overconfidence.
The results of these tests showed an empirical evidence that supports excessive trading theory which states that high overconfidence behavior will likely cause investors to take aggressive excessive trading strategy. Further, it can lead to poor investment performance. Overconfidence causes frequently and higher stock trading volume transactions resulting in lower investment performance.
The current study and the prior study has similarity as follows:
1. The grand theory used in the prior study and the current study is The Excessive Trading Theory.
2. Participants used in the prior study and the current study are undergraduate student which has joined minimal course on financial management and have never invested in the stock market (non-professional investors).
3. The investor behavior characteristic examined in the prior study and the current study is investor overconfidence. The purpose of the current study is to identify the effect of belief adjustment model and investor overconfidence towards investment decision making by using calibration technique, while the purpose of the prior study is to test the investor overconfidence towards excessive trading hypothesis.
4. The research type and the type of research data employed in this prior study and this current study is an experimental research by using primary data. 5. The overconfidence variable in the prior study and the current study is tested
Kufepaksi (2007).
However, the differences between this current study and this prior study are described as follows:
1. The experimental procedure used in this prior study was trading simulation experiment by using software, each participant in this study was given virtual start-up capital to invest, while this current study uses paper and pencil test experiment, which is the participant will manually answer the questionnaire given by the researcher.
2. The prior study was aimed to examine only the effect of the investor overconfidence level on the excessive trading theory, while the current study is aimed to examine whether there is any different judgment between the investor who receives good news followed by bad news (++--) and the one who receives bad news followed by good news (--++) information order in SbS and EoS disclosure pattern on long series of information and to examine whether there is any different judgment between the investor who has high level of overconfidence and the one who has low overconfidence level on stock price judgment.
trading volume before and after the bad news in high-level and low overconfidence, while the current study uses 2x2x2x2 experimental method, that is, disclosure pattern (SbS and EoS), the information order (++ or --++), the type of information (accounting information and non-accounting information, and investors overconfidence (overconfidence or non-overconfidence).
4. The analysis techniques employed in the current study are Mann-Whitney test, independent sample t-test, descriptive statistics and also uses additional analysis technique to test the overconfidence variable, which is tested using calibration technique to measure the correlation between investors overconfidence level on investment decision making, while the prior study employed calibration technique, one-way ANOVA, Bonferroni test, independent sample t-test, and paired samples t-test to test the hypothesis. 5. Robert Pinsker (2011)
research done by Pinsker in 2007, so the research procedure is exactly similar with Pinsker’s research in 2007. The difference with previous research is the researcher uses the double amount of data or items to 40 informations used in the experiment. Experimental method used in this study is a 2x2 experimental method, that is, information order consists of good news followed by bad news (++--) or bad news followed by good news (--++) and disclosure pattern (SbS and EoS). Data analysis techniques used in this study are parametric t-test, non-parametric Mann-Whitney and Kolmogorov-Smirnov test. Meanwhile, an analytical technique used in testing the hypothesis is ANOVA. These results indicate the existence of empirical evidence of recency effects for both the sequential and simultaneous disclosure pattern. However, researcher was unable to obtain reliable evidence on previous experiments and strong support in the second experiment (current) for exacerbated recency effects in the sequential condition relative to the simultaneous conditions. In addition, the researcher also found evidence that the increased aggregation of information on the condition of simultaneous relative to the sequential condition. In addition, the researchers add experiments using actual non-professional investors who support the findings of the second experiment. In conclusion, there is arecencyeffect in all test conditions that was significantly greater in the sequential condition rather than simultaneously by providing 40 items or information.
The current study and the prior study has similarity as follows:
Pattern.
2. Participants used in the prior study and the current study are undergraduate student which has business experience or relevant courses had been used in accounting studies (non-professional investors).
3. The research type and the type of research data employed in this prior study and this current study is an experimental research by using primary data. 4. The experimental procedure used in this prior study and this current study is
paper and pencil test experiment, which is the participant will manually answer the questionnaire given by the researcher.
5. The dependent variable examined in the prior study and the current study is the investment decision making by investors.
However, the differences of this current study with this prior study are described as follows:
2. The research method employed in the prior study was 2x2 experimental research method, that is, disclosure pattern (SbS and EoS) and the information order disclosure (++-- and / or --++), while the current study uses 2x2x2x2 experimental method, that is, disclosure pattern (SbS and EoS), the information order (++-- or --++), the type of information (accounting information and non-accounting information) and investor overconfidence (overconfidence or non-overconfidence).
3. The data analysis techniques employed in the current study are Mann-Whitney test, independent sample t-test, descriptive statistics and also uses additional analysis technique to test the overconfidence variable, which is tested using calibration technique to measure the correlation between investors overconfidence level on investment decision making, while the prior study employed parametric t-test, nonparametric Mann-Whitney and Kolmogorov Smirnov test and ANOVA to test the hypothesis.
6. Huismanet al.(2011)
This study is aimed to provide an alternative method of measuring the level of investor overconfidence using data survey that is unique to the prediction of capital markets investors, and test the level of overconfidence on the individual investor who is not influenced by the realization of return on capital markets and the experiment pattern. The variable used in this study is the behavior of cognitive bias, that is, the level of investor overconfidence.
who become clients of Dutch ABN Amro Bank, one of the largest banks in the Netherlands. Participants used in this study are active investors who trade stocks repeatedly each week. The method used in this study is a survey research method. To assess the level of investor overconfidence, the method of filling out the questionnaire online was employed. Each survey consists of two sets of questions. The same set of questions is designed for all the survey. A set of other question designed by ABN Amro Bank and vary in each survey. Testing methods used in this study using a Parkinson test to measure the level of investor overconfidence.
The results of the study introduce a new method of measurement of the level of investor overconfidence and test the method to a data set that is new and unique. In this method, measurements of confidence obtained by repeated surveys in which investors are asked to estimate the index of stock prices in the future at a maximum price and the minimum price. The results showed that retail investors are experiencing significant overconfidence bias.
The current study and the prior study has similarity as follows:
capital markets and the experiment pattern.
2. The grand theory used in the prior study and the current study is The Excessive Trading Theory.
However, the differences between this current study and this prior study are described as follows:
1. The research method employed in the prior study was survey research method, while the current study is an experimental study which uses 2x2x2x2 experimental method, that is, disclosure pattern (SbS and EoS), the information order (++-- or --++), the type of information (accounting information and non-accounting information) and investors overconfidence level (overconfidence or non-overconfidence).
2. Participants employed in the prior study are the private investors who become clients of Dutch ABN Amro Bank, one of the largest banks in the Netherlands. Participants used in this study are active investors who trade stocks repeatedly each week are non-professional investors, while the participants used in the current study is non-professional investors.
3. The research data type employed in this prior study was obtained from periodic surveys conducted every two weeks that the researcher had unique access to (secondary data), while this current study is using primary data. 4. The data analysis techniques employed in the current study are
investors overconfidence level on investment decision making, while the prior study employed Parkinson volatility estimate to measure overconfidence level.
7. Marcia Zindelet.al(2010)
This study is aimed to examine the relationship between selected biological characteristics of investors and cognitive bias called overconfidence. The dependent variable used in this study is the behavior of cognitive bias, that is, the level of investor overconfidence. While the independent variables used in this study were gender, age, handedness, second-to-fourth digit ratio, waist-to-hip ratio, and the emotional level of investors, the influence of parents, religious, and experience. Participants used in this study were 44 professional investors, which consists of 31 male investors and 13 female investors. The investors participate in an event sponsored by the Association for Professional Investors in Capital Market (APIMEC), which took place in Florianopolis, Brazil throughout 2008. The research method used in this study is an experimental research method. To assess the level of investor overconfidence, the researcher used questionnaires to examine the impact of overconfidence behavior and to know which biological characteristics that influence investor behavior. In addition, to support the hypothesis testing, logistic regression was employed in this study.
calibrated. Meanwhile, the results of logistic regression showed that male investors, father, right- handed investors, and courses at the university level and less than 5 years of experience in the capital markets have a higher degree of overconfidence of the samples tested.
The current study and the prior study has similarity as follows:
1. Both of the variable examined in the prior study and the current study is the investor overconfidence.
2. Both of the research data type employed in this prior study and this current study is primary data obtained from collected questionnaire given in the prior study and from experimental materials collected in the current study. 3. One of the aim of this prior study and this current study is similar, that is to
examine the presence of the overconfidence effect.
However, some differences in the prior study and the current study are exist as described as follows:
1. The purpose of the current study is to identify the effect of belief adjustment model and investor overconfidence towards investment decision making by using calibration technique, while the purpose of the prior study is to examine the relationship between selected biological characteristics of investors and cognitive bias called overconfidence.
information and non-accounting information) and the investors overconfidence level (overconfidence or non-overconfidence).
3. Participants used in the prior study were professional investors, while the current study uses undergraduate business student who has joined minimal course on financial management and have never invested in the stock market (non-professional investors).
4. The data analysis techniques employed in the current study are Mann-Whitney test, independent sample t-test, descriptive statistics and also uses additional analysis technique to test the overconfidence variable, which is tested using calibration technique to measure the correlation between investors overconfidence level on investment decision making, while the prior study employed calibration technique, t-test, and logistic regression to test the proposed hypothesis.
8. Abhijeet Chandra (2009)
a survey research method. To support the testing of individual investor’s behavior in this study, the researcher used a modified questionnaire based on the Likert scale. Meanwhile, to support the hypothesis testing in this study, the empirical models Grahamet.al(2004) and regression test were employed.
The results of these tests showed that the results of the individual education level play an important role at the level of individual investor confidence. If the educational qualifications of these individuals are higher, then the individual feels that they have high competencies so that individual investors will engaged in frequently stock trading transactions. In terms of age, the individual investor at the age of 30-40 years tend to have a high level of competence that have an impact on the frequency of stock trading. In terms of revenue, the results showed that the higher the income level raised by the investors, investor overconfidence tends to be higher, so the investors will often use the stock trading transactions. Thus, the higher the level of competence of investors, investors are increasingly engaged in frequently stock trading transactions.
The current study and the prior study has similarity as follows:
1. Both one of the variable examined in the prior study and the current study is the investor overconfidence.
2. Both of the research data type employed in this prior study and this current study is primary data obtained from modified questionnaire given in the prior study and from experimental materials collected in the current study. 3. One of the aim of this prior study and this current study is similar, that is to
4. The grand theory used in the prior study and the current study is The Excessive Trading Theory.
However, the current study and Abhijeet Chandra’s study hassome differences as follows:
1. The purpose of the current study and the prior study is exactly different. The purpose of the current study is to identify the effect of belief adjustment model and investor overconfidence towards investment decision making by using calibration technique, while the purpose of the prior study is to examine the effect of the competence of individual investors in stock trading. 2. The research method used in the current study is 2x2x2x2 experimental method, that is, the information disclosure pattern (SbS and EoS), the information order (++-- or --++), the type of information (accounting information and non-accounting information) and the investors overconfidence level (overconfidence or non-overconfidence), while the research method employed in the prior study was a survey research method. To support the testing of individual investor’s behavior in this study, the researcher used a modified questionnaire based on the Likert scale.
information and non-accounting information), and the investors overconfidence (overconfidence or non-overconfidence).
4. Participants used in this current study are non-professional investors within criteria such an undergraduate business student who has completed minimal course on financial management and have never invested in the stock market (non-professional investors), while the participants used in this prior study were individual investors from Delhi-NCR zone randomly chosen.
5. The data analysis techniques employed in the current study are Mann-Whitney test, independent sample t-test, descriptive statistics and also uses additional analysis technique to test the overconfidence variable, which is calibration technique to measure the correlation between investors overconfidence level on investment decision making, while the prior study employed calibration technique, the empirical models Graham et.al (2004) and regression test to test the proposed hypothesis.
9. Chenet.al(2007)
This study is aimed to examine the factors in investment decisions making in developing countries, particularly investors in China. It is based on poor stock trading decisions by Chinese investors, the shares they purchased are sold at a price lower than the purchase price. The dependent variable used in this study is the performance of trading, while the independent variables used in this study was the effect of dispositions, overconfidence, and representativeness bias.
research method. To support hypothesis testing in this study, the researchers used a descriptive statistical test, cross-sectional test and regression analysis on the behavior of individual investors based on stock returns database file listed on the China Stock Exchange.
The results of these tests showed results that Chinese investors make the mistake of trading, such as selling shares at a price lower than the purchase price of the shares, the Chinese investors believe that the past performance indicates future performance, undecided recognize a loss on the shares, and tend to overconfidence and biased so the results showed that individual investors in China experienced a higher disposition effect than institutional investors.
The current study and the prior study has similarity as follows:
1. Both one of the variable examined in the prior study and the current study is investor overconfidence.
2. Both of the research data type employed in this prior study and this current study is primary data obtained from modified questionnaire given in the prior study and from experimental materials collected in the current study. 3. One of the aim of this prior study and this current study is similar, that is to
examine the presence of the overconfidence effect.
However, the differences in the prior study and the current study are described as follows:
using calibration technique, while the purpose of the prior study is to examine the factors in investment decisions making in developing countries, particularly investors in China.
2. The research method used in the current study is 2x2x2x2 experimental method, that is, information disclosure pattern (SbS and EoS), the information order (++-- or --++), the type of information (accounting information and non-accounting information) and the investors overconfidence level (overconfidence or non-overconfidence), while the research method employed in the prior study was a survey research method. 3. The dependent variable used in this prior study is the performance of trading, while the independent variables used in this prior study was the effect of dispositions, overconfidence, and representativeness bias, while the dependent variable used in this current study is investment decision making and the independent variables used in the current study are disclosure pattern (SbS and EoS), the information order (++-- or --++), the type of information (accounting information and non-accounting information), and the investors overconfidence level (overconfidence or non-overconfidence).
5. The data analysis techniques employed in the current study are Mann-Whitney test, independent sample t-test, descriptive statistics and also uses additional analysis technique to test the overconfidence variable, which is calibration technique to measure the correlation between investors overconfidence level on investment decision making, while the prior study employed descriptive statistical test, cross-sectional test and regression analysis on the behavior of individual investors based on stock returns database file listed on the China Stock Exchange to support the hypothesis testing.
10. Robert Pinsker (2007)
This study is aimed to examine the effect of disclosure pattern (sequential versus simultaneous) and the direction of information (positive / negative versus negative/positive) in belief revision model of non-professional investors, using long-series information. Research indicates that belief revision individuals tend to pay more attention to the latest information received when such information is presented when the disclosure pattern is step by step rather than simultaneous. Independent variables used in this study is the disclosure pattern that consists of SbS (Step by Step) and EoS (End of Sequence) and the information order that consists of positive-negative and negative- positive.
by using manipulation check, then continued with Parametric t-test and non-parametric Mann-Whitney and Kolmogorov-Smirnov test. The researchers used analysis of covariance (ANCOVA) in hypothesis testing. The test results indicate that individuals revise beliefs to a greater extent when the disclosure pattern is sequential rather than simultaneous. In addition, participants in this study are in the simultaneous conditions appeared to aggregate short series disclosures. The aggregation caused those participants to be less sensitive to the disclosures later in the sequence, which resulted in lower belief revisions compared to those in the sequential conditions.
The current study and the prior study has similarity described as follows:
1. Both of the prior study and the current study is aimed to examine the effect of disclosure pattern (sequential versus simultaneous) and t he direction of information (positive/negative versus negative/positive) in belief revision model of non-professional investors, using long-series information.
2. Both of the research data type employed in this prior study and this current study is primary data obtained from experimental materials given to the participants by using paper and pencil experimental test.
3. Participants used in the prior study and the current study are non-professional investors within criteria such an undergraduate business student who has completed minimal course on financial management and have never invested in the stock market (non-professional investors).
However, the difference of this current study with this prior study is described as follows:
1. The research method used in the current study is 2x2x2x2 experimental method, that is, information disclosure pattern (SbS and EoS), the information order (++-- or --++), the type of information (accounting information and non-accounting information), and the investors overconfidence level (overconfidence or non-overconfidence), while the research method employed in the prior study was a 2x2 experimental method, that consists of SbS (Step by Step) and EoS (End of Sequence) and the information order that consists of positive-negative and negative-positive.
2. The second difference is on the dependent variable examined, which is the dependent variable examined in the prior study was revision of decision taken by investors in determining the value of company stock, while the current study uses investment decision making measured by stock price judgment as the dependent variable.
Kolmogorov-Smirnov test. The researchers used analysis of covariance (ANCOVA) in hypothesis testing.
2.2 Theoretical Review
The related literatures are supporting and becoming the basic to achieve the purpose of this study. This subchapter describes the theory linked to the study about belief adjustment model, such as: the belief adjustment theory, the information order effect and disclosure pattern, the theory of excessive trading on investors overconfidence, and the self-deception theory.
2.2.1 Belief Adjustment Theory
The direction of evidence shall indicate whether the evidence encourages or discourages the individual beliefs. The additional evidence that encourages the belief is called good news or positive evidence (e.g. net income of the company increases than the last period, earnings per share of the company increases than the last period), while the additional evidence that discourages belief is calledbad news ornegative evidence(e.g. net income of the company decreases than the last period, earnings per share of the company decreases than the last period). The second characteristic of additional evidence is its strength or level of evidence that courage or discourage the belief. Type of evidence can be categorized into consistent evidence or mixed evidence. When all additional evidence has the same direction (both positive and negative), it is categorized as the consistent type of evidence, while some evidence is negative and some are positive, it is categorized as mixed evidence. The information presentation models in the belief adjustment theory proposed by Hogarth and Einhorn are a step by step (SbS) and the end of sequence (EoS). The step by step (SbS) is a pattern of information presentation when investors had the transaction based on simple shared information (e.g., financial statements and the quarterly interim non-accounting information obtained from the mass media) and performed in sequence. The end of sequence (EoS) is a pattern of information presentation when investors had the transaction based on complete information and the whole reports obtained at such particular timelines (e.g., complete annual report which does not only contain financial statement).
2.2.2 The Information Order Effect and Disclosure Pattern
receiving evidences in different order. The character of evidence is mixed between positive information and negative information. When the first information in the order has a large effect on the individual belief, then such order effect is called primacy effect. On the other hand, when the last information is the one that gives the largest effect, it is calledrecency effect. The results of prior studies (Ashton and Ashton, 1998; Tubbs et al., 1993) indicate that therecency effectis not found when the acquired evidences give consistent information, both positive information and negative information. Therecency effectoccurs when the evaluated evidences have mixed information that is positive information and negative information.
The phenomena of order effect happen when judging new evidence and the next adjustment is based on insufficient additional evidence. Hogarth and Einhorn (1992) proposed the belief adjustment model that predicts the review when an individual evaluates the complex short serial evidence and mixed evidence. It is called short series evidence when there are maximally 12 items of evidence. It can be concluded that it is called long series evidence when there are more than 17 items of evidence. The complexity is due to the length of evidence item. Mixed evidences consist of both positive and negative items.
reverse effect caused by the gradually presented information can be eliminated by combining the effects of positive and negative evidences that consequently remove the individual effect of positive and negative evidences. In the context of investment decision making, Pinsker (2007) indicates that the sequential disclosure of information will cause greater belief adjustment than the simultaneous one.
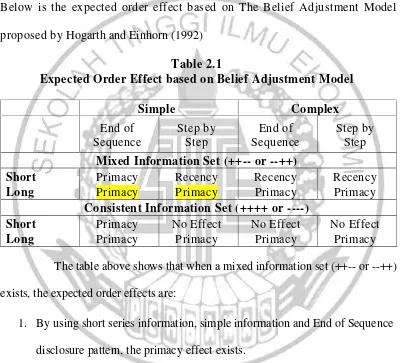
Below is the expected order effect based on The Belief Adjustment Model proposed by Hogarth and Einhorn (1992)
Table 2.1
Expected Order Effect based on Belief Adjustment Model
Simple Complex Mixed Information Set (++-- or --++)
Short Consistent Information Set (++++ or ----)
Short The table above shows that when a mixed information set (++-- or --++) exists, the expected order effects are:
1. By using short series information, simple information and End of Sequence disclosure pattern, the primacy effect exists.
2. By using long series information, simple information and End of Sequence disclosure pattern, the primacy effect exists.
3. By using short series information, simple information and Step by Step disclosure pattern, the recency effect exists.
disclosure pattern, the primacy effect exists.
5. By using short series information, complex information and End of Sequence disclosure pattern, the recency effect exists.
6. By using long series information, complex information and End of Sequence disclosure pattern, the primacy effect exists.
7. By using short series information, complex information and Step by Step disclosure pattern, the recency effect exists.
8. By using long series information, complex information and Step by Step disclosure pattern, the primacy effect exists.
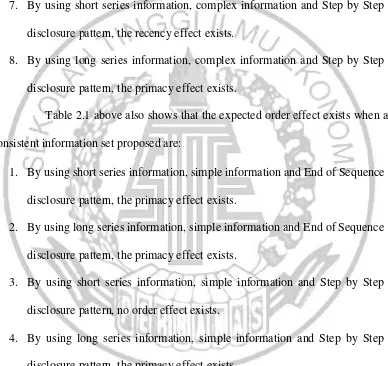
Table 2.1 above also shows that the expected order effect exists when a consistent information set proposed are:
1. By using short series information, simple information and End of Sequence disclosure pattern, the primacy effect exists.
2. By using long series information, simple information and End of Sequence disclosure pattern, the primacy effect exists.
3. By using short series information, simple information and Step by Step disclosure pattern, no order effect exists.
4. By using long series information, simple information and Step by Step disclosure pattern, the primacy effect exists.
5. By using short series information, complex information and End of Sequence disclosure pattern, no order effect exists.
7. By using short series information, complex information and Step by Step disclosure pattern, no order effect exists.
8. By using long series information, complex information and Step by Step disclosure pattern, the primacy effect exists.
2.2.3 Excessive Trading Theory
In the modern financial theory, investors are assumed to be rational in their efforts to identify and process the relevant information for optimal decisions. But in recent years, emerged a variety of empirical evidence showing the existence of investor behavior that deviates from these predictions. The excessive trading theory can explain overconfidence behavior, that is the most common characteristics found in humans
that reflect one's tendency to overestimate the ability, the chances for success and the
probability that someone will gain positive outcomes and the accuracy of the
knowledge possessed (Cheng, 2007). Overconfidence is a key concept to
understand why investment strategies are so actively pursued and trading is
excessive. According to Klayman et al. (1999) and Kufepaksi (2007), a person’s
overconfidence level can be identified through calibration test of confidence level.
Calibration test is a procedure to test and identify the combination of the
level of knowledge and level of confidence that shape one's level of overconfidence
based on a specific questionnaire designed specifically for these purposes.
Overconfidence level is measured by overconfidence score that is the average
probability confidence level minus average percentage of the value of correct
answer. If the average probability of confidence is lower than average proportion
that reflect the non-overconfidence behavior. Conversely, if the average confidence
probability is higher than average proportion of correct answer in the assessment,
this situation will produce a positive value of overconfidence.
The theory of excessive trading argues that overconfidence behavior will lead to the tendency of investors to practice aggressive and excessive trading strategies (e.g. high trading volume and/or high trading frequency). Ultimately, it will lead to poor investment performance. The research done by Benos (1998) using
the auction market research, concludes that overestimating the accuracy of the
information will lead to increase trading volume of investors. Gervais and Odean
(2001) also find that the increase in trading volume and volatility will lead to less and even negative investor’s earning. The average behavior of overconfidence in financial markets may cause harmful effects, but in some cases it may generate returns in excess of rational investors.
2.2.4 Self-Deception Theory
Self-Deception Theory is based on the argument that when a person behaves overconfidence and get the feedback then he will know the errors he had made. Specifically, when the persons know the results of his prediction and the default prediction then he will realize that he has been stuck in a self-confidence-building that is inappropriate. In this case, the individuals will realize that he has done self-deception by giving over assessment on the accuracy level of his possessed knowledge exceeds the level of actual knowledge, thus he tends to give a high probability of judgment, and it can be proven by the relatively high prediction deviation from the default mean predicted. Thus, it can be concluded that overconfidence behavior may be caused by the belief of high overconfidence investors that they have ability or more experience and specialized knowledge or more knowledge in the field of stock market investments.
2.3 Theoretical Framework
This research is aimed to examine the belief adjustment model proposed by Hogarth and Einhorn (1992) by examining the effect of disclosure pattern (sequential versus simultaneous) and direction of information (positive/negative versus negative/positive) in belief revision model of non-professional investors. The belief adjustment model includes three types of disclosure pattern, that is Step by Step, End of Sequence, and self-review debiaser. This research is focused on the Step by Step and the End of Sequence information disclosure pattern.
++-- (good news followed by bad news) or --++ (bad news followed by good news), the type of information is accounting information and non-accounting information, and investors overconfidence level. The research uses long series information, simple information and the step by step (SbS) disclosure pattern will result in the primacy effect, that is the first information received in order has the greatest effect on individual belief, while the research employs long series information, simple information and the end of sequence (EoS) disclosure pattern will result in the primacy effectalso (Hogarth and Einhorn, 1992).
Non-professional investor from undergraduate business student (accounting undergraduate student and management undergraduate student) within some criterias is the main object analyzed in this research. According to the previous study and theoretical basic above, in this study, there will be step done by the researcher. First, those non-professional investors are analyzed by using calibration technique to measure the level of investor overconfidence towards investment decision making.Overconfidence level is measured by overconfidence score that is the average probability confidence level minus average percentage of
the value of correct answer. If the average probability of confidence is lower than
average proportion of correct answer in the assessment, this situation will produce
a negative value that reflect the non-overconfidence behavior. Conversely, if the
average confidence probability is higher than average proportion of correct
answer in the assessment, this situation will produce a positive value of
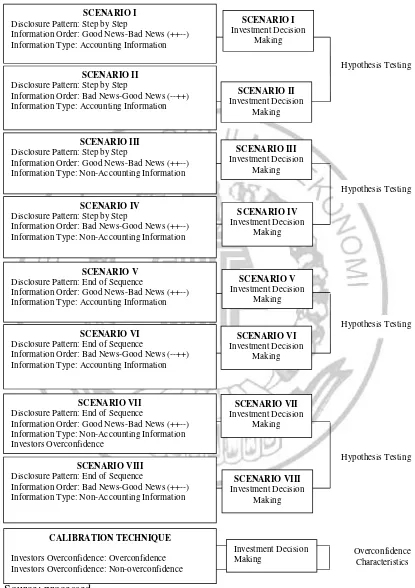
Graphically, the theoretical framework is shown as below:
Source: processed
Figure 2.1 Theoretical Framework SCENARIO I
Disclosure Pattern: Step by Step
Information Order: Good News-Bad News (++--) Information Type: Accounting Information
SCENARIO II
Disclosure Pattern: Step by Step
Information Order: Bad News-Good News (--++) Information Type: Accounting Information
SCENARIO III
Disclosure Pattern: Step by Step
Information Order: Good News-Bad News (++--) Information Type: Non-Accounting Information
SCENARIO IV
Disclosure Pattern: Step by Step
Information Order: Bad News-Good News (++--) Information Type: Non-Accounting Information
SCENARIO V
Disclosure Pattern: End of Sequence
Information Order: Good News-Bad News (++--) Information Type: Accounting Information
SCENARIO VI
Disclosure Pattern: End of Sequence
Information Order: Bad News-Good News (--++) Information Type: Accounting Information
SCENARIO VII
Disclosure Pattern: End of Sequence
Information Order: Good News-Bad News (++--) Information Type: Non-Accounting Information Investors Overconfidence
SCENARIO VIII
Disclosure Pattern: End of Sequence
In the first scenario the participants are predicted to give a higher proportion to the first information received at the beginning, that is, good news followed by bad news in Step by Step (SbS) disclosure pattern and accounting information type. Thus, the first information in the order has a large effect on the individual belief, then such order effect is called primacy effect. While the participants in the second scenario tend to give a greater proportion to the information received at the beginning, that is bad news followed by good news in Step by Step (SbS) disclosure pattern and accounting information type, thus in the second scenario the participants have a large effect obtained from the first information in the order, then such order effect is calledprimacy effect.
In the third scenario the participants are predicted to give a greater proportion to the first information received at the beginning, that is, good news followed by bad news in Step by Step (SbS) disclosure pattern and non-accounting information type. Thus, the first information in the order has a large effect on the individual belief, then such order effect is called primacy effect. While the participants in the fourth scenario tend to give a higher proportion to the information received at the beginning, that is bad news followed by good news in Step by Step (SbS) disclosure pattern and non-accounting information type, thus in the fourth scenario the participants have a large effect obtained from the first information in the order, then such order effect is calledprimacy effect.
information type. Thus, the first information in the order has a large effect on the individual belief, then such order effect is called primacy effect. While the participants in the sixth scenario tend to give a greater proportion to the information received at the beginning, that is bad news followed by good news in End of Sequence (EoS) disclosure pattern and accounting information type, thus in the sixth scenario the participants have a large effect obtained from the first information in the order, then such order effect is calledprimacy effect.
In the seventh scenario the participants are predicted to give a greater proportion to the first information received at the beginning, that is, good news followed by bad news in End of Sequence (EoS) disclosure pattern and non-accounting information type. Thus, the first information in the order has a large effect on the individual belief, then such order effect is calledprimacy effect. While the participants in the eight scenario tend to give a higher proportion to the information received at the beginning, that is bad news followed by good news in End of Sequence (EoS) disclosure pattern and non-accounting information type, thus in the eight scenario the participants have a large effect obtained from the first information in the order, then such order effect is calledprimacy effect.
to the majority results. Meanwhile, if the results show that a half of participants are overconfidence and non-overconfidence (50:50), then the differential test will be conducted to the entire results.
2.4 Research Hypothesis
The previous theoretical framework describes that this study is aimed to identify the effect of belief adjustment model and investor overconfidence towards investment decision making. Issues related to the information disclosure pattern (SbS or EoS) which may affect investment decision making as described in the previous theoretical framework is supported by the result of prior studies which have shown greater belief revisions for sequentially disclosed information than for simultaneous disclosures (Hogarth and Einhorn,1992).
Research conducted by Luciana Spica and Supriyadi (2013) showed that therecency effectwould occur if the disclosure pattern used is step by step (SbS). The results also indicate that one of the methods that can be used to eliminate the order effect, especially therecency effect is the end of sequence (EoS) disclosure pattern. When investors receive evidence simultaneously (EoS) either with a sequence pattern good news followed by bad news (++--) or bad news followed by good news (--++), then the investor will provide more objective assessment. It is because investors make a comprehensive assessment on all information received both positive and negative information
mentioned that theprimacy effectwill occur when the participants were presented with a long series of information both in Step by Step or End of Sequence disclosure pattern. In sum, the literature in multiple contexts predicts and finds evidence of order effect in long series tasks with both sequential and simultaneous response modes. Thus, to be conservative and in order to examine the existence of order effect and information disclosure pattern on investment decision making, the above discussion is the basis for the following hypotheses:
H1 : There is a different judgment between the investor who receives good news followed by bad news (++--) and the one who receives bad news followed by good news (--++) information order in the step by step disclosure pattern on accounting information type.
H2 : There is a different judgment between the investor who receives good news followed by bad news (++--) and the one who receives bad news followed by good news (--++) information order in the step by step disclosure pattern on non-accounting information type.
larger or smaller in the sequential condition. It also concludes that when information orders are received simultaneously (End of Sequence), the recency effect has no impact for investment decision making process. Pinker’s study has been done to examine the order effect and information disclosure pattern to find the reason why therecency effectoccurs at the step by step disclosure pattern only.
In examining the step by step (SbS) and end of sequence (EoS) disclosure pattern, there are two possible effects that would occur. The first is the recency effectwhich is the last information received will be considered in decision making. The second is the primacy effect, which is the first information received will be given greater proportion and considered in decision making. This is due to limited individual's ability to process the information received. Hogarth and Einhorn (1992) predicted the primacy effect will occur in the test of mixed information series (++-- or --++ information order) with a long series of information, both in simple and complex information, as well as End of Sequence and Step by Step disclosure pattern. Thus, in a long series information both on simple and complex information, and Step by Step and End of Sequence disclosure pattern, the individual will give a higher proportion and consideration to the first information they receive.
concluded that there is a greater belief revision when the disclosure pattern is sequentially compared to simultaneously disclosure pattern.
Research conducted by Pinsker (2011) was done by adding the amount of provided information, it showed that therecency effectoccur in the sequentially disclosure pattern compared to the simultaneously disclosure pattern on long series information. This is caused by the fact that participants were more sensitive to the latest information presented. However, it also applies if the disclosure pattern is simultaneously, therecency effect will also occurred.
In sum, there is inconsistency in the literature in multiple contexts which predicts and finds evidence of order effects in long series tasks with both sequential and simultaneous response modes. Thus, to be conservative and in order to examine the existence of order effect and information disclosure pattern on investment decision making, the above discussion is the basis for the following hypotheses: H3 : There is a different judgment between the investor who receives good
news followed by bad news (++--) and the one who receives bad news followed by good news (--++) information order in the end of sequence disclosure pattern on accounting information type.