THIS REPORT CONTAINS ASSESSMENTS OF COMMODITY AND TRADE ISSUES MADE BY USDA STAFF AND NOT NECESSARILY STATEMENTS OF OFFICIAL U.S. GOVERNMENT POLICY
Bulgaria’s dairy industry was challenged in 2016 by the outbreak of lumpy skin disease in April 2016, followed by subsequent reductions in its dairy herd, milk production, and import
restrictions implemented by trading partners. Favorable milk prices encouraged the dairy industry’s modernization efforts and milk deliveries improved, although on-farm milk output declined. Data for the first eight months of 2017 indicate milk deliveries grew by 12 percent. Small and unprofitable dairy farmers continued to switch to raising beef and/or sheep, while larger dairies expanded, increased their inventories, and invested in improved genetics.
Post expects that herd sizes and milk stocks will expand in 2017 due to the more stable epizootic situation, higher milk yields, and favorable milk prices. Concentration and commercialization will likely further decrease the number of subsistence farms. Changes in domestic support programs through 2020 seek to boost the competitiveness of the local dairy industry.
General Information:
Dairy Farms and Dairy Cow Inventory
In 2016, Bulgaria’s dairy herd continued to shrink as a result of the lumpy skin disease (LSD) outbreak and the reorganization of the dairy industry following the abolishment of EU milk quotas. The decline in inventory was more pronounced at smaller farms, while larger farms grew and increasingly invested in productivity, technology, genetics, and herd management. In 2016, milk collections (deliveries) and processing rebounded following years of decline.
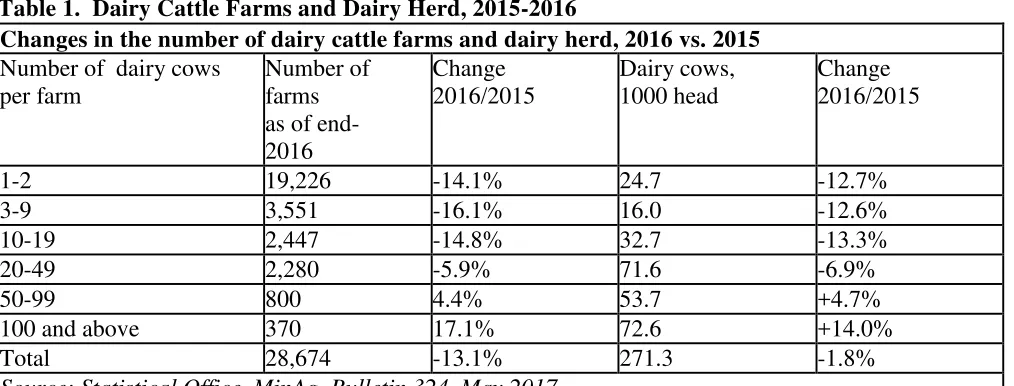
The number of dairy farms declined by 13 percent to 28,700 and the total cow inventory decreased by 1.8 percent. The reduction was concentrated in smaller farms with 20 cows or less (Table 1). At the end of 2016, the number of small subsistence farms-with only one or two cows-decreased by 14 percent from 2015. While small subsistance farms still accounted for 67 percent of all Bulgarian dairy farms (Graph 1), they raised only nine percent of the total dairy herd. Many small farmers have switched to beef, sheep, or goat production. In 2016 the growth in the beef herd increased by 12 percent to reach 86,000 head, although many of these beef cattle were dairy cows registered as “for meat”. Other small farmers make efforts to register under direct sales regulation (Ordinance 26) to have better access to the market.
Graph 1: Distribution of Dairy Farms in Size, 2016
Source: Bulgarian Ministry of Agriculture, Foods and Forests Statistical Bulletins
Graph 2: Distribution of Dairy Farms in Size,
2016
Source: Bulgarian Ministry of Agriculture, Foods and Forests Statistical Bulletins
Graph 3: Dairy Farms and Dairy Cow Inventory Development, 2009-2016
Sourc e: Bulgarian Ministry of Agriculture, Foods and Forests Statistical Bulletins
Post expects that the dairy-cow inventory will recover in 2017, due to a more stable epizootic situation, affordable feed costs, attractive milk prices, and domestic subsidies. Milk productivity has the potential to grow, especially at commercial farms.
Fluid Milk Production
Total 2016 fluid milk production decreased marginally (0.3 percent), with a small, year-on-year 0.9-percent decline in cow milk, and higher production of other types of milk (Table 2 and Graph 4). The decrease in cow-milk production resulted from decreased inventories (-1.8 percent) and lower growth in average milk yields, mainly due to the LSD outbreak, which reduced productivity. Moreover, milk productivity was negatively affected by the hot and dry summer. As a result, milk yields were unable to make up for the lower number of dairy cows.
Post expects that in 2017, total milk production will stabilize to about 1.0 million metric tons and continue to grow slowly through next year. The dairy cow inventory and milk yields are also expected to increase. Milk deliveries data for January-August 2017 (source: Eurostat) shows that cow milk deliveries increased by 12 percent over the corresponding period in 2016, which confirms trade sources’ reports about rebounding milk-production levels.
Graph 4: Dairy Cow Inventory and Milk Production, 2007-2016
Source: Bulgarian Ministry of Agriculture, Foods and Forests Statistical Bulletins
Milk Deliveries: Over the last decade, the dairy industry’s biggest challenge has been the steep decline in milk deliveries for processing (Table 3 and 4, Graph 5). However, the expiration of the EU milk quality derogation increased milk-quality consistency and reduced the number of small farms, which led to greater efficiencies in milk collection and reduced costs. Bulgaria continues to lack in any
meaningful dairy farm co-ops.
investments in the dairy sector, 2016 deliveries also grew by 3.9 percent (Note: Eurostat reports higher growth of 7.6 percent, which is higher than Bulgarian MinAg data of 610,000 MT vs 560,000 MT). The same trend was observed for cow milk deliveries alone with growth rates of 2.7 percent in 2015 and 3.1 percent in 2016. The main reasons were better prices driven by stronger demand for processing,
industry consolidation, more commercial farms, ongoing investments of processing units in dairy, as well as EU domestic support programs.
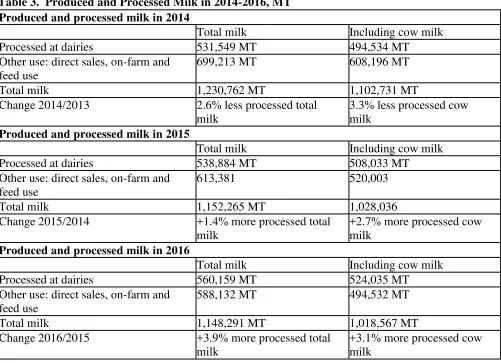
Another positive trend was the expansion of cow milk deliveries over direct sales (Table 3). For many years, milk deliveries were less than half of production and direct sales were dominating for a number of reasons such as milk quality, underreported sales, grey market etc. In 2016, the share of cow milk deliveries in total cow milk production grew to 51 percent compared to 49 percent in 2015 and is expected that this trend will be sustained in the future. Data for January-August 2017 shows that cow milk deliveries were at 409,000 MT, 12 percent more compared to 2016.
Milk Cost and Prices: Prices for cow milk (see average monthly prices here) in 2016 varied between 246.0 Euro/MT (June) and 306.6 Euro/MT (December). January-August 2017 prices averaged higher and varied between 289.8 Euro/MT (June) to 309.5 Euro (February). As of September 2017, the price was 303.9 Euro/MT, below the EU average of 358.20 Euro/MT and below EU-12 average of 321.9 Euro/MT. Most farmers report prices of about 350 Euro/MT for standard-quality milk and confirm 40 percent higher prices over 2016.
Overall, Bulgarian cow milk prices range around the middle of the EU-average. This stimulates higher imports of raw milk from neighboring Member States with lower prices such as Romania, Hungary, Slovakia, Slovenia, and Poland. High Greek milk prices incentive some Bulgarian exports of fluid cow milk to Greece.
Feed accounted for about 70 percent of production costs. In 2016 and 2017, feed grains and compound feed formulas were less expensive than 2015. Summer pasturing conditions in 2017 improved over 2016 due to better rainfall, despite heat waves throughout the summer months.
Milk for Direct Sales: Milk for direct sale and on-farm consumption has declined since 2014 (Table 3). In 2016 cow milk for direct sales declined by five percent and dipped below 50 percent of share of total cow milk sales for the first time. This trend is directly related to the accelerated commercialization of
Graph 5: Cow Milk Production and Deliveries, 2009-2016
Source: Bulgarian Ministry of Agriculture, Foods and Forests Statistical Bulletins
Factory Use/Milk Processing
The total output of processed dairy products in 2016 grew slightly and in parallel with higher milk deliveries and imports of milk. Production levels for processed dairy products grew beyond 250,000 MT and reached 278,000 MT in 2015/2016 (Graph 6). In 2016, the industry consisted of 213 dairy processors. Despite insufficient milk supplies, strong consumer demand incentivized imports of price-competitive fluid milk and milk substitutes to fill demand gaps.
Cow milk accounted for 94 percent of all factory use, followed by sheep milk at four percent, goat milk at two percent and buffalo milk at 0.5 percent (Tables 3 and 4). Quantities of processed non-cow milk increased by 17 percent in 2016 over the previous year, with goat milk leading with 29 percent annual growth.
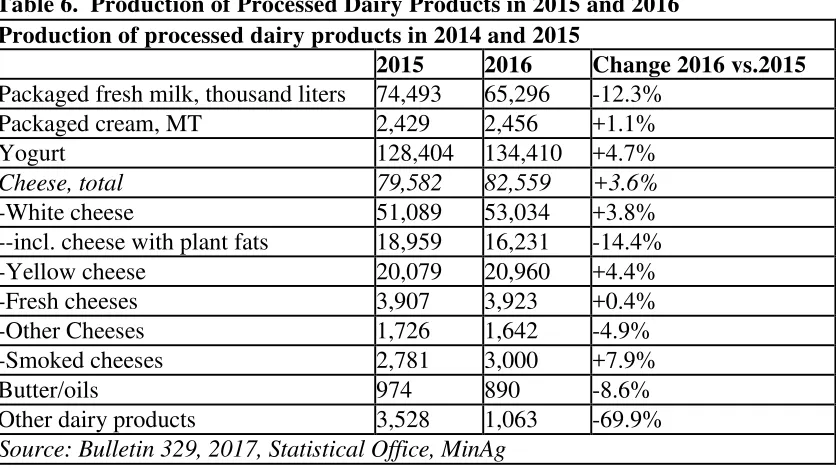
2016 production of most processed dairy products increased slightly over 2015, with the most robust growth being yogurt (+4.7 percent) and cheese (+3.6 percent). Production of liquid milk for household consumption was the big exception and declined by 12.3 percent. For a second consecutive year, production of cheese with plant/vegetable oils (usually palm oil) declined by 14.4 percent. This was due to massive industry and consumer campaigns against those products, various restrictions, and lower sales due to higher disposable incomes among consumers (Table 6). Early data for January-August 2017 indicate that dairy production continues to grow, with an 18 percent increase in cheese production and a 10-percent increase in yogurt production over the corresponding period in 2016.
Graph 6: Processed Dairy Products Production, 2009-2016
Source: Bulgarian Ministry of Agriculture, Foods and Forests Statistical Bulletins
Consumption
Average dairy-product consumption in 2016 reached 63.3 kg per capita, a slight increase over 2015’s 63.8 kg/capita (less than a percent). As noted above, household liquid milk consumption continued to decline (Graph 7), while yogurt consumption increased by 6.6 percent. White cheese consumption grew by less than one percent and yellow cheese consumption was steady. This data, however, does not include the food service sector which accounts for an increasingly larger share in consumption and is a main driver for higher dairy production and consumption.
Yogurt Consumption: Market studies indicate that commercially-produced yogurt has achieved 95-percent market share, while homemade yogurt accounts for below five 95-percent. Another trend is more favorable preferences for higher-fat yogurts (four percent+). The most popular yogurts have 3.0 - 3.9 percent fat content and are purchased by over 80 percent of Bulgarian households.
In 2017, six larger yogurt manufacturers initiated a push to change local yogurt standards, with the goal of introducing new packaging materials. Current standard allows only three types of packaging material
request by the industry and has refused to amend its current standards.
Graph 7: Yogurt and Drinking Milk Consumption Per Capita, 2000-2016
Source: National Statistical Institute
Cheese Consumption: Local cheese dominates the market with 98 percent of supply. White and yellow cheeses are the two major local cheese categories, although there is a growing demand for more diverse and higher-quality cheeses. About 45 dairy manufacturers produce cheese under a voluntary industry standard which is considered to be a mark for highest quality. Production of cheaper cheeses which use vegetal fats, mainly palm oil, decreased by 14 percent in 2016 although this category still accounted for about one third of total cheese production. Packaged cheese sales have grown versus bulk cheese, and are reported to account for 35 percent of total sales. Branded cheeses also register higher sales over non-branded products.
Source: National Statistical Institute
Butter Consumption: Market studies show that the butter market is growing in both volume and value terms. About 76 percent of Bulgarian households buy butter. The butter market is dominated by imported products, which account for over half of market share, due to limited local production, which remains under 1,000 MT. Branded products purchases have grown while private-label sales have fallen from 15 to 10 percent of market share. In mid-2017 the butter prices began to escalate and by October the prices were 50 percent higher than one year ago.
Butter was also a focus of consumer groups, one of which tested 10 local butter brands, sold mainly on HORECA outlets. According to this group, three of the brands contained non-dairy fats which were not properly indicated on the label. The content of the non-dairy fats varied from 40 to 60 percent. Some products had higher-than-allowable water content and some had lower fat content than indicated on the label.
Trade
Strong local consumer demand, short stocks of good quality and price-competitive milk for processing, as well as lower milk prices in other Member States stimulated higher imports in 2016. Imports of dairy products (HS#0401-0406) (volume) increased to 150,000 MT or 15.4 percent more than in 2015. Imports consisted of mainly fresh milk for processing (43 percent of total imports), as well as milk substitutes such as NFDM and WHM and whey (35 percent of total imports) or combined 78 percent of total dairy imports. The most considerable was the increase for fresh (non-concentrated) milk imports by 56 percent to 65,000 MT, and cheeses by 11 percent to 24,500 MT (Graph 9).
Dairy exports in 2016 declined by 7.4 percent to 45,000 MT. Cheeses accounted for the largest share of exports at 56 percent (Graph 10), followed by fresh milk and yogurt, at 17 percent each.
Graphs 9 and 10: Dairy Imports and Exports Structure, 2016
market. The main suppliers were the same EU countries.
In 2016, exports of fluid milk decreased to more historic levels following a 41-percent decline to 7,700 MT from unusually high level of exports in 2015. Major destinations included Greece and Romania. During January-July 2017, exports continued to decline more considerably by 51 percent to 3,000 MT, also to Greece and Romania.
Non-fat Dried Milk: Imports in 2016 increased by four percent to 17,000 MT. The trend continued into 2017 through July with 22-percent growth reaching 11,000 MT. Poland, Germany, The Netherlands and Romania are the major suppliers.
Whole Milk Powder: Import-volumes for 2016 were lower at 7,100 MT, a 25-percent reduction from 2015. Through July 2017, imports jumped by 93 percent, sourced mainly from Romania.
Butter: Combined imported volume in 2016 continued to grow and reached 8,457 BET (butter in milk equivalent), a1.7-percent increase over 2015. Countries of origin were mainly Germany, Poland, and the Netherlands. January-July 2017 imports, however, declined by 13 percent to 4,400 BET due to lower availability on the EU market and higher prices. Exports in 2016 increased by 44 percent but remained under 1,000 MT. In 2017 (until July) exports have continued to slide by 25 percent due to favorable local demand.
Cheese: Combined imports in 2016 were at 14,400 MT (PSD Cheese, WTA) or only 1.3 percent more year-over-year. In 2017 until July imports had a considerable drop of 16 percent to 7,200 MT.
Imported cheeses are sourced mainly from the Netherlands, Germany, and Poland. In 2017 (January-July), all exporters to the Bulgarian market reduced cheese deliveries.
Cheese remains a major export product of Bulgaria. Export volume in 2016 totaled 20,900 MT, an increase of 2.2 percent over 2015. Primary export markets include Greece, Romania, Germany, and the United States. Recent data through July 2017 shows exports have stagnated at 12,000 MT, with Greece and Romania being the two main markets (Graph 11). Bulgaria has generally maintained a trade surplus in cheese ($36 million in 2015 and $31 million in 2016), however, the balance has narrowed in recent years. During January-July 2017, Bulgaria’s positive trade balance in cheese declined by eight percent over the corresponding period last year, at $19 million in value.
Graph 11: HS#0406 Cheese Trade, Imports and Exports, 2007-2016
Sourc e: World Trade Atlas
Agricultural Policy
Animal Health: The LSD outbreak was the biggest challenge for the dairy industry and authorities in 2016 (GAIN BU1633). There were 217 LSD detections and 2,800 culled cows between
April-September. Over 55 percent of detections occurred on small farms (under 10 cows). In October 2016, MinAg introduced de minimis assistance for farmers affected by LSD.
Animal Breeding and Selection: In an effort to improve its breeding and selection, MinAg’s Agency for Animal Selection and Breeding established a National Genetics Lab under a Bulgarian-Swiss project. The lab will conduct DNA analysis to establish breed standards to facilitate the Breeding Associations work. Genetic maps of national breeds will also be developed.
School Milk Program: The school milk program for 2017/18 is budgeted for 7.6 million leva ($4.8 million). In 2017, about 500,000 children from 3,349 schools will benefit from the program. The program includes a daily allowance of 250 ml of milk, 200 grams of yogurt, 200 grams dairy products with added fruit, and 30 grams of cheese.
Domestic Support: Bulgaria is an advocate for various dairy supports. Current coupled-support
subsidies are at the maximum allowable level and will be maintained through 2020 (232 million leva, or $132 million). Half of these funds support dairy and livestock farms. In mid-2016 MinAg analyzed the effects of the coupled-support programs and adopted significant changes to introduce more control over milk sales (requirement for justification of milk sales with sales documents) and curb the gray-market sales. In 2017 farmers report increased administrative problems and complex regulations related to the coupled support, and appealed for simplification of implementing regulations. See GAIN BU1633 for details about the coupled support programs.
In August 2017, MinAg issued a regulation on the distribution of emergency aid under EC Delegated Regulation 2016/1613 for dairy and livestock farmers (OB, L 242/09.09.2016) at 11.3 million leva ($7.1 million). Funds will be allocated as follows: for small cattle farms at 23.17 leva/head ($14.5); for cattle farms applying environmentally friendly production methods - from 23.17 leva/head ($14.5) to 115.85 leva/head ($72) depending on the number of animals at the farm; for cattle farms applying extensive production methods - from 23.17 leva/head ($14.5) to 69.5 leva/head ($43.4) depending on the number of animals at the farm. Total 398,000 cattle and buffalos raised at about 18,000 farms will benefit from this program.
In September 2017, cattle farms were approved to benefit from de minimis program under EC
Regulation 1408/2013 with a budget of 7.6 million leva ($4.7 million). The program applies for dairy farmers with minimum 10 dairy cows at a rate of 7 leva/head ($4.4/head); and for sheep farmers with minimum 50 ewes at a rate of 3.7 leva/head ($2.3/head).
In October 2016, 304 dairy farmers applied for the EU program for reduction of milk production under
country’s allocation of $3.3 million. The approved amount was 5,369 MT of milk at a rate of $0.08/liter. Farmers had to reduce their milk output with at least 1,500 kg.
Appendix:
Table 1. Dairy Cattle Farms and Dairy Herd, 2015-2016
Changes in the number of dairy cattle farms and dairy herd, 2016 vs. 2015 Number of dairy cows
Table 2. Milk Production, 2008-2016, MT
Table 3. Produced and Processed Milk in 2014-2016, MT Produced and processed milk in 2014
Total milk Including cow milk
Processed at dairies 531,549 MT 494,534 MT
Other use: direct sales, on-farm and feed use
699,213 MT 608,196 MT
Total milk 1,230,762 MT 1,102,731 MT
Change 2014/2013 2.6% less processed total milk
3.3% less processed cow milk
Produced and processed milk in 2015
Total milk Including cow milk
Processed at dairies 538,884 MT 508,033 MT
Other use: direct sales, on-farm and feed use
613,381 520,003
Total milk 1,152,265 MT 1,028,036
Change 2015/2014 +1.4% more processed total milk
+2.7% more processed cow milk
Produced and processed milk in 2016
Total milk Including cow milk
Processed at dairies 560,159 MT 524,035 MT
Other use: direct sales, on-farm and feed use
588,132 MT 494,532 MT
Total milk 1,148,291 MT 1,018,567 MT
Change 2016/2015 +3.9% more processed total milk
Source: Statistical Office, MinAg
Table 4. Milk Production and Processing, 2014-2016 Production and processing on milk, 2014-2016 Type of Source: Bulletin 329, June 2017, Statistical Office, MinAg
Table 5. Quality of Milk in 2016
Fat Content, Percent Protein Content, Percent
Cow milk 3.67% 3.28%
Sheep milk 6.69% 5.12%
Goat milk 3.53% 3.10%
Buffalo milk 7.24% 4.14%
Source: MinAg Bulletin #329, June 2017
Table 6. Production of Processed Dairy Products in 2015 and 2016 Production of processed dairy products in 2014 and 2015
2015 2016 Change 2016 vs.2015
Packaged fresh milk, thousand liters 74,493 65,296 -12.3% Packaged cream, MT 2,429 2,456 +1.1%
Yogurt 128,404 134,410 +4.7%
Cheese, total 79,582 82,559 +3.6%
-White cheese 51,089 53,034 +3.8%
--incl. cheese with plant fats 18,959 16,231 -14.4% -Yellow cheese 20,079 20,960 +4.4% Source: Bulletin 329, 2017, Statistical Office, MinAg