i
DEVELOPING 7TH GRADE STUDENTS’
INFORMAL INFERENTIAL REASONING
I Gusti Ayu Russasmita Sri Padmi
137785076
STATE UNIVERSITY OF SURABAYA
POSTGRADUATE PROGRAMME
MATHEMATICS EDUCATION
DEVELOPING 7THGRADE STUDENTS’ INFORMAL INFERENTIAL
REASONING
MASTER THESIS
A Thesis submitted to
Surabaya State University Postgraduate Program
as a Partial Fulfillment of the Requirement for the Degree of
Master of Science in Mathematics Education Program
I Gusti Ayu Russasmita Sri Padmi
NIM 13775076
SURABAYA STATE UNIVERSITY
POSTGRADUATE PROGRAM
MATHEMATICS EDUCATION PROGRAM STUDY
This two-year worth of work is a tribute to all the hoes who did it.
“o eo e o e told e the defi itio of hell: it’s your last day on earth and the person you become, meet the person you could have e o e.
ABSTRACT
Sri Padmi, I G. A. R. 2015. Developing 7th Grade Students’ Informal Inferential Reasoning. Thesis, Mathematics Education Study Program, Postgraduate Program of Surabaya State University. Supervisors: (I) Agung Lukito, M.S., and (II) Prof. Dr. Siti M. Amin, M.Pd.
Keywords: Informal Inferential Reasoning, Realistic Mathematics Education (RME), Pendidikan Matematika Realistik Indonesia (PMRI), Design Research.
Inferential statistics has been proven to be a hard concept for students to understand. On the other hand, as the future citizen of modern society, statistics becomes important for the students to deal with data-laden information they encounter on daily basis. Informal Inferential Reasoning is a current topic in international statistics education proposed to bridge these two problems. The present study is focused on developing 7th grade students’ informal inferential reasoning in Indonesia. It is based on Realistic Mathematics Education (RME) also known as Pendidikan Matematika Realistik Indonesia (PMRI). The goal is to contribute to instructional materials in developing IIR as well as accompanying theory on how this material works. The research question of this study is, how can 7th grade students be supported to develop IIR? We used design research as the methodology. We conducted two cycles of teaching experiments whose subjects were the 7th grade the students and one teacher in Laboratory Secondary School of State University of Surabaya. The first cycle consisted of 6 students, while the second cycle consisted of 27 students and one teacher. The data were collected through video recordings
of the teaching experiment and students’ written works.
The data then analyzed by comparing and contrasting the Hypothetical Learning Trajectory to the Actual Learning Trajectory. As the result of the analysis, six lessons on developing IIR were designed; (1) Scout staff; (2) Comparing the Dots; (3) Are girls taller than boys?; and (4) Social Media Addiction.
ABSTRAK
Sri Padmi, I G. A. R. 2015. Developing 7th Grade Students’ Informal Inferential Reasoning. Thesis, Mathematics Education Study Program, Postgraduate Program of Surabaya State University. Supervisors: (I) Dr. Agung Lukito, M.S., and (II) Prof. Dr. Siti M. Amin, M.Pd.
Kata Kunci: Informal Inferential Reasoning, Realistic Mathematics Education (RME), Pendidikan Matematika Realistik Indonesia (PMRI), Design Research.
PREFACE
Om Swastyastu,
My utmost gratitude I deliver to Brahman, the Source of Light and the Magnificent Creator, without whom none of these; the ability to explore the world, the opportunities to meet new people, and the chance to challenge myself academically, would ever happened to my silly little self.
Om Avignam Astu Namo Siddham, Om Siddhirastu Tat Astu Svaha.
All of us strive for perfection but none of us would ever come close to. I tempted to do best, but I realize there are still so many shortcomings that come along with this thesis. Suggestions and constructive criticism will be very much appreciated.
A lot of people are behind this two year-worth of work. Therefore, my highest appreciation and a bunch of thanks also goes to:
1. Prof. Dr. Siti M. Amin, M.Pd. and Dr. Agung Lukito, M.S; my supervisors in State University of Surabaya.
2. Monica Wijers and Dolly van Eerde, my supervisors in Utrecht University. 3. Dr. Agung Lukito. MS. and Maarten Dolk as the coordinator of the International
Master Program on Mathematics Education (IMPoME) in State University of Surabaya and Utrecht University.
5. All the lecturers and staff of Postgraduate Program, State University of Surabaya.
6. All the lecturers and Staff of Freudhental Institute, Utrecht University. Especially Mark Uwland, without whom we would never survive our first month in the freezing wind of Netherlands.
7. Dikti and Nuffic Neso for the financial support.
8. Ira Dwi Agustina, S.Pd., 7th grade mathematics teacher of Laboratory Secondary School of State University of Surabaya.
9. Aan Hendroanto; the cameraman, the consultant, the observer, and the merciless critic behind this study.
10.All the teachers, the students, and staff of Laboratory Secondary School of State University of Surabaya.
11.My parents and my little sisters.
12.Yosep Dwi Kristanto, my favorite person. It is an honor to be a part of your life. 13.The students of Batch V IMPoME and BIMPoME.
Finally, I pray for the blessings of the Lord upon us, and for this thesis to fulfill its purpose.
Om Santi Santi Santi Om
Surabaya, June 2015
LIST OF CONTENTS
COVER ... ii
APPROVAL OF SUPERVISORS ... iii
APPROVAL ... iv
CHAPTER I INTRODUCTION ... 1
1.1 Research Background ... 1
1.2 Research question ... 4
1.3 Research Aim ... 4
1.4 Criteria of the study ... 4
1.5 Definition of some key terms ... 5
1.6 Significance of study ... 6
CHAPTER II THEORETICAL FRAMEWORK ... 7
2.1 Statistical Literacy ... 7
2.2 Informal Inferential Reasoning ... 10
2.3 Example of informal inferential reasoning ... 13
2.4 The importance of Informal Inferential Reasoning ... 14
2.4.1 Students’ difficulty in learning formal inferential statistics ... 14
2.4.2 Supporting statistical literacy ... 16
2.4.3 The need for innovation ... 17
2.5 Developing informal inferential reasoning... 18
2.5.1 Sample and population ... 18
2.5.2 The use of context ... 20
2.5.3 Dot plots ... 20
2.5.4 Vocabulary ... 21
2.7 The Role of Teacher ... 27
2.7.1 Decision maker related to the mathematical contents and tasks ... 27
2.7.2 Setting up the context and classroom environment ... 28
2.7.3 Establishing social norms and sociomathematical norms ... 29
2.7.4 Tending the mathematical vocabulary ... 30
2.8 Statistics in Mathematics Curriculum in Indonesia ... 31
2.9 The pre-HLT ... 33
CHAPTER III RESEARCH METHODS ... 39
3.1 Research approach ... 39
3.1.1 Preparations and design phase ... 40
3.1.2 Teaching experiment ... 41
3.1.3 Retrospective analysis ... 42
3.2 Data collection ... 44
3.2.1 Preparation phase ... 44
3.2.2 The pilot experiment ... 45
3.2.3 The teaching experiment ... 45
3.2.4 Pre-test and post-test ... 46
3.2.5 Validity and reliability ... 47
3.3 Data analysis ... 48
3.3.1 Pre-test and post-test ... 48
3.3.2 The pilot experiment ... 48
3.3.3 The second teaching experiment ... 49
3.3.4 Validity and reliability ... 49
CHAPTER IV HYPOTHETICAL LEARNING TRAJECTORY ... 52
4.1 The overview of the classroom observations and the teacher’s interview 54 4.2 The Hypothetical Learning Trajectory ... 58
4.2.1 Lesson 1: Scouts out and about ... 61
4.2.2 Lesson 2: Compare the dots ... 69
4.2.3 Lesson 3: Are girls taller than boys ... 74
CHAPTER V RETROSPECTIVE ANALYSIS ... 86
5.1 First cycle of teaching experiment ... 87
5.1.1 Pre-assessment ... 87
5.1.2 Teaching experiment ... 90
5.1.3 Post-assessment ... 114
5.1.4 The refinement of HLT from cycle 1 to cycle 2 ... 115
5.2 Second cycle of teaching experiment ... 117
5.2.1 Pre-assessment ... 118
5.2.2 Teaching Experiment ... 120
5.2.3 Post-Assessment ... 147
5.2.4 Discussion ... 148
CHAPTER VI CONCLUSION ... 150
6.1 Conclusion ... 150
6.2 Weaknesses of the study ... 153
6.3 Suggestion ... 155 REFERENCES
LIST OF TABLES
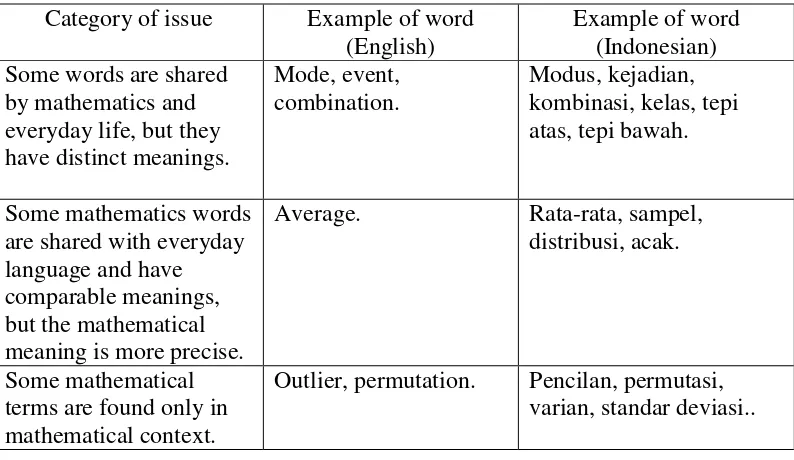
Table 2.1 Issues related to statistics vocabulary ... 15
Table 3.1 Dierdorp’s analysis matrix ... 28
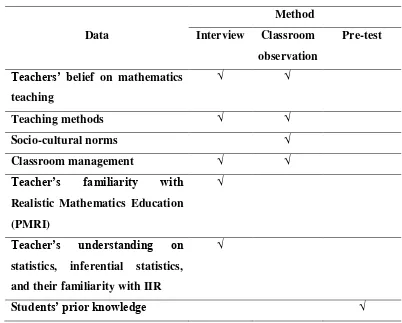
Table 3.2 Type of data and method of data analysis ... 29
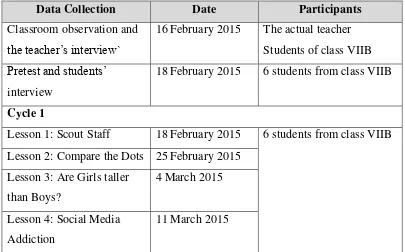
Table 5.1 Timelne of the research ... 71
Table 5.2 Refinement of the HLT from preparation phase to cycle 1 ... 74
Table 5.3 Compatibility issue between the result of pre-test and the elements of IIR ... 78
Table 5.4 Compatibility between HLT and ALT of activity 1.1 ... 80
Table 5.4 Compatibility between HLT and ALT of activity 1.2 ... 82
Table 5.5 Compatibility between HLT and ALT of activity 2.1 ... 85
Table 5.6 Compatibility between HLT and ALT of activity 2.2 ... 88
Table 5.7 Compatibility issue between HLT and ALT of activity 3.1 ... 92
Table 5.8 Compatibility issue between HLT and ALT of activity 3.2 ... 96
Table 5.9 Compatibility between HLT and ALT of Lesson 4 ... 100
Table 5.10 Compatibility issue between the result of post-test and the elements of IIR ... 103
Table 5.11 refinement of the HLT from cycle 1 to cycle 2 ... 104
Table 5.12 Compatibility issue between the result of pre-test and the elements of IIR ... 108
Table 5.13 Compatibility between HLT and ALT of activity 1.1 ... 112
Table 5.14 Compatibility between HLT and ALT of activity 1.2 ... 115
Table 5.15 The class chart and all the group charts ... 117
Table 5.16 Compatibility between HLT and ALT of activity 2.1 ... 120
Table 5.17 Compatibility between HLT and ALT of activity 2.2 ... 123
Table 5.18 Compatibility issue between HLT and ALT of activity 3.1 ... 126
Table 5.20 Compatibility between HLT and ALT of Lesson 4 in cycle 2 ... 134 Table 5.21 Compatibility issue between the result of post-test and the elements of
LIST OF FIGURES
Figure 3.1. Cyclic process of design research ... 15
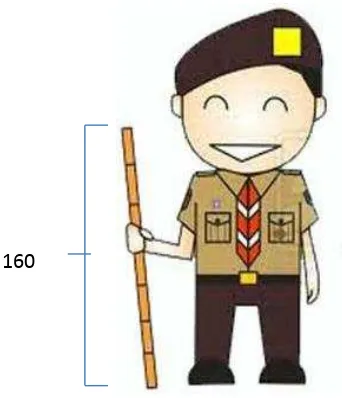
Figure 4.1. Illustration of the staff of Indonesian Scout ... 28
Figure 4.2. Example of a group chart ... 29
Figure 4.3. Example of a group chart ... 29
Figure 4.4. Example of the growing sample activity ... 29
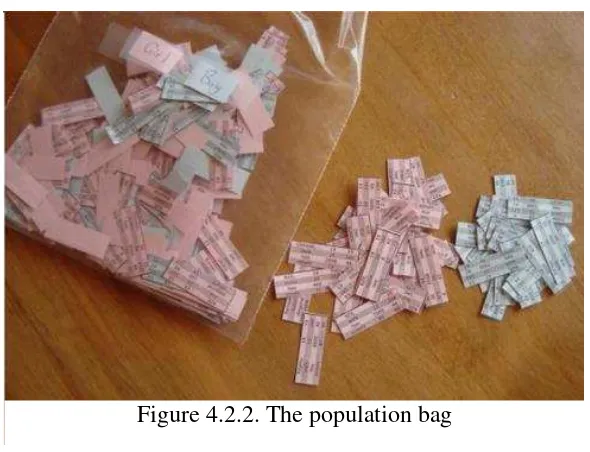
Figure 4.5. The population bag ... 29
Figure 4.6. Example of the growing sample activity ... 29
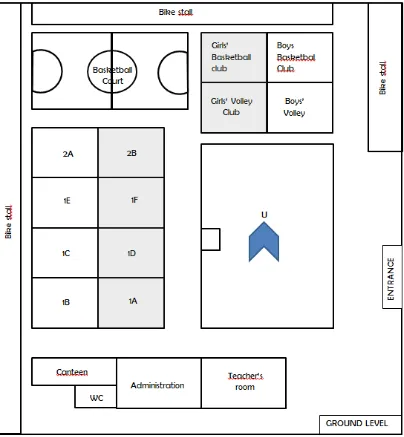
Figure 4.7. Map of the biased data collection ... 29
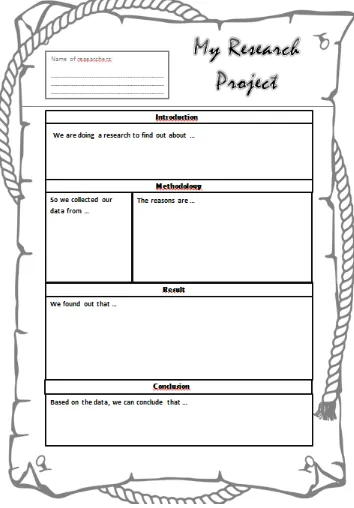
Figure 4.8. Layout of the research project report ... 29
Figure 5.1 Yosep’s anwer for question 4 ... 76
Figure 5.2 Gaby’s answer for question 4 ... 77
Figure 5.3 Anggi’s answer for question 4 ... 77
Figure 5.4 The class chart and the group chart of cycle 1 ... 84
Figure 5.5 the growth of group chart 3 ... 88
Figure 5.6 the school chart of group 1 ... 91
Figure 5.7 The Group chart of the focus group ... 110
Figure 5.8 The answer of the focus group on the first problem ... 110
Figure 5.9 The answer of the focus group on the second problem ... 111
Figure 5.10 The answer of the focus group on the third problem ... 112
Figure 5.11 The students constructed the class chart together ... 114
Figure 5.12 the finished class chart ... 114
Figure 5.13 The table with all the chart’s characteristics ... 118
Figure 5.14 The students’ conclusion in the end of activity 2.2 ... 122
Figure 5.15 The students’ conclusion in the end of activity 3.1 ... 125
1 CHAPTER I
INTRODUCTION
1.1 Research Background
Statistical procedures can be divided into two major categories; inferential and descriptive (Hon, 2010). Descriptive statistics revolves around describing and summarizing the data at hand, while inferential statistics attempts to use said data and what is known of it to infer about a larger population containing it. In most countries, statistics education introduced in primary and secondary school traditionally consist of descriptive statistics, focusing on computation about averages and interpreting graphs (Makar & Rubin, 2009). Inferential statistics is not introduced before tertiary level (Makar & Rubin, 2009; Rossman, 2008).
In recent years, the idea to reform the aim of statistics education has brought a lot of discussion. Major stakeholders in statistics education have consensus about the need of statistical literacy for an individual to function efficiently in modern, information-laden society (Ben-Zvi & Garfield, 2004). Inevitably, the way statistics being taught in school has to be reformed as well, from focusing on computation and procedures to a more holistic approach that goes beyond data analyzing technique (Paparistodemou & Meletiou-Mavrotheris, 2008) and assists students to make sense of the world, which is the essential purpose of statistics.
inference. It implies that instead of making inference of data using formula, students are encouraged to use informal statistical knowledge that surely is more familiar to them to make inferences about unknown populations based on observed samples (Zieffler, Garfield, Delmas, & Reading, 2008) .
The notion to teach inferential statistics in early stages of statistics education stems from the fact that formal inferential statistics is proven to be a hard concept for students to understand. This difficulty is mainly due to students’ lack of experience in reasoning about it, hence the inability to make sense and derive meaning of all the computation and procedures (Zieffler et al., 2008). It might be better if inferential statistics is introduced early in the stage of statistics education by focusing on the informal aspect of it (Zieffler, et al., 2008; Makar & Rubin, 2009), since the mathematics comprising formal inferential statistics is beyond reach of young students.
A lot of studies have showed the succes of developing IIR in young children. Ben-Zvi, Gil and Apple (2007) employed data handling software TinkerPlots to support the development of IIR in grade 4-6. Bakker & Gravemeijer (2004) used graphical representation software Minitools to support high school students informal reasoning about distribution. Watson & Moritz (1998) introduced IIR through the activity of comparing two data sets for children in grade 3-9, while Pfannkuch (2011) developed similar idea in 15-year-old-students through the investigation of boxplots.
context are probably not suitable due to the lack of facility and infrastructure. In Indonesia, specifically, generally public schools are not equipped with enough computers and sufficient internet connections. In term of curriculums, statistics education for primary and secondary students are traditionally centered around the computation of central tendencies and graph representations.
Although inferential statistics is not specifically mandated to be taught in Indonesia, implementing it will be beneficial in the long run since formal inferential statistics is hard to understand for Indonesian students as well. Promoting inferential reasoning while learning about descriptive statistics can help students bridge the connection between descriptive and inferential statistics. Watson & Moritz (1999) presented the idea that there are many points in the curriculum where the idea of inference can be introduced, together with descriptive statistics.
Some studies in Indonesia have already brought up discussions about more meaningful way in learning statistics; most of them focus on average. Lestariningsih (2012) proposed the use of folklore as a context to support students in learning average, while Assagaf (2014) suggested the use of length measurement as a context. However, as far as the researcher is aware of, there is no study that specifically aims to incorporate IIR in early education in Indonesia.
Based on those issues, it is important to design meaningful contextual
activities in order to foster the development of the students’ informal inferential
1.2 Research question
Based on the elaboration above, the research question of this study is
formulated as follow, “How can 7th grade students be supported to develop
informal inferential reasoning?”
1.3 Research Aim
The aim of this study is to design instructional materials to support Indonesian students in developing informal inferential reasoning, as well as to contribute a local instructional theory focused on developing IIR to statistics education in Indonesia.
1.4 Criteria of the study
Based on the research question and aim, we set up a criteria for this study which is elaborated as follows.
1. The students are able to achieve the learning goal of each lesson.
2. The students are able to participate in class discussion and to argue for and against a statement without using any formal statistical terminologies. This is exhibited in the students’ worksheet and the transcript of the class discussion. 3. The students are able to make generalization from sample to population, to
back up this generalization with data, and to produce this generalization with a degree of uncertainty.
4. The hypothetical learning trajectory (HLT) is realized within the actual learning trajectory (ALT). The HLT and the ALT will be compared and
1.5 Definition of some key terms
It is important to define the key terms involve in this study in order to avoid different or mis-interpretation for the terms. These terms and its definition are elaborated as follows.
1. Inference
A guess or opionion made by a person based on information that they have. 2. Informal Inferential Reasoning
Informal inferential reasoning is defined as the way in which students use their informal statistical knowledge to make argument to support inferences about unknown populations based on observed samples. It can also be defined as cognitive activities involved in informally drawing conclusions or making
predictions about “some wider universe” from patterns, representations,
statistical measures and statistical models of random samples, while attending to the strength and limitations of the sampling and the drawn inference. There are 3 characteristic of IIR: (1) generalization beyond the data, (2) the use of data to back up this generalization, and (3) the employment of probabilistic language (statement of uncertainty) in describing this generalization.
3. Developing
Developing is defined as progress. In the range of education, developing the
students’ understanding means a progress that connects the existing
knowledge and the intended learning goal. 4. Supporting
are expected to form their own knowledge with facilitation and encouragement from the teacher.
1.6 Significance of study
Related to the objectives of the study above, the present study is expected to be able to contribute to the development of a local instructional theory in domain of statistics. These contributions includes the classroom material as well as an ccompanying theory on how it foster the students’ IIR.
2 CHAPTER II
THEORETICAL FRAMEWORK
2.1 Statistical Literacy
Although literacy is more commonly associated with the ability to read and write, the term has been used in various fields to address a basic or minimal set of skills required to function sufficiently in that field. Ben-Zvi and Garfield (2004) proposed a definition of statistical literacy as “basic and important skills that may
be used in understanding statistical information or research results” (p. 7). Wallman
(1993) defined statistical literacy as “the ability to understand and critically evaluate statistical results that permeate our daily lives–coupled with the ability to appreciate the contributions that statistical thinking can make in public and private, professional and personal decisions” (p. 1). Gal (2002) identified statistical literacy as a compound of two components namely (a) the ability to critically interpret and evaluate statistical information one encounters in life and (b) the ability to discuss and communicate such interpretations and evaluations.
Statistical information is an unescapable part of people’s professional and daily lives. Modern citizens are bombarded with statistics used by politicians, researchers, and companies in an effort to strengthen their arguments. Moore (as cited in Gal, 2002) stated that data, variation, and chance are universal and ever-present parts of daily life, mentioning the impossibility to find policy question that has no statistical component as an example.
There are two roles that people can assume in regard to statistical information that they may have in everyday life; they can either be the consumers of the information, or the producers (Gal, 2002). People assume the role of a consumer unconsciously every time they encounter statistical information in everyday life, such as poll result or graphs in a news articles. The producer of legit statistical information, on the other hand, are mostly those working as statisticians or researchers; as in individuals who conduct statistical investigation and procedures on daily basis.
Considering the contexts in which statistical information usually appear, the role of a consumer is definitely much more common than the role of a producer. Nonetheless, people in every profession still need to be able to produce well-grounded arguments based on reliable facts and statistics. To conclude, at some point in their life an adult in modern society will be in a situation where they are demanded to be a consumer or a producer of statistical information, and they need statistical literacy to handle this situation effectively.
discipline from mathematics (del Mas, 2004), it cannot be denied that statistics are strongly linked to mathematics considering the numerical information and the mathematical formulas utilized within it. Gal (2002), in his model of statistical literacy, also argued mathematical knowledge as one of the bases for statistical literacy.
Considering that statistical literacy is a competency that a modern citizen is expected to have, it is one of the expected outcome of statistics education (Gal, 2002). However, teaching students statistics at school does not necessarily mean that its graduates are statistically literate. A lot of researches have brought up interesting findings related to statistical literacy in society, or lack thereof. Mullis et al. (as cited in Gal, 2002) reported that less than half of the students graduated from high school are able to do statistical tasks designed to measure statistical literacy. Kahneman, Slovic, and Tversky (as cited in Garfield, 1995) pointed out misunderstandings by adults about statistical concepts that are prevalent in daily life, such as representativeness of sample and gambling fallacy. Wallman (1993) also pointed out various misunderstandings, misperceptions, mistrusts, and misgivings people have in regard to how statistics are involved in making private and public choices.
Calculating numbers is also tedious work prone to mistakes and providing no mental stimulation. Hence, the students do not only find statistics difficult, they also find learning statistics unpleasant (Garfield & Ben-Zvi, 2004).
The ineffectiveness of the teaching of statistics calls for a reform. Some of the change to be expected are the change of a focus on analysis instead of computation, and a focus on encouraging the students to think and to reason statistically (Garfield & Ben-Zvi, 2004). Therefore, the recent argument in statistic education is how to reform the way statistics being taught in school to produce citizens that are statistically illiterate as the outcome.
2.2 Informal Inferential Reasoning
In statistics, two broad categories can be distinguished: descriptive statistics and inferential statistics (Walpole, 1995). Descriptive statistics are procedures used to find patterns in a set of data as well as to use these patterns to summarize and describe the set of data itself. Inferential statistics relate to the processes of making inference about a population from observing and analyzing a sample taken from that population. That is, descriptive statistics do not go beyond the data at hand, while inferential statistics makes generalization from a sample to the population it’s taken from.
scientific methods applied to a very limited sample, based on which conclusions and decisions regarding a larger population have to be derived. Generalizing to a larger population from a limited sample is where inferential statistics takes its role.
Looking at the mathematics curriculum, statistics in most countries is introduced in primary school. Up until the end of their secondary education, statistics learnt by students traditionally revolves around descriptive statistics and rarely goes beyond computing average and interpreting graphs (Makar & Rubin, 2009). Inferential statistics, on the other hand, is usually introduced to students in the tertiary level (Makar & Rubin, 2009; Rossman, 2008; Pratt, Johnston-Wilder, Ainley, & Mason, 2008). It revolves around statistics that are important in conducting research, such as hypothesis tests, parameter estimations, or normality tests. Since the inferential statistics being introduced in college statistics classes mainly consists of formal procedures, it is referred to as formal inferential statistics.
Students’ difficulty in inferential statistics has been addressed by prominent
statistics educators in statistics education journals and conferences (Pratt & Ainley, 2008). The solution proposed to tackle this problem is to introduce statistical inference to the students below tertiary level (secondary and primary). However, since formal inferential statistics is cognitively not suitable for them, it is approached by focusing on informal aspects of it. This is known as informal inferential reasoning (IIR).
that is based mainly on looking at, comparing, and reasoning from distributions of data. Rossman (2008) described it as the way students infer beyond the data at hand through reasoned arguments that employs no formal method, technique, or calculation. Another definition is by Zieffler et al. (2008), who formulated IIR as
“the way in which students use their informal statistical knowledge to make
argument to support inferences about unknown populations based on observed samples” (p. 44), while Ben-Zvi, Gal and Apel (2007) defined informal inferential
statistics as “cognitive activities involved in informally drawing conclusions or
making predictions about “some wider universe” from patterns, representations,
statistical measures and statistical models of random samples, while attending to the strength and limitations of the sampling and the drawn inference” (p. 2).
Makar and Rubin (2009) suggested three key principles that are essential in making statistical inference informally: (a) generalization beyond the data, (b) the use of data to back up this generalization, and (c) the employment of probabilistic language (statement of uncertainty) in describing this generalization.
Recent study by Makar & McPhee (2014) showed that through a series of predicting activities, grade 1 (5 years old) can be supported to develop IIR. Similar result is also reported by English (2014) on a study done to grade 1 to 3 (6-8 years old). The less strict nature of informal inferential statistics allows it to be taught across various education levels. Even though the main idea is to start with young students, some research also record its implementation for student in late secondary and early tertiary education (Wienber, Wiesner & Pfaff, 2010).
2.3 Example of informal inferential reasoning
A study by Hamlin, Wynn, & Blomm (Rossman, 2008) investigated whether
or not infants find an individual appealing because of that individual’s reaction
toward others. 10-month-old infants where shown a character, called ‘climber’, that
struggle to climb up the hill. Other characters, called ‘helper’, pushed the climber
to the top, while ‘hinderer’ pushed the climber down the hill. Each infant is shown the characteristics several times, before being presented with the helper and the hinderer. The study recorded that for a sample of 16 infants, 14 chose the helper toy. The question is that, it is because of genuine preference or a mere chance? Do infants really have a preference?
Formal inferential statistics will require formal calculation of an exact p-value or a test statistics. On the other hand, the students without inferential reasoning will probably conclude that the infants do have preference by solely looking on the data.
also produce a statement of uncertainty or certainty. Suppose their assumption is that the infants have no preference, then the infant picking the helper can be modeled by flipping a coin and getting the head. It is quite unusual to flip 16 coins and get 14 heads, hence it can be argued that the possibility of 14 infants picking the helper toy without any preference is quite small.
On the other hand, the argument about uncertainty can also come from the quality of the sample. The students can argue for the infants having no preference considering the sample size. Even though almost all the infant chose the helper toy, the size of the sample is too small to represent the whole population.
To conclude, as informal inferential reasoning bridge between descriptive statistic and formal inferential statistics, the students in this stage do not use any formal inferential statistical procedures but do not produce any deterministic statement either.
2.4 The importance of Informal Inferential Reasoning
The reason why Informal Inferential Reasoning is a reasonable topic to be researched is described as follows.
2.4.1 Students’ difficulty in learning formal inferential statistics
Formal inferential statistics are thought to be difficult and students in introductory statistics class often have difficulty understanding the reasoning behind it (Makar & Rubin, 2009; Garfield & Zvi, 2008). Various causes have been identified.
their compulsory education to the inferential statistics they learn in college. Brandom (as cited in Bakker & Derry, 2011) brought up this issue by discussing the distinction between holism and atomism in statistics education. Atomism approach refers to learning individual concepts separately and only about what these concepts refers to, then combining them to form a coherent body of knowledge. On the contrary, holism is described as “… one cannot have any concept unless one has many concepts. For the content of each concept is articulated by its inferential relations to other concepts. Concepts, then, must come in
packages.” (p. 11). Holism is preferred over atomism because topic-by-topic
approach is deemed to be no longer effective.
Learning descriptive and inferential statistics separately also leads to the second case, which is the difficulty to deal with the probabilistic nature of inferential statistics. The traditional approach to statistics in the early grades can encourage an overly deterministic sense about statistics. Upon entering statistics classes in college, the students generally lack experience in working with and reasoning about stochastic events that underpin statistical inference (Zieffler et al., 2008).
The third case is the focus on procedures and algorithms, what is fondly
referred to as the “mean-median-mode” syndrome (Bakker & Derry, 2011). It
however rarely use it to compare groups, instead only use it descriptively or calculating it out of habit (Bakker & Derry, 2011).
Garfield (as cited in Harradine, Batanero, & Rossman, 2011) stated that the teachers prefer to teach concepts and procedures in the hope that the reasoning will develop by itself. As the result, the students start their formal inference with a reasoning-free background and a detrimental misconception that statistics is only about counting numerical values. Zieffler et al. (2008) also agreed that inferential reasoning is unlikely to develop by itself with maturation or life experience, hence it needs to be intentionally developed. Therefore, it is considered important for the teachers to provide students with ways to attend to other relevant aspects of data sets such as variations, distribution and sample size, in addition to learning definitions and calculations. Without paying attention to its conceptual underpinning, students will continue to find inferential statistics problematic (Pfannkuch, 2006).
Furthermore it has been argued that doing computations should not be the focus anymore, at least not as much as reasoning the behind said computations, as there are fair number of software that can help the students to do the calculations nowadays (Harradine et al., 2011).
2.4.2 Supporting statistical literacy
can help students in their future work environment where formal statistical procedures cannot be carried out.
Since the goal of statistics education is for students to achieve statistical literacy in the end of education, it is important to consider the role that statistical inference has in it. Statistical inference has been referred as one of concepts that build statistical literacy. In the framework of statistical literacy proposed by Gal (2002), for example, the statistical knowledge base consists of five parts which includes statistical inference as one of them. The five parts of the knowledge base are: (a) knowing why data are needed and how data can be produced, (b) familiarity with basic terms and ideas related to descriptive statistics, (c) familiarity with basic terms and ideas related to graphical and tabular displays, (d) understanding basic notions of probability, and (e) knowing how statistical conclusions or inferences are reached.
2.4.3 The need for innovation
Being innovative relates to looking beyond the current working system, identifying the ideas of tomorrow and putting them into practice. Innovation in education means trying new ways of doing things in their learning environments. Education system is often viewed as the main army a nation have in an eternal battle against unemployment and constantly being in the center of policy debate, hence in order to be well-equipped in dealing with change, a country need to constantly innovate (OECD, 2010).
graph construction and calculation of statistical measures to a focus on ideas such as distribution and variability (Leavy, 2010).
Informal Inferential Reasoning is a new topic and therefore is not included in conventional mathematics curriculum. However, it is an interesting new topic that can be the profound innovation to the current statistics education.
2.5 Developing informal inferential reasoning
In order to develop IIR, a series of lessons are to be designed. Therefore, a careful consideration needs to be made regarding what needs to be employed in order to create an effective lesson; a lesson that can bridge students’ prior knowledge and the learning goal.
2.5.1 Sample and population
into it is proposed as a way to support students in developing the idea of distribution. This activity is called growing sample.
7th grade students have no conception yet about sample and sampling process since the concept of sample and population is formally introduced in grade 9 (14-15 years old). However since the idea of sample and population is important for IIR, the students need to develop the idea of it even though they do not necessarily have to be exposed to the formal terminologies and definitions. It is also worth noted that in the last activity designed by Assagaf (2014) contains inferential reasoning because the students are expected to use the average value of one group to represent the whole population. This design failed because the students added up the average of all groups and divided it by the number of the groups instead, which was caused because they have not been exposed to the idea of sample and population yet.
2.5.2 The use of context
The students will have to look beyond the data at hand, as well as to persuade others and to argue about their inference. To do that, they need to be interested and engaged in the problems. Hence, the choice of context is very important. Real life data, surprising and complex problem situations that contradict their prior beliefs are useful (Ben-Zvi et al., 2007), as well as compelling question that propel students to look beyond the data at hand.
In this study, the context chosen is height measurement (in cm) and the use of social media (in hours). Height is a biological measurement that every individual student is familiar with, while the use of social media is an issue that currently being talked about in society. Both of them are real life data that the students collect themselves.
2.5.3 Dot plots
Activity for statistics lesson for young children are encouraged to be based on exploratory data analysis (EDA), which mostly about analyzing and summarizing
a set of data mainly with visual methods (Paparistodemou & Meletiou-mavrotheris, 2008). The use of statistical procedures are not compulsory, which is convenient since premature introduction to algorithm is argued to result in inert knowledge (Bakker & Derry, 2011). Therefore the kind of data representation needs to be chosen wisely that encourage students to analyze data visually.
a fairly simple scale, which on most cases is horizontal and does not require 0 as starting point. It is used for continuous and quantitative data. They are useful for moderately sized data, as well as to highlight clusters, outliers, range, and other characteristics (Wilkinson, 1999).
Dot plots is fairly easy to construct without computer software, hence it can be supportive in classroom environments that is not technologically equipped. It also supports EDA because it gives way for the students to visually detect the main characteristics of the data.
The use of dot plots has been mentioned in a study done by Pfannkuch (2006) to 15 years old students, where they have to use box plots to reason about inference. The result of the studies suggests that the use of box plots might be too early for students, and that they should be supported to reason with it through keeping the data, in dot plot form, under the boxplots (Bakker, Biehler, and Konold, as cited in Pfannkuch, 2006).
2.5.4 Vocabulary
Mathematics as a science offers its own challenge since its vocabulary are subject-specific. Researches have shown how languages and lack of attention to it can result in problem for students, mainly in classrooms with non-native speaking students. Issues related to mathematics vocabularies in mathematics has been the subject of many researches (Thompson & Rubenstein, 2000). Christensen (as cited in Walshaw & Anthony, 2008) conducted a study about mathematical langauges in Maori mathematics classroom that shows how mathematical words can be problematic. Eerde & Hajer (2005) brough forward the language-related problems within multilingual Dutch secondary schools and proposed a design of classroom material to tackle this problem.
Statistics vocabulary are even more exclusively used since it shares very little common vocabulary with other domains of Mathematics itself. The following are issues related to vocabulary commonly found in the field of statistics.
Table 2.1. Issues related to statistical vocabulary Category of issue Example of word
(English) meaning is more precise.
Average. Rata-rata, sampel, distribusi, acak.
Some mathematical terms are found only in mathematical context.
Some words have more than one mathematical meaning.
Median, range. Median, range.
Modifiers may change
Stem-and-leaf Diagram batang daun.
Some words shared with science have different meanings in the two disciplines.
Simulation, experiment. Percobaan, eksperimen.
Some mathematical
Note. Adapted from “Learning Mathematics Vocabulary: Potential Pitfalls and Instructional Strategies” by Denisse R. Thompson and Rheta N. Rubenstein, 2000, Mathematics Teacher, 93(7), p. 569
Just like students cannot understand statistics just by learning formulas and procedures, it is also debatable to assume that they will have sufficient understanding only by being given the definition of these words. Learning a mathematical term is not as simple as getting and learning its definitive meaning(s). It is important to guide the students off everyday language that they are comfortable with and ease them into using technical mathematics language correctly (Leung, 2008).
classroom discourse, informal langauge can play an important facilitative role. Research suggests that informal and formal language can be used in various combinations in class, and that students can use informal language productively to explore concepts represented by technical vocabulary (Leung, 2008). Paying attention to informal language to develop formal language is also proposed by Thompson & Rubenstein (2000), who suggest several interesting strategies such as: 1) building the concept first and then attach the vocabulary to the established ideas, 2) asking students to explain their work orally with the teacher actively correcting, revoicing, and guiding their utterance to be more mathematically precise, and, 3) asking the students to write in the form of a journal where they note down statistical vocabulary that they encounter in class every day and provide them with their own definition.
Several studies have been conducted with statistical vocabulary as main or side attention. Watson & Kelly (2008) conducted a study to students in grades 3, 5, 7, and 9 about their ability to define three fundamental statistical terms: sampe, random, and variation. Pfannkuch (2011) did a study on informal inferential reasoning in which the teacher will introduce the vocabulary in the beginning of the class, and then write it on the board every time it comes up in discussion.
supporting the ‘literacy’ aspect of statistical literacy. Gal (2002) also mentioned the ability to discuss and communicate such interpretations and evaluations as one of the components that build statistical literacy.
2.6 Realistic Mathematics Education
Realistic Mathematics Education is an approach in Mathematics Education based on the idea of Hans Freudenthal (Gravemeijer, 1994), initially as a way to reform mathematics education in the Netherlands. Freudenthal´s view is that Mathematics is a human activity. As opposed to receiving everything ready-to-use, students must build their own mathematical conceptions based on their own world.
This human activity is centered around the idea of what Freudenthal refers to as mathematizing, which he suggested to be the key process in Mathematics education and relates to the process of translating day-to-day problems into equivalent mathematical terms (Gravemeijer, 1994).
To evoke this mathematizing process, RME encourage the use of contextual problem (Gravemejer, 1994). Context-bound problems are easily understood by the students because these are closer to their everyday lives, hence they encourage the students to develop and use their own solutions. Different solutions from different students will lead to a discussion about adequacy, and then turn into the idea of efficiency (Gravemeijer, 1994). From the need to be efficient, a generalization to formal mathematical term arises.
phenomenology, and 3) self-developed models (Gravemeijer, 1994). This elaboration will focus on the first two of the principles, which support the development of Informal Inferential Reasoning.
Guided-reinvention means that the students should be given a chance to experience the process by which the aimed mathematical concepts are invented. Being exposed to the situation that gives rise to those mathematical concepts and being immersed in the related process will encourage students to start developing their own procedures, albeit informally. These informal procedures are later mathematized to formal procedures, which is called progressive mathematization. Didactical phenomenology states the importance in selecting the problems solved by the students. Historically, mathematics was developed as a way of problem solving, therefore during the design process, we have to select problems that not only offer the students a chance to solve it themselves, but also the possibility to generalize this to other situation.
In reasoning about inferential statistics informally, students use their informal statistical knowledge to make arguments based on observed samples to support inferences about an unknown population. Hence the emphasis is not on statistical procedures and mathematical arguments, but more on reasoning from characteristics of data, conceptual understandings and the provision of explanation.
using statistical formulas, students are encouraged to use informal knowledge that surely is more familiar to them. This informal knowledge will cause them to reinvent the formal statistical concepts, that they can use broadly across many statistics contexts.
In this research, a sequence of instructional materials will be designed to foster the development of IIR. The principle from Realistic Mathematics Education, especially guided reinvention and progressive mathematization, as well as didactical phenomenology, will be employed as the design heuristic during the designing process of the instructional materials.
2.7 The Role of Teacher
The idea of effective learning is where the students participate actively instead of acting as passive receivers. This, however, does not imply that the role of the teacher is irrelevant. The role of the teacher in the classroom will be elaborated as follows.
2.7.1 Decision maker related to the mathematical contents and tasks
A lot of factors have to be taken into consideration during the designing process of a lesson. The formulation of the learning goals is determined by the curriculum in each respective country. The activities are chosen and designed such a way that it
can be conducted within the time frame available. The students’ prior knowledge
and the school’s resource are also needs to be considered.
On the other hand, the flow of the lesson needs to be in accordance to the pace
construct their own knowledge. There has to be a balance between predetermined learning goals and the mathematics built by students (Simon, 1995).
The responsibility to be responsive to the students’ learning while keeping track with the learning goals leads to the development of hypothetical learning trajectory (HLT) . It is an instrument with significant role throughout all phases of
design-research. HLT is essentially the same as the learning trajectory that most teacher are familiar of, but designed in such a way so that it can adapt as well as possible to unforeseeable circumstances (van Eerde, 2013). More detailed explanation about HLT will be given in the later chapter.
The teacher holds very important role as a the planner and executor of these three components; the learning goals, the learning activities, and the HLT. In this study, however, the researcher will take over the planner role and leave the executor role to the teacher. This does not mean that the teacher will just stay there waiting for the command from the researcher. Quite the contrary, in fact, because the teacher is the one who are knowledgeable about the classroom community and situation. The teacher’s knowledge will be constantly taken into account during the design process and the formulation of HLT.
2.7.2 Setting up the context and classroom environment
Regarding this matter, the role of the teacher is to engage the students by presenting the context as interesting as possible. The teacher can personalize the context by
connecting it to their own or the students’ experience, or relate it to the current
issues happening in society. Questions or prompts by teacher also have important role in eliciting statement of generalization from students.
2.7.3 Establishing social norms and sociomathematical norms
During the course of the lesson, there will be group works and presentations. All the groups will work on different samples and come up with different answers. The students are also used to the deterministic nature of descriptive statistics, in where they can see all the data and there is always an exact and numerical answer. Therefore, general social norms have to be established beforehand to ensure that the lessons run smoothly without being intervened by undesirable forms of interaction between and among classroom community.
Walshwa & Anthony (2008) did a meta-analysis on what sort of pedagogies that through classroom discourse will encourage students’ engagement in mathematics. One of the result of this study is that various researches agree on
“participating rights and obligations”, which essentially means that every students
has to engage in classroom discussion, either to explain their thinking or listening to others doing so. Therefore the teacher not only has to establish, but also clarify and enforce discourse participation rules within the classroom community.
Sociomathematical norms, on the other hand, are normative aspects of
mathematical discussions specific to students’ mathematical activity (Yackel &
Cobb, 1996). This includes normative understandings of what counts as mathematically different and mathematically sophisticated or efficient, as well as knowing what kind of mathematical explanation and justification can be count as acceptable.
These norms are not predetermined criteria; they are supposed to be constructed by each classroom community (Yackel & Cobb, 1996). Each class might have different clarification on what can be constituted as mathematically sophisticated or different. In developing informal inferential reasoning, every group will have different inference, method of sampling, or argument for representativeness. Discussion centered around these differences is expected to end with consensus about sophistication or efficiency – what method of sampling is effective and unbiased, or the correct and proper use of statistical vocabulary/terminologies.
2.7.4 Tending the mathematical vocabulary
In this study, the students are encouraged to develop the concept themselves without being pressured to use technical vocabulary at the start. Over the course of the lesson, the students are predicted to use general every day words or phrases in the place of formal terminologies they are yet to be aware of. They will use bump, scattered, and picky in the place of typical, spread, and bias, for example.
tend to the coping strategy of using generic every day word and help the students shaping it into a mathematically sophisticated argument. Language is also pointed out by Walshaw & Anthony (2008) as an important part of pedagogies that teachers
need to pay attention to. They stated that “responsibility for distinguishing between
terms and phrases and sensitizing students to the particular nuances weighs heavily with the teacher, who profoundly influences the mathematical meanings made by
the students” (p. 533).
What the teachers are advised to do is to emphasize these informal words or phrases by either asking the students to revoice it or revoicing it themselves, or writing them down on a special section of the white/blackboard. In the end of the lesson, the teacher can discuss this word and introduce the equivalent formal words.
2.8 Statistics in Mathematics Curriculum in Indonesia
In Indonesian curriculum, statistics starts to be introduced in primary school. There is clear separation between descriptive and inferential statistics. Descriptive statistics is introduced in a traditional way that focuses on computation and procedures. Inferential statistics, on the other hand, is only started to be introduced at college level statistics.
Research about statistics education in Indonesia so far has been focused on developing the idea of measures of central tendency (e.g. Lestariningsih, 2012; Assagaf, 2014). Considering a lot of studies suggest that IIR can be successfully taught to junior high school students, as well as the fact that primary school students are just entering their explorative data analysis phase, a study about the development of IIR is carried out in 7th grade.
Based on the new curriculum 2013, the basic competence and standard competence in statistics for 7th grade are the following.
4.8 Collecting, analyzing, interpreting and presenting data of observation in the form of a table, chart or graph.
4.9 Conducting experiments to find empirical probability of a daily life problem, as well as presenting it in the form of a table and graph.
(Kemendiknas, 2013) Based on the description above, it can be concluded that:
1. There is a shift in the goal of statistics education, resulting in a more holistic approach that is demanded by the stakeholders of statistics education in the world.
2. Formal inferential statistics is an important yet difficult subjects that creates obstacles for students in learning statistics.
Considering its importance and the lack of discussion on this topic in Indonesia, the aim of this study if to contribute a local constructional theory in 7th grade to develop IIR. The research question is formulated as follows: How can 7th grade students be supported to develop Informal Inferential Reasoning?
2.9 The pre-HLT
The aim of this study is to contribute an empirically grounded theory in supporting 7th grade students to develop IIR. To accomplish that, a set of
instructional material is designed, consisting of students’ worksheet and the
accompanying teacher guides, as well as the accompanying hypothetical learning trajectory (HLT), which will be explained in detail in Chapter IV.
The instructional material and the HLT is actually the end product of the designing and preparation phase of design research. However, the HLT previously constructed according to the result of literature review, resulting in the pre-HLT. The pre-HLT is further improved by considering the result of the classroom
observations and the teacher’s interview, resulting in the final version of the HLT
As explained in the theoretical framework, there are four aspects that are hypothesized to be essential in lessons focused on developing IIR: 1) a focus on sample and population, 2) the use of context, 3) the use of dot plots as the type of data representation, and 4) delaying the use of formal statistical terminology and using its informal equivalent proposed by the students instead.
Schwartz, Sears, and Chang (in Weinberg et al., 2010) suggested that the
students’ informal knowledge should be developed through activities that provide
the foundation for the formal instruction later on. Since the target of this study is 7th grade, they are used to the descriptive idea of statistics and have not yet possessed any understanding about sample and population. The students need to be introduced to sample and population, as well as why sampling is necessary. Aside from that, the students also need to learn about the quality of sampling process. The following are the four ideas that the students need to develop.
1. A part of data can represent the whole (representativeness).
2. It is impractical to take the whole data into account, hence the need for sampling.
3. The bigger the part of data, the more it resembles the population (effect of sample size).
4. All member of population has to have equal chance to be picked as sample (randomization).
1. Lesson 1: Scouts out and about
The aim of this lesson is for students to recall the concept of data as well as data collection, representation, and summary that they received in primary school. The context of this lesson is finding out suitable Scout staff length for the students in grade 7.
This lesson contains two activities. The students work in group and each group is given a population box containing pieces of paper with the height of the students written on it. In the first activity, the students take a certain number of data from the population box and represent it in the form of dot plot. They use blue dot to represent male students and pink to represent female. In the second activity, the students work together to create the class dot plot. Each student get a sticker, pink for girl and blue for boys, and they stick it to the plot provided on the whiteboard. The students are then asked to describe their plots and find out the typical value.
Hands-on sampling activity are recommended by researchers (Weinberg et al., 2010) as an effective way for the students to experience the process of sampling by actually taking a part of data from the whole. Moreover, the students are most at ease when comparing data visually and using their hand gesture to explain it (Watson & Moritz, 1999). The use of dot plots and different colors for male and female students encourage this.
2. Lesson 2 : Compare the dots
The aim of this lesson is to develop the idea of sample representativeness and sample size. In the previous lesson, the dot plot made by the students by taking a certain number of data from the population box is referred to as the group chart, while the whole class dot plot is referred to as the class chart. The context of this lesson is the disappearance of the group chart, so the students have to determine the group chart that is suitable to replace it.
There are three activities contained within this lesson. In the first activity, the students compare and contrast their group chart to the class chart. In the second activity, the students compare and contrast all the group charts to the class chart. The conjecture is that the students pick the group chart that contains similar information to the class chart as the most representative one.
In formal statistical inference, the students usually begin with a single sample and a hypothetical population (Watson & Moritz, 1999). It might be better for younger students if they can compare two actual set instead of one actual and one hypothetical set. The students can actually see how the part of data can contain the same information as the whole.
Since the students take the sample themselves, it gives them some kind of
‘personal ownership’ over their data. This is recommended to evoke productive
class’ discussion (Weinberg et. al, 2010), especially when determining which group
chart can represent the class chart the best.
group, the more it resembles the class chart. This activity is called growing sample
(Bakker, 2012).
3. Lesson 3: Are girls taller than boys?
This lesson is designed to develop the need for sampling and the idea of randomization. There are two activities contained within this lesson. In the first activities, the students are asked to find out the typical height of the students in the whole school. The conjecture is that the students will run out of time or space, which will encourage discussion about a more effective way in finding information about a population.
In the second activity, the students are asked to judge a claim that contradicts their previous knowledge. Generally, the male students are taller than the female students. The context for this activities is a health report by the Head of the Students council, who collect his data in an unfair way that is the most convenient for him, i.e. by taking female students mostly from the higher grade. The claim made by the Head of the Students Council is that the female students are taller than the male students. The conjecture is that the students will reject the claim because the data is picked such a way that it produces said statement.
This kind of statement that trigger conflicts with the students’ initial belief is
encouraged because it encourages the students to look deeper into the problem and evoke meaningful discussion (Bakker & Derry, 2011).
4. Lesson 4: Social media addiction
sample representativeness into account. They are expected to utilize the informal statistical knowledge they already learned during the course of the lesson.
3 CHAPTER III
RESEARCH METHOD
3.1 Research approach
The main goal of this study is to support 7th grade students in developing informal inferential reasoning. This goal also demands for innovation and improvement to be made to the conventional way statistics are being taught in secondary school. To achieve this goal, a series of instructional material intended for that purpose and an accompanying theory on how they work are developed. The instructional material is designed in such fashion so it can foster the emergence of
students’ IIR. To ensure its effectivity, the instructional materials needs to be
implemented in an experiment setting that closely resembles the targeted group, and do so iteratively to adapt to whatever unexpected factors that might reveal themselves along the way.
To fulfill these requirements, a qualitative approach called design research is chosen. It is aimed specifically to develop theories about domain-specific learning as well as its accompanying instructional materials (Bakker & Eerde, 2013; van Eerde, 2013). More importantly, design research emphasizes not only on what educational design that works, but also on why, how, and to what extent it works.
It is aimed to “give theoretical insights into how innovative ways of teaching and
learning can be promoted” (Eerde, 2013, p. 2), which is in line with the aim of this
study.
analysis (Graveimer & Cobb, 2006). The retrospective analysis is the most crucial phase where the previous phases are reflected. The knowledge of the researcher is the starting point of the cycle, and the result of the retrospective analysis contributes
to the researcher’s knowledge, that leads to a new cycle.
Figure 3.1. Cyclic process of design research (Gravemeijer & Cobb, 2006)
3.1.1 Preparations and design phase
Van Eerde (2013) mentioned three steps taken during this phase: (a) a literature review, in which the researcher studies the present knowledge about the topic; (b) the formulation of research aim and research question; and (c) the development of HLT.
Eerde, 2013). This includes establishing learning goals and students’ prior knowledge, as well as creates a set of tasks capable to bridge that gap and the accompanying hypothesized learning process.
To ensure this HLT works, aside from the pilot phase that is going to be explained in the next session, the HLT is also discussed with experts. What is expected at the end of the preparation phase is an elaborated HLT and a set of tasks, ready to be implemented in a classroom. The interventionist nature of design research allows the HLT to be modified along the course of the research (Bakker & van eerde, 2013), in order for the instructional materials as the output of the study is the best possible for the intended educational environment.
3.1.2 Teaching experiment
Steffen & Thompson (as cited in Bakker & van Eerde, 2013) stated that the
primary purpose of a teaching experiment is to experience students’ learning and
reasoning at first hand, thus bridging the practice or research and the practice of teaching. In the teaching experiment phase, the HLT produced in a previous phase is tested to see whether or not it works in real life settings as opposed to being hypothetical.
Prior to the teaching experiment, the researcher also needs to determine the type and the means of data collection, as well as to discuss the lessons with the teacher (Eerde H. v., 2013). The data collected typically include the students’ written works, pre- and post-test, field notes, as well as audio and video registrations.
3.1.3 Retrospective analysis
Since the conjecture in HLT is a hypothetically thought to be how students’ learning may occur, it makes sense that the analysis will be about comparing the hypothetical conjecture to the actual learning process. In this phase, the HLT is employed as a guideline to in the process of the analysis (Bakker & van Eerde, 2013). Based on the result of main teaching experiment, further adjustment is made to the HLT which can result in an additional cycle. The cycles stop when the criteria of this study as explained in the previous chapter is achieved.
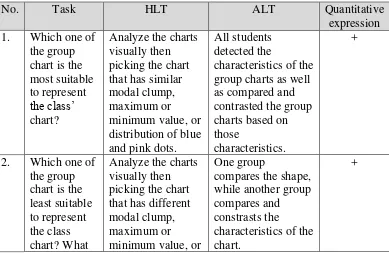
The approach employed for retrospective analysis in this study is task-oriented method, where the HLT and the actual observed learning trajectory is
compared by means of Dierdorp’s analysis matrix (cited in van Eerde, 2013). This
Table 3.1. Dierdorp’s analysis matrix
Hypothetical Learning Trajectory Actual Learning Trajectory Number
students’answer Transcript of video recording
education” by H.A.A. van Eerde, 2013, Proceeding The First South East Asia Design/Developmental Research (SEA-DR) International Conference (pp. 1-10). Sriwijaya University.
The trustworthiness of a study depends whether or not it is conducted in a valid and reliable way. Each research approach demands specific way to assess its validity and reliability. Bakker & van Eerde (2013) explained in detail about the criteria for validity and reliability in design research setting. Validity refers to the soundness of the reasoning that has led to the conclusions, as in whether or not the data actually measures what we intend to measure. On the other hand, reliability refers to the independency of the study from the researcher.