Liquid Chromatography Mass Spectrometry (LC-MS) Fingerprint
Combined with Chemometrics for Identification
of Metabolites Content and Biological Activities of
Curcuma aeruginosa
Dewi Anggraini Septaningsih
1,2,*, Latifah Kosim Darusman
1,2,
Farit Mochamad Afendi
2,3, and Rudi Heryanto
1,21Department of Chemistry, Faculty of Mathematics and Natural Sciences, Bogor Agricultural University, Tanjung Street, IPB Campus Dramaga, Bogor 16680, Indonesia
2Biopharmaca Research Center, Institute of Research and Community Empowerment, Bogor Agricultural University,
Taman Kencana Campus, Bogor 16128, Indonesia
3Department of Statistic, Faculty of Mathematics and Natural Sciences, Bogor Agricultural University, Tanjung Street, IPB Campus Dramaga, Bogor 16680, Indonesia
Received May 30, 2017; Accepted August 10, 2017
ABSTRACT
Curcuma aeruginosa is known as one of the components of herbal medicine with various biological activities. This research aims to identify the metabolites content ofC. aeruginosarelated to their biological activities using LC-MS fingerprint combined with chemometrics.C. aeruginosafrom 3 areas in Java were collected and macerated with ethanol and then analyzed with LC-MS. Along with this analysis, the antioxidant activity of all samples was determined using CUPRAC method, and the toxicity was determined using Brine Shrimp Lethality Test (BSLT), and chemometric method was used Principle Component Analysis (PCA) and Partial Least square (PLS). Metabolites profiles showed 175 predicted compounds, in which the dominant compounds are from the sesquiterpene of Curcumagenus. The PCA metabolites profiles can separate the samples by their location of origin. Interpretation of the correlation between metabolites profiles and their bioactivities was determined using PLS technique. The results showed that the toxicity of samples was exerted by compounds with ion mass of 312.28 and 248.15, which have the highest antioxidant and toxicity potentials. Compounds with ion mass of 248.15 were predicted to be
9-Oxo-neoprocurcumenol, 7α,11α,-Epoxy-5β-hydroxy-9-guaiaen-8-one, Curcumenolactone A, or Curcumenolactone B.
While compound with ion mass of 312.28 was predicted to tetrahydro-bisdemethoxycurcumin.
Keywords: C. aeruginosa; liquid chromatography-mass spectrometry; chemometric; bioactivity
ABSTRAK
Temu ireng (Curcuma aeruginosa) dikenal sebagai komponen jamu dengan berbagai aktivitas biologis. Penelitian ini bertujuan mengidentifikasi kandungan metabolit temu ireng terkait aktivitas biologisnya dengan menggunakan sidik jari Kromatografi Cair-Spektroskopi Massa (LC-MS) yang dikombinasi dengan kemometrik. Temu ireng dari 3 daerah di Jawa dimaserasi dengan etanol dan dianalisis dengan LC-MS. Bersamaan dengan analisis tersebut, ketiga sampel ditentukan aktivitas antioksidan dengan metode CUPRAC dan toksisitasnya ditentukan dengan metode Brine Shrimp Lethality Test (BSLT), dan metode kemometrik menggunakan Principal Component Analysis (PCA) dan Partial Least Squares (PLS). Analisis profiling metabolit dari sampel menunjukkan 175 senyawa dugaan serta dengan senyawa-senyawa yang dominan terdapat dalam golongan sesquiterpene dari genus Curcuma. Dengan teknik PCA, profil metabolit ini dapat memilah sampel berdasarkan daerah asalnya. Interpretasi korelasi antara profil metabolit dan bioaktivitas dilakukan dengan teknik PLS. Evaluasi analisis PLS menunjukkan bahwa hubungan antara komposisi metabolit terhadap toksisitas dipengaruhi oleh keberadaan senyawa massa ion 312,28 dan 248,15 yang memiliki potensi antioksidan dan toksisitas yang paling tinggi.
Senyawa dengan massa ion 248,15 diduga sebagai senyawa 9-Oxo-neoprokurkumenol,
7α,11α,-Epoksi-5β-hidroksi-9-guaiaen-8-on, kurkumalakton A, kurkumalakton B. Untuk senyawa dengan massa ion 312,28 diduga sebagai tetrahidro-bisdemetoksikurkumin.
INTRODUCTION
Temu Ireng (Curcuma aeroginosa), is a herb which rhizomes can be used as a mixture of drugs/herbs. In traditional remedies,C. aeruginosahas been used as an disinfectant, expectorant, anthelmentic, antifungal, febrifuge, and anti-inflammatory [1]. Furthermore, extract of C. aeruginosa showed its potency as candidate for anti-viral substances that may needed for eradicating Avian Influenza (AI) infection [2]. Many studies demonstrate that C. aeruginosa has the potential as a natural anti-inflammatory, HIV inhibitor, and anti-cancer. The active substance, curcumenol, is suspected to have activities as anti-viral, anti-convulsant, and anti-carsinogenic. C. aeruginosa contains 0.23% essential oils consisting of main components, i.e. germacrone, and 22 minor components [3], saponin, flavonoids, polyphenols, Cycloisolongifolene, 8,9-dehydro formyl, and dihydrocostunolide [4].
Biological activity characteristics of a plant are highly specified by the chemical active compounds or metabolites working in synergy [5]. Anticancer properties of C. aeruginosacausing murine hepatocytes necrosisis suspected affected by 9-methyltetracyclo tetradecane; epicurzerenone; and cis-1,3-dimethyl-2-methylene cyclohexane [6]. Therefore, the consistency or inconsistency of a medicinal plant is influenced by the variations and the levels of metabolites present in the plant. The metabolites variety in a plant is influenced by the growing conditions, type of soil, cultivation environment, as well as harvest time and altitude [7]. With the increasing demand for bioactivity consistency, the standardization process/quality control for plant extracts is needed in order to show the level of one or more target compounds or even untargeted compounds [8-9]. Identification and quantification of targeted and untargeted small metabolite molecules may be done with metabolomics approach [10-11].
Identification in metabolomics study is necessary to give a wider insight of chemical compositions in plants at a certain condition. This technique generally depends on metabolites separation using either Gas Chromatography (GC) or Liquid Chromatography (LC) combined with mass spectrometry (MS) to analyze the metabolites complex. Liquid chromatography is the most popular method to analyze herbal medicines because it is easy to learn and the use is not limited by the sample’s volatility or stability. LC-MS technique doesn't require samples derivatization to group the metabolites under detection, and has proven to detect various classes of metabolites [12]. LC-MS metabolic profiles split up individual chemical component into separated peaks so that minor metabolites may reveal [13]. LC-MS
is commonly used in pharmacokinetic studies, especially in drugs development [14]. LC-MS has been used to identify atractyloside in Callipelis lauerola[15], ginsenocide in the root of Panax ginseng [16], and active substances such as pentacyclic triterpenoid in Centella asiatica[17].
LC-MS analysis produces a large data of spectra or chromatograms. In order to summarize and extract information from those data, the pattern recognition techniques in chemometrics may be used. Furthermore, chemometrics can be used to predict properties of a sample, such as the quality or biological activity [18-19]. Evaluation of LC-MS analysis in relation to the activities of a sample may use chemometrics with Principal Component Analysis (PCA) and Partial Least Square (PLS) techniques. PCA was used in the grouping of Centella asiatica, which was influenced by asiatic acid, asiaticoside, madecassic acid, and madecassoside [17] and characterize the chemical profiles of four different species ofCurcumaeRadix (Yujin) [20]. PLS technique was used to correlate the antioxidant activity and metabolite changes in fermented soybeans analyzed by LC-MS analysis [21]. The purpose of this research is to identify bioactive metabolites in C. aeruginosa from three locations in Java as the center for herbal medicine production by using LC-MS related to their biological activities. The biological activities of C. aeruginosa as antioxidants are determined with CUPRAC method and the toxicity is determined with Brine Shrimp Lethality Test (BSLT).
EXPERIMENTAL SECTION
Materials
Rhizomes ofC. aeruginosawere collected from 3 location in Java, Indonesia. Ethanol p.a (Merck) was used for extraction solvent. Acetonitrile (HPLC grade) was used for eluent of LC-MS. CuCl2•2H2O,
neocuproine ethanolic (Aldrich), ammonium acetate buffer pH 7, and troloxs were used for antioxidant analysis, and Artemia salina was used for toxicity analysis.
Instrumentation
Procedure
Sample preparation and extraction [22]
C. aeruginosa samples were harvested from 3 locations in Java (Nagrak, Cikabayan and Tawangmangu). There were 7 different rhizome samples from each location. Samples were washed, sliced and then dried at 40 °C. Dried rhizomes were pulverized and stored for further analysis.C. aeruginosa samples were extracted by macerating in 70% ethanol. C. aeruginosa (10 g) and 100 mL of 70% ethanol were placed into macerator and soaked in for 24 h in dark place. Next, the macerate was separated from the filtrate with filter paper. The resulting macerates were then dried in rotaryevaporator at 40 °C. The concentrated extracts of C. aeruginosawere ready for further test.
LC-MS analysis
Each C. aeruginosa extract was diluted with methanol. Soluble extract was then filtered using 0.45
micron Millipore filter. Five μL filtrate of the sample was
injected into the LC-ESI-QTOF system.
LC-MS analysis was done by using UPLC-MS equipped with a binary pump. LC is connected to QTOF mass spectrometer coupled to ESI. The MS used was Xevo G2-S QTOF with positive ionization mode. ESI parameters used capillary temperature 120 °C, gas atomizer 50 L/h, and source voltage +2.9 kV. Full scan mode from m/z 100–500 was done with source temperature 41 °C. UPLC column used was Acquity UPLC HSS C18 1.8 μm, 2.1x150 mm. Solvent A was 5
mM ammonium formic; solvent B was 0.1% formic acid in acetonitrile. Solvents were set at a total flow rate of 0.4 mL/min. Isocratic elution system was run at 0–0.5 min with ratio 95:5; linear gradient of solvent A was from 95% to 5% in 15 min.
CUPRAC total antioxidant capacity assay [23]
To 1 mL of 200 ppm C. aeruginosa extract from each location dissolved in 96% ethanol was added 1 mL 0.01 M CuCl2•2H2O; 1 mL 0.0075 M neocuproine
ethanolic; 1 mL ammonium acetic buffer pH 7; and 0.1 mL distilled water. The solution was left for 30 min and the absorbance was measured at 450 nm. A mixture without the extract was used as a blank. Calibration curve was made by using trolox in various concentration. The antioxidant capacity was expressed in µmol trolox/g extract.
Toxicity assay with BSLT [24]
Ready to hatch A. salina eggs (0.5 g) were weighed and then placed into a container containing filtered and aerated sea water. The eggs were left for 48 h under light to fully hatched. The larva from the eggs were then used in toxicity test. Twenty five mg of C.
aeruginosa extract was dissolved in 25 mL sea water. The solution was then diluted into various concentrations. Ten larvas in 1 mL sea water were then placed into a multiwell plate and added with 1 mL C. aeruginosaextract. This was made in 3 replicates. The multiwell plate was covered with alumunium foil and incubated for 24 h. Value lethal concentration 50% (LC50) was determined using the relationship curve
between extract concentrations (x-axis) with a mean percent mortality of shrimp larvae (y-axis).
LC-MS chromatogram data processing and chemometrics evaluation
Chromatograms were saved in NetCDF format and used to simplify data processing by using MZmine program. Data was processed to identify the metabolite components in C. aeruginosa. Chromatogram from individual C. aeruginosa extract was collected and processed through several steps: filtering, baseline peak, peak detection, deisotope, alignment, gap filling, and normalization [25]. The results after these steps were in the form of array mass data including 3 variables; m/z, retention time and peak intensity.
Identification of metabolites in each sample extract was done by comparing the m/z from the chromatogram with accurate mass from the database natural product for metabolite compounds in Curcuma genus. Sample quality classification was conducted by determining the characteristic metabolites in the sample using PCA and PLS method and then statistically analysed to see the effect of the predicted characteristic compound on the bioactivity.
RESULT AND DISCUSSION
Biological Activity ofC. aeruginosa
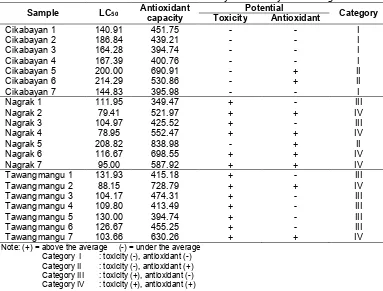
Table 1.The results of antioxidant bioactivity and toxicity ofC. aeruginosa
Sample LC50 Antioxidantcapacity Potential Category
Toxicity Antioxidant
Cikabayan 1 140.91 451.75 - - I
Cikabayan 2 186.84 439.21 - - I
Cikabayan 3 164.28 394.74 - - I
Cikabayan 4 167.39 400.76 - - I
Cikabayan 5 200.00 690.91 - + II
Cikabayan 6 214.29 530.86 - + II
Cikabayan 7 144.83 395.98 - - I
Nagrak 1 111.95 349.47 + - III
Tawangmangu 1 131.93 415.18 + - III
Tawangmangu 2 88.15 728.79 + + IV
Tawangmangu 3 104.17 474.31 + - III
Tawangmangu 4 109.80 413.49 + - III
Tawangmangu 5 130.00 394.74 + - III
Tawangmangu 6 126.67 455.25 + - III
Tawangmangu 7 103.66 630.26 + + IV
Note: (+) = above the average (-) = under the average Category I : toxicity (-), antioxidant (-) Category II : toxicity (-), antioxidant (+) Category III : toxicity (+), antioxidant (-) Category IV : toxicity (+), antioxidant (+) this phenolic compounds to the antioxidant activity is higher than vitamin C, E, and carotenoid.
Toxicity assay is conducted with BSLT method. This method is widely used because of the positive correlation between toxicity and the potential as anticancer based on LC50. LC50 of C. aeruginosa
ethanolic extracts are shown in Table 1. In general, allC. aeruginosa samples have LC50 under 1000 ppm, which
indicate that the C. aeruginosa ethanolic extracts have toxicity activity [27]. From the sitotoxic test, the extracts from Tawangmangu and Nagrak have the same sitotoxic values (113 ppm). C. aeruginosa from Cikabayan has the lowest cytotoxicity value (174 ppm) compared to the twoC. aeruginosa from other locations. Based on Table 1, C. aeruginosa extracts from each location show toxicity activity [28] and have the potential to be anticancer.
Further, the bioactivity of the rhizomes ethanolic extracts is grouped based on the high or low antioxidant and toxicity activity level. The results showed that the samples from the three locations have different level of activities and grouped into different categories (Table 1). The rhizomes from Cikabayan are included in Category I, which have low level of antioxidant and low toxicity activities. The rhizomes from Nagrak are included in Category IV (high level of antioxidant and toxicity activity) and the rhizomes from Tawangmangu are
included in Category III (high toxicity activity, but low antioxidant level).
Identification of Bioactive Components of C. aeruginosaRhizome by LC-MS
LC–ESI-QTOF MS fingerprint was used to identify chemical components of C. aeruginosa ethanolic extract. Five of 7 samples each region that had similar category were analyzed by LCMS. The fingerprint could be used to determine metabolite compositions in C. aeruginosa from the 3 different locations. LC-MS chromatograms of C. aeruginosa from the 3 locations are shown in Fig. 1. The pattern of the resulted chromatograms are similar that it is assumed the bioactive components of C. aeruginosa from the 3 locations are the same. However, the level of each metabolite component is different. It can be seen by the % area relatively different.
Fig 1.Chromatogram of LC-ESI-QTOF MS ofC. aeruginosaethanolic extracts
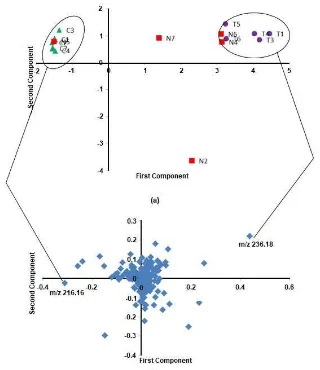
Fig 2.PCA Score plot (a) and loading plot (b) analysis forC. aeruginosaextracts
the processing of data and requiring simplification with MZmine software. This process of simplification will eliminate background shifting and noise in the
mass to theoritical m/z of Curcumametabolites found in literature and search results from online public database. Curcuma genus are known to have 211 metabolite compounds divided into 4 main groups: diphenyl-alkanoid, phenylpropanoid derivatives, terpenoid, and other compounds [29]. It is identified total 175 predicted metabolites of C. aeruginosa from Cikabayan, Nagrak and Tawangmangu, 153 of which are categorizedas sesquiterpene of the Curcuma genus. The similarity in the metabolite compounds amount is not offset by the level of each metabolite components. This level difference may be seen from the % relative area of each peak resulted.
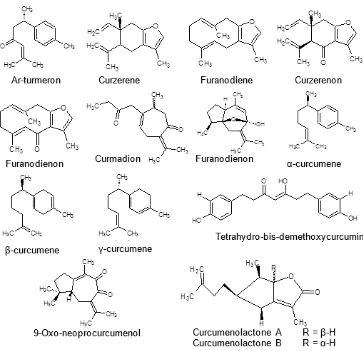
Based on the % relative area, it may be determined the dominant predicted compounds. The compounds are compounds with ion mass of 216.159, 230.138, and 234.170. The 216.159 ion mass compounds are predicted to be ar-turmerone, curzerene, or furanodiene. The 230.138 ion mass compounds are predicted to be curzerenone, 5-epi-curzerenone, furanodienone, or isofuranodienone. While, curmadione, curcumenone, isocurcumadione, dehydrocurdione, germacrone 4,5-epoxide, 13-hydroxygermacrone, curcumenol, epi-curcumenol, 4-epi-curcumenol, isocurcumenol, neocurcumenol, isoprocurcumenol, neoprocurcumenol, 4-hydroxy-7(11), 10(14)-guaiadien-8-one, curcumanolide A, curcumanolide B, gajutsulactone A, or gajutsulactone B is predicted for 234.170 ion mass compounds.
Area of Samples Categorizing Based on Metabolites Composition
Area of samples categorizing based on metabolites composition was done with PCA. Data processing analysis from 15 samples produced 781 ion mass variables, where 201 of which could be identified as predicted metabolite compounds from Curcuma genus. PCA was done by using the 781 variables of ion mass. The first 3 principle components (PCs) from the variables represented 75.7% of total varians (PC1 = 54.5%, PC2 = 12.5%, and PC3 = 8.8%). This result showed that the three components were sufficiently effective to categorize samples with clear characteristics. C. aeruginosa categorizing based on location was described in score plot. Samples showing similarity in metabolite profiles will be grouped together, and samples showing different profiles will make new groups [27]. PC1/PC2 scoreplot (Fig. 2) gave 2 groups. Score plot showed good separation among different sample varieties according to the sample’s locations of origin. Samples from Cikabayan tended to form a group in PC 1, but Nagrak 5 was present as an outlier. Samples from
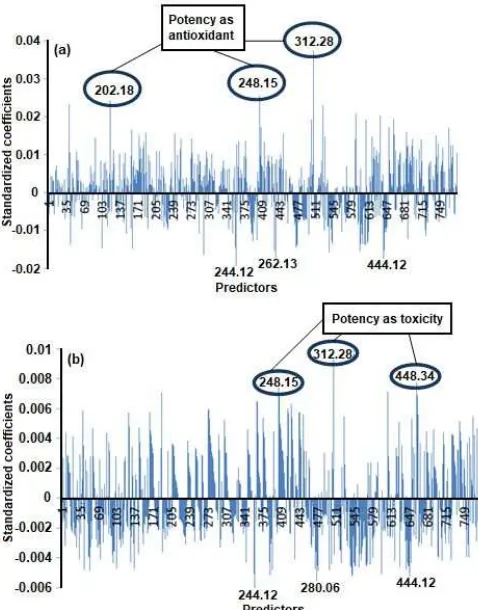
Fig 3.PLS Standardized Coefficient Plot with response as antioxidant (a) and toxicity (b) ofC. aeruginosa
Tawangmangu tended to form a groupin PC1 and PC2, with 3 samples from Nagrak included. The presence of samples from Nagrak in Cikabayan and Tawangmangu groups showed that rhizomes from Nagrak did not have clear characteristics and they tended to distribute in the score plot.
Fig 4.Structure of proposed compounds inC. aeruginosaextracts
Correlation between Metabolites Composition in C. aeruginosaand Antioxidant Activity
PLS analysis was conducted to see the relation between the chemical composition and antioxidant activity of C. aeruginosa. PLS could detect the relation and provide a model useful to give a prediction [29]. PLS modeling uses all ion mass variable data as the predictor and antioxidant or toxicity activities values as the response. In order to find the correlation between the antioxidant activity and the ion mass variables, the correlation coefficient (R) was calculated. The optimal amount of PLS factor for the prediction of yield value is 1. The R–square resulted was 0.9136.
PLS standardized coefficient is used for the identification of compounds influencing, positively and negatively, the bioactivity. Fig. 3a showed that antioxidant activity is strongly positively related to the compounds with ion mass of 312.28, 248.15, and 202.18. Compounds with m/z of 312.28 have the highest standardized coefficient value and are predicted to be
tetrahydro-bisdemethoxycurcumin that give positive influence to the antioxidant activity. Compounds with m/z of 248.15 have the second highest standardized coefficient value and are predicted to be 9-oxo-neopro
curcumenol,
7α,11α,-epoxy-5β-hydroxy-9-guaiaen-8-one, curcumenolactone A, or curcumeno lactone B (Fig. 4).The presence of those compounds will increase the antioxidant potential. In contrast, compounds with ion mass of 262.13, 444.12, and 244.12 give negative influence to the antioxidant activity.
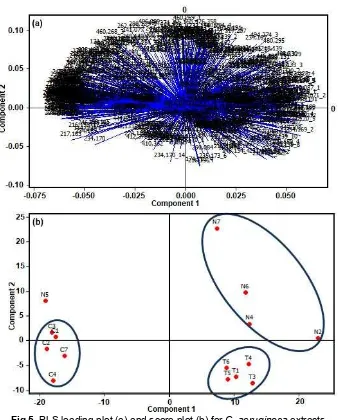
Fig 5.PLS loading plot (a) and score plot (b) forC. aeruginosaextracts
Correlation between Metabolites Composition in C. aeruginosaand Toxicity
Similar to the compounds having the potential as an antioxidant, the correlation between toxicity and ion mass variables was determined with PLS. The R value obtained from the model was 0.8175. Based on the standardized coefficient plot (Fig. 3b), compounds with ion mass of 312.28, 448.34, and 248.15 give positive influence to the toxicity. The presence of these compounds will increase the anticancer potential. The increase in the antioxidant and toxicity activities of C. aeruginosa is suspected to be influenced by the presence of compounds with ion mass of 312.28, which was predicted to tetrahydro-bisdemethoxycurcumin (Fig. 4). In contrast, the decrease in the toxicity activity is influenced by the compounds with ion mass of 444.12, 280.06, and 244.12.
Similar to the compounds having the potential as an antioxidant, compounds with positive potential as having toxicity is found in the quadrant for C. aeruginosa from Nagrak, which have higher toxicity (Fig. 5). The compounds with ion mass of 312.28, 448.34, and 248.15 are considered as biomarkers for toxicityof C. aeruginosa. Compounds with ion mass of 312.275 and 248.15 have the highest antioxidant and toxicity activities.
CONCLUSION
sesquiterpene group. PCA technique categorized by their location of origin the samples into two groups. PLS showed an accurate correlation between biological activity and metabolite compositions.
REFERENCES
[1] Atun, S., Arianingrum, R., Aznam, N., and ab Malek, S.N., 2016, Isolation of sesquiterpenes lactone from Curcuma aeruginosa rhizome and the cytotoxic activity against human cancer cell lines, Int. J. Pharmacogn. Phytochem. Res., 8 (7), 1168–1172. [2] Setiyono, A., and Bermawie, N., 2013, Potensi
tanaman obat untuk penanggulangan flu burung: Uji in vitro pada sel vero,J. Sains Veteriner, 31 (1), 27– 34.
[3] Theanphong, O., Mingvanish, W., and Kirdmanee, C., 2015, Chemical constituents and biological activities of essential oil from Curcuma aeruginosa Roxb. rhizome,Bull. Health Sci. Technol., 13 (1), 6– 16.
[4] Kamazeri, T.S.A.T., Abd Samah, O., Taher, M., Susanti, D., and Qaralleh, H., 2012, Antimicrobial activity and essential oils of Curcuma aeruginosa, Curcuma mangga, and Zingiber cassumunar from Malaysia,Asian Pac. J. Trop. Med., 5 (3), 202–209. [5] Liang, X.M., Jin, Y., Wang, Y.P., Jin, G.W., Fu, Q.,
and Xiao, Y.S., 2009, Qualitative and quantitative analysis in quality control of traditional Chinese medicines, J. Chromatogr. A, 1216 (11), 2033– 2044.
[6] Hestianah, E.P., Kusumawati, I., Suwanti, L.T., and Subekti, S., 2014, Toxic compounds of Curcuma aeruginosa causes necrosis of mice hepatocytes, Univ. Med., 33 (2), 118–125.
[7] Yi, L.Z., Yuan, D.L., Liang, Y.Z., Xie, P.S., and Zhao, Y., 2007, Quality control and discrimination of pericarpium citri reticulatae and pericarpium citri reticulatae viride based on high-performance liquid chromatographic fingerprints and multivariate statistical analysis, Anal. Chim. Acta, 588 (2), 207– 215.
[8] Rohaeti, E., Rafi, M., Syafitri, U.D., and Heryanto, R., 2015, Fourier transform infrared spectroscopy combined with chemometrics for discrimination of Curcuma longa,Curcuma xanthorrhizaandZingiber cassumunar,Spectrochim. Acta, Part A, 137, 1244– 1249.
[9] Wang, Y., Tang, H., Nicholson, J.K., Hylands, P.J., Sampson, J., Whitcombe, I., Stewart, C.G., Caiger, S., Oru, I., and Holmes, E., 2004, Metabolomic strategy for the classification and quality control of phytomedicine: A case study of chamomile flower (Matricaria recutita L.), Planta Med., 70 (3), 250– 255.
[10] Wishart, D.S., and Greiner, R., 2007, Computational approaches to metabolomics: An introduction,Pac. Symp. Biocomput., 12, 112–114. [11] Patti, G.J., Yanes, O., and Siuzdak, G., 2012, Innovation: Metabolomics: The apogee of the omics trilogy, Nat. Rev. Mol. Cell Biol., 13 (4), 263–269.
[12] De Vos, R.C., Moco, S., Lommen, A., Keurentjes, J.J., Bino, R.J., and Hall, R.D., 2007, Untargeted large-scale plant metabolomics using liquid chromatography coupled to mass spectrometry, Nat. Protoc., 2 (4), 778–791.
[13] Farag, M.A., Porzel, A., and Wessjohann, L.A., 2012, Comparative metabolite profiling and fingerprinting of medicinal licorice roots using a multiplex approach of GC-MS, LC-MS and 1D NMR techniques,Phytochemistry, 76, 60–72. [14] Khairan, Jenie, U.A., and Sudiyo, R.S., 2009,
Fragmentation studies of Δ6,7-Anhidroeritromisin-A
by Liquid Chromatography-Mass Spectroscopy (LC-MS),Indones. J. Chem., 9 (3), 491–499. [15] Steenkamp, P.A., Harding, N.M., van Heerden,
F.R., and van Wyk, B.E., 2006, Identification of atractyloside by LC–ESI–MS in alleged herbal poisonings,Forensic Sci. Int., 163 (1-2), 81–92. [16] Lee, D.Y., Kim, J.K., Shrestha, S., Seo, K.H., Lee,
Y.H., Noh, H.J., Kim, G.S., Kim, Y.B., Kim, S.Y., and Baek, N.I., 2013, Quality evaluation of panax ginseng roots using a rapid resolution LC-QTOF/MS-based metabolomics approach, Molecules, 18 (12), 14849–1486.
[17] James, J.T., Tugizimana, F., Steenkamp, P.A., and Dubery, I.A., 2013, Metabolomic analysis of methyl jasmonate-induced triterpenoid production in the medicinal herb Centella asiatica (L.) urban, Molecules, 18 (4), 4267–4281.
[18] Tanaka, K., Arita, M., Sakurai, H., Ono, N., and Tezuka, Y., 2015, Analysis of chemical properties of edible and medicinal ginger by metabolomics approach,Biomed Res. Int., 671058.
[19] Farrés, M., Piña, B., and Tauler, R., 2016, LC-MS based metabolomics and chemometrics study of the toxic effects of copper on Saccharomyces cerevisiae,Metallomics, 8 (8), 790–798.
[20] Liu, F., Bai, X., FQ, Yang, F.Q., Zhang, X.J., Hu, Y., Li, P., and Wan J.B., 2016, Discriminating from species of Curcumae Radix (Yujin) by a UHPLC/Q-TOFMS-based metabolomics approach, Chin. Med., 11, 21.
[22] Anonymous, 2005, Badan Pengawas Obat dan Makanan Republik Indonesia, BPOM RI, Jakarta. [23] Apak, R., Güçlü, K., Özyürek, M., and Çelik, S.E.,
2008, Mechanism of antioxidant capacity assays and the CUPRAC (cupric ion reducing antioxidant capacity) assay,Microchim. Acta, 160 (4), 413–419. [24] Krishnaraju, A.V., Rao, T.V.N., Sundararaju, D., Vanisree, M., Sheng Tsay, H.S., and Subbaraju, G.V., 2005, Assessment of bioactivity of Indian medicinal plants using brine shrimp (Artemia salina) lethality assay, Int. J. Appl. Sci. Eng., 3 (2), 125– 134.
[25] Theodoridis, G.A., Gika, H.G., Want, E.J., and Wilson, I.D., 2012, Liquid chromatography-mass spectrometry based global metabolite profiling: a review,Anal. Chim. Acta, 711, 7–16.
[26] Maisuthisakul, P., Pasuk, S., and Ritthiruangdej, P., 2008, Relationship between antioxidant properties
and chemical composition of some Thai plants,J. Food Compos. Anal., 21 (3), 229–240.
[27] Olowa, L.F., and Nuñeza, O.M., 2013, Brine shrimp lethality assay of the ethanolic extracts of three selected species of medicinal plants from Iligan City, Philippines, Int. Res. J. Biol. Sci., 2 (11), 74–77.
[28] Kim, E.J., Kwon, J., Park, S.H., Park, C., Seo, Y.B., Shin, H.K., Kim, H.k., Lee, K.S., Choi, S.Y., Ryu, D.Y., and Hwang, G.O., 2011, Metabolite profiling of Angelica gigas from different geographical origins using1H-NMR and UPLC-MS
analyses, J. Agric. Food. Chem., 59 (16), 8806– 8815.