MONITORING THE IMPACTS OF EL NIÑO ON THE EXTENT OF CULTIVATED
FIELDS USING SAR DATA AROUND THE AGRICULTURAL REGION OF THE FREE
STATE, SOUTH AFRICA
A. Ngie 1, 2 *, S. Tesfamichael1, F. Ahmed 2
1
Department of Geography, Environmental management and Energy Studies, University of Johannesburg, PO Box 524 Auckland Park Johannesburg, 2006, South Africa - (angie, stesfamichael)@uj.ac.za
2
School of Geography, Archaeology and EnvironmentalStudies, University of the Witwatersrand, Private Bag 3, WITS, 2050, South Africa - fethi.ahmed@wits.ac.za
37th International Symposium of Remote Sensing on Environment, ISRSE37
KEY WORDS: Backscatter, cultivated fields, El Niño, sensitivity, Sentinel-1
ABSTRACT:
There is continuous challenge in crop monitoring from erratic climatic phenomena such as irregular rainfall episodes during required farming seasons or cloud cover. Remote sensing has offered vital support in the monitoring of such scenarios and informs relevant authorities for better decision making. While optical sensors measure the greenness of vegetation to enable monitoring of its status, their usage is constrained by the continuous cloud cover during crop growth seasons in sub Saharan Africa. Synthetic aperture radar data (SAR) are on the other hand capable of penetrating clouds and are sensitive to the structure and moisture content of target features, thereby providing complementary information for monitoring crop cultivated fields. This study sought to evaluate the sensitivity of Sentinel -1 SAR data to the status of cultivated crop fields that experienced varying rainfall amounts between 2015/2016 and 2016/2017 growing seasons as a result of El Niño induced drought in 2015. Dual polarization composites per season were classified and through sample farms delineated from Google Earth image, backscatter values were extracted for statistical comparisons. The two sample t-test was applied to test significance of the differences between the two seasons at the level of farm status. Results showed an overall significant difference (p-value of 0.003< 0.005) in SAR backscatter sensitivity to cultivated crop fields during and after the El Niño phenomenon. While these results are encouraging for areas that experience clouds during growing seasons, further improvements can be expected by factoring in other variables such as topographic and moisture conditions of farms.
* Corresponding author
1. INTRODUCTION
Crop monitoring is an important aspect in managing food security challenges. The monitoring of field crops through space technologies is frequently hampered by unprecedented climatic conditions. Researchers usually face daunting task in monitoring summer or rain-fed crops through optical remote sensing because of extensive cloud cover. However, radar remote sensing overcame this challenge since it measures the backscattering from the objects as opposed to reflectance energy onto the objects as in the case of optical remote sensing (Lillesand et al., 2008; Balzter et al., 2015). Recent developments in radar technologies are translating to the generation of earth observation data with improved capacity for research in food security in relation to crop monitoring.
The freely available sentinel satellite product provided by the European Space Agency (ESA) has facilitated research on mapping earth’s dynamic surface coverage from urban landcover (Abdikan et al., 2016; Fonteh et al., 2016) to crop areas across different seasons (Lavreniuk et al., 2016), and even crop specific monitoring (Chen et al., 2016). The above studies have used the standard image classification methods onto the pixel values to show various features of interest. There has been the use of the single polarization data sets (VH or VV) as well as the dual polarization (combining VH and
VV) and in comparison proven the latter resulted to better classification accuracy (Abdikan et al., 2016).
The El Niño events of 2015 culminated in drier than average drought-induced conditions that extended into March 2016 was considered one of the strongest in the last 20years to have hit the Southern African region (WFP, 2015). The event caused severe rainfall deficits that affected core crop growing season from January to March of 2016 with the latter being a critical maize crop development stage. This study then seeks to evaluate the sensitivity of the Sentinel-1 synthetic aperture radar (SAR) data in monitoring farm status for summer field crop cultivation as a result of the El Niño induced drought of 2015/2016 farming season in comparison with the 2016/2017 season with good rainfall over the northern parts of the Free State. This comparison is to be done by assessing farm status during the drought-induced season and the normal rainfall season.
2. MATERIALS AND METHODS
2.1 Study area
is situated within the “Maize Triangle” of South Africa. The northern section of the Free State boosts itself as the ‘grain basket’ of not just the country but also the Southern African region. The main summer field crops grown in this area are maize, soybeans and sorghum. The annual rainfall over this area is about 550 mm and is predominantly in summer (October to March) with maximum rainfall month being January (103 mm) and minimum being July (0 mm). The daily temperatures might rise to a maximum of 27° C during the summer months and the daily minimum temperatures can drop below 0° C during the winter months of June through to July (SA Explorer, 2015).
Figure 1: Study area within the Free State province of South Africa (image is a multiple composite SAR of VV, VH and
abs(VV*VH)
2.2 Data acquisition and pre-processing
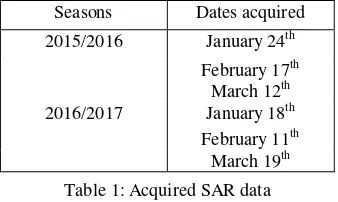
The Sentinel-1 is a Synthetic Aperture Radar (SAR) data and was acquired through the European Space Agency (ESA) for summer cropping seasons in January to March of 2016 and 2017 along descending orbit over the northern section of the Free State. The Sentinel-1A SAR instrument operates at 5.405 GHz imaging frequency of the C-band, containing the VH and VV polarizations with a revisit cycle of 12 days. The geometric resolution of Sentinel-1 is 10m.
Seasons Dates acquired
Table 1: Acquired SAR data
The Sentinel-1A data that was acquired as Level-1 Ground Range Detected (GRD) product downloaded through Scientific
Data Hub of Sentinels
pre-processing that was done with the Sentinel Application Platform (SNAP software 5.0) S-1 Tool box through the various steps;
1. The radiometric calibration that enables the conversion of the VH/VV amplitude digital pixel values to the sigma naught (σ°) values,
2. There is the presence of inherent noise or speckles on the data as a result of constructive and deconstructive interferences of reflected signals. The presence of
such speckles might interfere with the classification of the image (Lu et al., 2008). It is therefore, necessary to suppress such noises and in this case the 3X3 Lee filter was applied.
3. The filtered images had to undergo terrain correction through the Range Doppler Terrain Correction using a 30m DEM. The processed SAR data was exported into the Geotiff format for further analysis in ENVI 5.0 and ArcMap 10.3.
A multi-temporal dual polarization composite dataset for the drought-induced (2015/2016) and the normal-rainfall seasons (2016/2017) were created through stacking of the 3 images per season. The dual polarization options used in this study included the difference (VV-VH), ratio (abs(VV/VH)) and multiple (abs(VV*VH)). The composite made of multiple produced better classification accuracy in this study and was used for further statistical analyses.
2.3 Image classification
The preparation for supervised classification of the multi-temporal images required the Jeffries Matusita (J-M) distance index to test separability of the six classes being mapped out in this study. These classes included settlement, crop fields, bareland, uncropped fields, open grassland and water body. The index assesses through statistical patterns that measure the average distance between two class densities to ascertain separability (Richards & Jia, 2006). The acceptable threshold value for separability between pairs in remote sensing is ≥ 1.6 as the value lies within 0 to 2 (Schmidt & Skidmore, 2003) and this study realized a value ≥ 1.78.
The Random forest algorithm was chosen for classification as it is insensitive to noise and overtraining (Breiman, 2001). Through a detailed visual examination, training data samples for each class were identified from the images. Then the classification algorithm was applied to the dual polarized images based on the determined training patterns and reference materials. A classification performance assessment was done through a confusion matrix with the various accuracy parameters derived including the producer’s, user’s and overall accuracies (PA, UA and OA). This was performed with the digitized polygons or fields (90) from Google Earth for the study area.
2.4 Statistical analysis
(1)
where t-test
, = means
, = standard deviations
, = sample sizes of the 2015/2016 and 2016/2017 growing season
3. RESULTS AND DISCUSSION
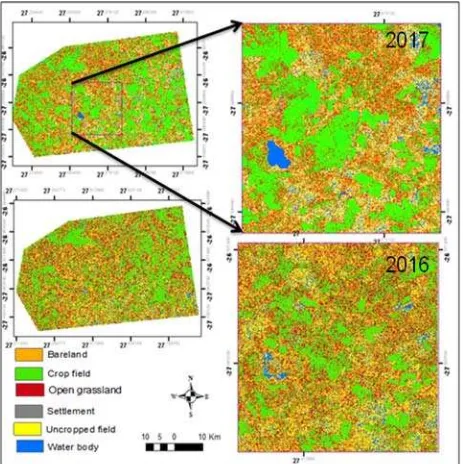
The classification of the multi-temporal composite SAR images per season (Figure 2) yielded overall accuracy assessments of 71.3% and 75.9% for the drought-induced 2016 season and normal-rainfall 2017 season respectively. The difference in classification accuracies was as a result of misclassification of crop fields as either uncropped fields or open grassland and in some cases as bareland in the 2016 image. The drought-induced conditions experienced over this area could account for the reduction in both soil and plant moisture thereby leading to either dried and unavailable vegetation. There were also incidences of crop failure that the fields were also misclassified as bareland.
Figure 2: Classified dual polarised composite images of 2016 and 2017
The classified fields as uncropped or bareland on 2016 became classified as crop fields on the 2017 image as more clearly illustrated by the highlighted regions in Figure 3. The mean comparison for both seasons was difference as most of the fields in 2016 recorded higher backscatter values than in 2017. In areas where the class difference was a main switch like bareland or open grassland to crop fields, the mean difference was greater than in a case with the same class over both seasons (Figure 3).
Figure 3: Mean backscatter values comparing between 2016 and 2017 over delineated fields
Figure 4: Mean backscatter data distribution for both seasons
Figure 5: Mean comparison of classes for both season
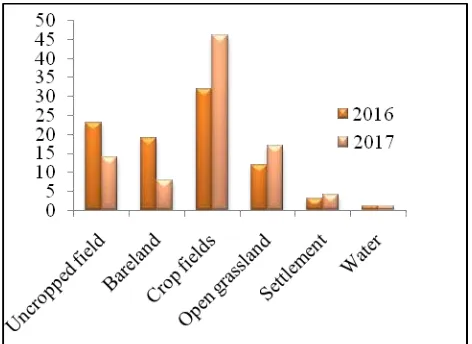
season (2016). An example is the lake that is clearly visible on the classified image of 2017 whereas it was classified as bareland in 2016 (Figure 2). However, the class comparison over both seasons did not show any difference in water body (Figure 6) because within the area they were limited.
Figure 6: Comparison of the different classes over both seasons
Backscatter values are characterised by the different land cover types or even different conditions of the same field at different seasonal changes. These backscatter values can then contribute in the assessment of the field status as a result of the El Nino event over this area. Backscatter variability temporarily at pixel level was calculated for each delineated field for both seasons. Temporal variability of the crop fields was of particular interest among all classes for the scope of this study.
SAR data is known to be sensitive not just to cover type but also structure of the objects which contribute to the volume of the scattering process (Cloude, 2010; O’Grady et al., 2013). This concept was linked to the backscatter values recorded for some of the permanent classes such as settlement, waterbody and even the crop fields on the 2016 classified composite image. The backscatter volume in vegetated areas like that of this current study proved that more stable variations will be recorded over dense and deeply-rooted vegetation than the reverse scenario (Mtamba et al., 2015). This could account for the significant difference in the backscatter values between2016 and 2017 which was greatly influenced by a climatic event that impacted on not just the soil water moisture but also the density of the cultivated or crop fields.
In some cases the bareland was misclassified as water body in the 2017 composite and which could be attributed to the moisture contents in the soils during this season of good rainfall as well as ponding water on both the cropped and uncropped fields. It should be noted that some of the classes such as bareland and uncropped fields as well as the open grassland areas especially those of sparse coverage were hardly differentiated by the backscatter values. Hence, there would be a need for more robust methodological approaches on such data to enable easy differentiation of classes as such. Some of the methodological propositions have been along the lines of polarimetric parameters such as dominant alpha.
4. CONCLUSIONS
The evaluation of SAR S1 data sensitivity to the status of farms (cultivated with crops, cultivated without crops and open grassland) through statistical comparison of their backscatter values during a drought-induced summer season and a normal rainfall season was successfully attained an overall significant difference (p-value of 0.007 < 0.05) in SAR backscatter sensitivity to cultivated crop fields during and after the El Niño phenomenon. While these results are encouraging for areas that experience clouds during growing seasons, further improvements can be expected by factoring in other variables such as topographic and moisture conditions of farms.
ACKNOWLEDGEMENTS (OPTIONAL)
We acknowledge the Universities of Johannesburg and Witwatersrand for the funding support received for my fellowship and sponsorship to the symposium.
REFERENCES
Abdikan, S., Sanli, F.B., Ustuner, M. Calò, F., 2016. Land cover mapping using Sentinel-1 SAR data. In: The International Archives of the Photogrammetry, Remote Sensing
and Spatial Information Sciences, Prague, Czech Republic,
Vol. XXIII, XLI-B8, pp. 757-761.
Breiman, L., 2001. Random forests. Machine Learning, 4(45), pp. 5-32.
Chen, C.F., Son, N.T., Chen, C.R., Chang, L.Y., Chiang, S.H., 2016. Rice crop mapping using Sentinel-1A phenological metrics. In: The International Archives of the Photogrammetry,
Remote Sensing and Spatial Information Sciences, Vol. XXIII,
XLI-B8, pp. 863-865.
Cloude, S., 2010. Polarisation: Applications in Remote Sensing. Oxford University Press.
Exelis Visual, I., 2012. ENVI 5.0. Boulder, Colorado: Exelis Visual Information Solutions.
Fonteh, M.L., Fonkou, T., Lambi Cornelius, M., Main, R., Ramoelo, A., Cho, M., 2016. Assessing the utility of Sentinel-1 C band synthetic aperture radar imagery for land use land cover classification in a tropical coastal systems when compared with Landsat 8. Journal of Geographic Information System, 8, pp. 495-505.
Lavreniuk, M., Lemoine, G., Kussul, N., 2016. Crop classification strategies using hybrid Sentinel-1, Sentinel-2 and Landsat-8 data series in UKRAINE. Living Planet symposium, 9-13 May 2016, Prague Czech Republic.
Lillesand, T.M., Kiefer, R.W., Chipman, J.W., 2008. Remote sensing and image interpretation. (6th ed.). NJ: Wiley.
Lu, D., Batistella, M., Moran E., de Miranda, E.E., 2008. A comparative study of Landsat TM and SPOT HRG images for vegetation classification in the Brazilian Amazon.
Photogrammetric Engineering and Remote Sensing, 70, pp.
Mtamba, J., Van der Velde, R., Ndomba, P., Zoltan, V., Mtalo, F., 2015. Use of Radarsat-2 and Landsat TM images for spatial parameterization of mining’s roughness coefficient in hydraulic modelling. Remote Sensing, 7(1), pp. 836-864.
O’Grady, D., Leblanc, M., Gillieson, D., 2013. Relationship of local incidence angle with satellite radar backscatter for different surface conditions. International Journal of Applied
Earth Observation and Geoinformation 24, pp. 42-53.
Richards, J.A., Jia, X., 2006. Remote Sensing Digital Image Analysis: An Introduction (4th ed.). Berlin: Springer-Verlag.
Schmidt, K., Skidmore, A., 2003. Spectral discrimination of vegetation types in a coastal wetland. Remote Sensing of Environment, 85, pp. 92-108.
World Food Programme (WFP), 2015. El Nino: Implications and Scenarios for 2015/16. VAM food security analysis. A WFP publication.