LARGE-SCALE INDICATIVE MAPPING OF SOIL RUNOFF
E. Panidi 1, *, L. Trofimetz 2, J. Sokolova 1, E. Kunaeva 1, 3
1 Department of Cartography and Geoinformatics, Saint Petersburg State University, St. Petersburg, Russia – [email protected], [email protected], [email protected], [email protected]
2 Department of Geography, Orel State University, Orel, Russia – [email protected]
3 Department of Natural Science and Geography, Pushkin Leningrad State University, St. Petersburg, Russia
KEY WORDS: Soil Runoff, Cesium-137, DEM Analysis, Microrelief Mapping
ABSTRACT:
In our study we estimate relationships between quantitative parameters of relief, soil runoff regime, and spatial distribution of radioactive pollutants in the soil. The study is conducted on the test arable area located in basin of the upper Oka River (Orel region, Russia). Previously we collected rich amount of soil samples, which make it possible to investigate redistribution of the Chernobyl-origin cesium-137 in soil material and as a consequence the soil runoff magnitude at sampling points.
Currently we are describing and discussing the technique applied to large-scale mapping of the soil runoff. The technique is based upon the cesium-137 radioactivity measurement in the different relief structures. Key stages are the allocation of the places for soil sampling points (we used very high resolution space imagery as a supporting data); soil samples collection and analysis; cali bration of the mathematical model (using the estimated background value of the cesium-137 radioactivity); and automated compilation of the map (predictive map) of the studied territory (digital elevation model is used for this purpose, and cesium-137 radioactivity can be predicted using quantitative parameters of the relief). The maps can be used as a support data for precision agriculture and for recultivation or melioration purposes.
* Corresponding author
1. INTRODUCTION
Precision agriculture (or precision farming) is a domain that is formed due to the implementation of geographic information technologies and geographic information systems (GISs), global navigation satellite systems (GNSSs), and computerized control and management systems into the agricultural sector. Precision agriculture takes into consideration the heterogeneity of the soil cover, to propose spatially differentiated schema of agriculture production, depending on local features of cultivated lands. Therefore, at the initial stage of precision agriculture techniques implementation, it is necessary to prove the spatial heterogeneity character for agrochemical parameters of the soil on cultivated area.
Analysis of dependencies on large-scale between soil and microrelief allows to establish this heterogeneity. Its nature can be different, however the microrelief is one of most valuable factors, which allow to provide indirect estimations for soil parameters through the analysis of the microrelief parameters. For example, some studies prove soil-microrelief interdependencies as consequence of genetic reasons, namely paleocryogenesis in the periglacial regions of the Northern forest-steppe of Russia (Velichko, 1964; Berdnikov, 1975; Alifanov et al., 2010). In this region, microrelief is formed by polygonal blocks. These block microelevations and interblock microdepressions are well recognized on the watershed surfaces of arable areas using very high resolution satellite imagery. The slopes are dotted usually with ravine-type microrelief structures, which compose modern erosion network. Microrelief-dependent soil moisture, insulation, formation of soil fertility are differentiated significantly due to such a complex differentiation of slope surfaces.
These dependencies are mediated by the influence on soil erosion processes. Soil runoff determines the loss of nutrients. The runoff depends on the position of the point on the microrelief surface. Radiocesium method (Walling, He, 1999; Golosov, 2000; etc.) is a method allowing to study the processes of soil runoff and accumulation on arable slopes. Its errors are caused mostly by the imperfection of the instruments used to measure the soil radioactivity. Detection limit for cesium-137 in the soil material is 3 Bq per sample, and the detection error is 10-20%.
However, previously we recognized that the erosion forms of microrelief, which were formed more than 10000 years ago (ancient microravines), are not identified (interpreted) fully on topographic maps of 1:10000 scale (used typically in land management). Moreover, modern streams (which run in the periods of snowmelt and rainfall) are not reflected on the maps. These streams have the lengths comparable to microravines, but are not coincide with thalwegs of microravines (Trofimetz, Panidi, 2015; Panidi et al., 2016c). After spring, ploughing thalwegs of the modern streams are well recognized visually on the slope surface, while ancient microravines are not. This allow to make suggestion about that the erosion work composed of modern streams is active (possibly more active) then erosion work composed of microravines. We revealed that these streams do not change positions of the streambeds after plowing (are not destroyed, as stated in some publications). Our earlier studies showed that the erosion activity of modern streams is comparable to erosion activity of ancient microravines and in some cases exceeds it (Trofimetz, Panidi, 2015).
The International Archives of the Photogrammetry, Remote Sensing and Spatial Information Sciences, Volume XLII-3/W2, 2017 37th International Symposium on Remote Sensing of Environment, 8–12 May 2017, Tshwane, South Africa
This contribution has been peer-reviewed.
2. DATA AND METHODS
In our studies, we are working on computational technique for estimation of soil runoff in the thalwegs of modern streams on the arable slopes. We use estimations of geomorphometric parameters of the microrelief to evaluate soil-microrelief interdependencies and to design computational model for soil runoff.
Two challenges can be mentioned in connection to this. The first one is the design of computational model for the thalwegs of modern streams in addition to the thalwegs of ancient microravines basing on the field data collected on test area (topographic survey and measurements of the cesium-137 radioactivity in the soil material). The second is to offer correction coefficients to correct the estimations of soil runoff in ancient microravines, to consider soil runoff in the modern gray forest soils on loessial bedrock. Loess deposits can also be an additional reason for development of complex network of the modern streams.
Figure 1. WorldView-2 satellite image of the test area, image collected on May 19, 2012 (image is courtesy of the
DigitalGlobe Foundation)
2.2 Soil Runoff Estimation
To estimate the soil-microrelief interdependencies we used digital elevation model (DEM) that was produced in ArcGIS from 1:10000 scale topographic map. Additionally, the catchment area (Costa-Cabral, Burges, 1994) and profile curvature (Moore et al., 1993) gridded maps were produced in GIS SAGA.
Radiocesium method today is based upon the assumption that Chernobyl-origin cesium-137 were mixed in the 20 cm topsoil layer due to the plowing. This plowed layer was washed out partially during the period after Chernobyl accident. Radioactivity of the remaining layer has decreased due to the
mixing with lower "clean" soil layers. Computation of soil loss can be made accordingly to its radioactivity as follows:
)
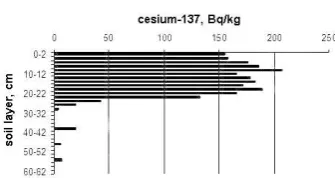
soil sample and the background radioactivity (radioactivity of the soil of block elevations on watershed, 180 Bq/kg for the test area, accordingly to the diagram on Fig. 2)10 = scaling factor
Figure 2. Diagram of cesium-137 radioactivity for different soil layers at the watershed on test area, background radioactivity
value is established accordingly to the radioactivity of 20 cm soil layer (180 Bq/kg)
3. RESULTS
3.1 Estimation of Background Radioactivity
To estimate amount of soil runoff using the radiocesium method, it is necessary to know background cesium-137 radioactivity in the soil material estimated on so-called geomorphologically stable areas, which are used as reference plots. These plots make it possible to establish the etalon cesium-137 radioactivity that is not distorted by runoff or accumulation of soil material. Comparison of this radioactivity value with the measured radioactivity of the soil at other points of the slope surface on the test area enables to estimate an amount of soil runoff or accumulation.
It is recommended to establish reference plots on grass-covered watershed areas where the slope value is not greater than 3 degrees. Test plots should not have microrelief elevations or depressions also. However, in the areas where the paleocryogenic microrelief is distributed on the watershed surfaces, the definition of the background value of cesium-137 radioactivity has its own features. Topographic survey or very high resolution satellite imagery collected in the spring season (Fig. 1) allow to detect structure of the watershed surface and to allocate block elevations and interblock depressions (Panidi et al., 2016a, 2016b).
Selection of reference plots in this case have to be carried out in two steps. First step assumes leveling of watershed surface or analysis of the satellite imagery to allocate block elevations on the watershed surface. Second step incorporates collecting of soil samples on the block elevations only (interblock depressions are excluded) accompanied with GNSS measurements to define coordinates of soil sampling points. Background value of the radioactivity is established using these soil samples. At our test area, we estimated the
The International Archives of the Photogrammetry, Remote Sensing and Spatial Information Sciences, Volume XLII-3/W2, 2017 37th International Symposium on Remote Sensing of Environment, 8–12 May 2017, Tshwane, South Africa
This contribution has been peer-reviewed.
background value of cesium-137 radioactivity as 180 Bq/kg (Fig. 2).
3.2 Estimation of Soil Runoff in Modern Streambeds
To estimate the amount of soil runoff in streambeds of modern streams we conducted topographic survey on the southern aspect slope. The size of the explored area was 40×32 m. This polygon was divided into squares with the step of 2 m. At every node of this grid, the soil samples were collected and the coordinates were allocated using GNSS measurements. The grid made it possible to allocate thalweg of ancient microravine on the slope. Streambed of the modern stream was located near the ravine thalweg. Radiocesium method allowed to conduct a comparative analysis of the cesium-137 radioactivity in the thalwegs of ancient microravine and modern stream. The analysis showed that the soil runoff amount in the streambed of modern stream exceeds the runoff in the ancient ravine up to 15-20%.
Additionally, we collected soil samples in the thalwegs of modern streams on test area, to evaluate the possibility of use of the catchment area map (derived from topographic map of 1:10000 scale) for estimation of the soil runoff in the streambeds of modern streams. This possibility needed to be evaluated due to that the catchment area map reflects the catchment area estimations for ancient landforms, while modern streams are not allocated on initial topographic map.
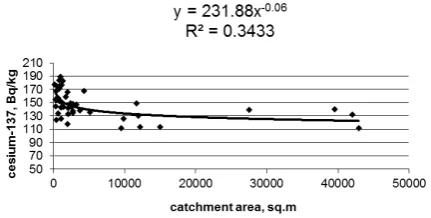
Estimation of interdependences between radioactivity of cesium-137 and catchment area for streams longer than 500 m showed a weak relationship (Fig. 3). This can be explained by the presence of accumulation segments along the streambed where the cesium-137 radioactivity values became greater. This streambed segments has different hydraulic conditions, which cause variability of soil runoff along the streambed. Such segments can be identified using profile curvature map.
Figure 3. Relationship function for the long modern streams (length above 500 m), correlation coefficient is 0.6
For shorter streams, our experiments showed the presence of another interdependence (Fig. 4) with the 0.78 correlation coefficient. In the case when the streams have the lengths up to 150 m (and the catchment areas up to 1000 sq. m), the streambeds are formed along the uniform slope. These results highlight evident need of the differentiated approach when studying erosion activity of the modern streams.
We compared the values of cesium-137 radioactivity estimated for small streams (Fig. 4) with the radioactivity estimated using equations for the thalwegs of microravines with catchment area up to 30000 sq. m (Panidi et al., 2016c). The
comparison demonstrated overestimations from 20% (for flushing areas) to 44% (for accumulation areas), when the radioactivity in the streambeds of modern streams is estimated using equation designed for ancient microravines. In this case, we must use scaling factors of 0.8 for the flushing areas and 0.56 for the accumulation areas. Flushing and accumulation areas are allocated using profile curvature map.
Figure 4. Relationship function for the short modern streams (lengths up to 150 m and catchment areas up to 1000 sq. m),
correlation coefficient is 0.78
Comparison of the values of cesium-137 radioactivity estimated using equation for long streams (Fig. 3) with the values estimated accordingly to equation proposed for thalwegs of the ancient microravines with catchment area up to 30000 sq. m showed compliance of estimations. However, in the cases when modern streams are located in larger microravines (which have above 30000 sq. m catchment area), the overestimation of the equation designed for ancient microravines exceeds 50%, and scaling factor of 0.5 have to be applied.
4. CONCLUSIONS
Modern streams (which run in the periods of snowmelt and rainfall) do not always coincide with the thalwegs of the ancient microravines. Estimation of the cesium-137 radioactivity and amount of soil runoff in the streambeds of modern streams can be carried out basing on the catchment area maps. In the case of absence of the experimental data needed to produce direct estimations for the modern streams, it is possible to use dependencies designed for ancient microravines with up to 30000 sq.m catchment area. All computations can be implemented in any GIS software, which allow raster computations in pixel-by-pixel mode.
ACKNOWLEDGEMENTS
The study was partially supported by Russian Foundation for Basic Research (RFBR), research project No. 15-05-07463 A.
Used satellite imagery are courtesy of the DigitalGlobe Foundation
REFERENCES
Alifanov V.M., Gugalinskaya L.A., Ovchinnikov A.Y., 2010.
Paleocriogenesis and diversity of soils in the central part of the East European plain. Moscow, GEOS, 160 p. (In Russian)
The International Archives of the Photogrammetry, Remote Sensing and Spatial Information Sciences, Volume XLII-3/W2, 2017 37th International Symposium on Remote Sensing of Environment, 8–12 May 2017, Tshwane, South Africa
This contribution has been peer-reviewed.
Berdnikov V.V., 1976. Paleocriogenic microrelief of central part of the Russian plane. Moscow, Nauka, 126 p. (In Russian)
Costa-Cabral M.C., Burges S.J., 1994. Digital Elevation Model Networks (DEMON): A model of flow over hillslopes for computation of contributing and dispersal areas. Water Resources Research, Vol. 30, Issue 6, pp. 1681–1692. doi:10.1029/93WR03512.
Golosov V.N., 2006. Erosional-accumulative processes in river basins on cultivated plains. Moscow, GEOS, 296 p. (In Russian)
Moore I.D., Gessler P.E., Nielsen G.A., Peterson G.A., 1993. Soil attribute prediction using terrain analysis. Soil Science Society of America Journal. Vol. 57, Issue 2. pp. 443–452.
Panidi E., Sokolova J., Trofimetz L., Kunaeva E., 2016a. Mapping of the microrelief structures using multitemporal very high resolution space imagery. Acta Geobalcanica, Vol. 2, Issue 2, pp. 103–109. doi:10.18509/AGB.2016.11
Panidi E., Sokolova J., Trofimetz L., Kunaeva E., 2016b. Satellite imagery applied to mapping of the erosion microrelief structures. SGEM2016 Conference Proceedings, Book 2, Vol. 3, pp. 415–422. doi:10.5593/SGEM2016/B23/S11.053
Panidi E. Trofimetz L. Sokolova J., 2016c. Application of phyto-indication and radiocesium indicative methods for microrelief mapping. IOP Conference Series: Earth and Environmental Science, Vol. 34, Paper ID 012024, 6 p. doi:10.1088/1755-1315/34/1/012024
Trofimetz L.N., Panidi E.A., 2015. Study of soil loss quantity on the arable territories using estimations of soil pollutants migration and geomorphometric parameters of the microrelief.
SGEM2015 Conference Proceedings, Vol. 2, pp. 341–348. doi:10.5593/SGEM2015/B32/S13.046
Velichko A.A., 1964. Relict criogenic morphosculpture of the Russian plain, its scientific and applied value. Proceedings of USSR Academy of Science, Vol. 158, Issue 5, pp. 1078–1081. (In Russian)
Walling D.E., He Q., 1999. Improved models for estimating soil erosion rates from 137Cs measurements. Journal of
Environment Quality, Vol. 28, pp. 611-622.
Revised May 2017
The International Archives of the Photogrammetry, Remote Sensing and Spatial Information Sciences, Volume XLII-3/W2, 2017 37th International Symposium on Remote Sensing of Environment, 8–12 May 2017, Tshwane, South Africa
This contribution has been peer-reviewed.