Full Paper
The Development Method for a Sensitive Simultaneous
Determination of Pb(II), Cd(II) and Zn(II) by Adsorptive
Cathodic Stripping Voltammetry Using Alizarin as a
Complexing Agent
Deswati,* Hilfi Pardi, Hamzar Suyani, Rahmiana Zein, Admin Alif and Tri Widya Edelw
Departmentof Chemistry Faculty of Mathematics and Natural Science, Andalas University, Kampus Limau Manis, Padang 25163, Indonesia
*Corresponding Author, Tel.:+6285263909573; Fax:(0751)71681
E-Mail:[email protected]
Received: 20 August 2016 / Received in revised form: 2 October 2016 / Accepted: 10 October 2016 / Published online: 15 November 2016
Abstract- An adsorptive cathodic stripping voltammetric method is presented for the simultaneous determination of Pb(II), Cd(II) and Zn(II) in tap water with alizarin as a complexing agent. The method is based on adsorptive accumulation of the complexes of Pb(II), Cd(II) and Zn(II) ions with alizarin onto hanging mercury drop electrode (HMDE), followed by the reduction of the adsorbed species by adsorptive cathodic stripping voltammetry (AdCSV). The optimized experimental conditions include: supporting electrolyte (acetate buffer), pH (5), alizarin concentration (0.5 mM), accumulation time (60 s), accumulation potential (-0.2 V). This method has been applied to determine Pb(II), Cd(II) and Zn(II) in tap water. The concentration of metal ion in tap water was obtained Pb(II)
0.045, Cd(II) 20 and Zn(II) 129 μg/L. the detection limit was Pb(II) 0.008, Cd (II) 0.005 and Zn(II) 0.001 μg/L, relative standard deviation was obtained Pb(II) 1.2, Cd(II) 0.4 and Zn(II) 1.12% (n=10), recovery was obtained Pb(II) 99.45, Cd(II) 98.66 and Zn(II) 99.72%. The accuracy of the obtained voltammetric analytical results was validated by comparing with that obtained by the atomic absorption spectrometric method, Concentration of the metal ion
in tap water was obtained with AAS technique Cd(II) 16 μg/L, Zn(II) 115 μg/L and Pb(II)
not detected .
Keywords- Adsorptive cathodic stripping voltammetry, Pb(II), Cd(II), Zn(II), Alizarin
Analytical &
Bioanalytical
Electrochemistry
2016 by CEE
1. INTRODUCTION
Today the protection of natural water to get serious attention in many parts of the world because of the growing threats from pollutants inorganic, organic and biological derived from improper waste disposal. Various compounds that enter the aquatic environment including, heavy metals, pesticides, detergents, particulate matter, and so forth, and heavy metal is a second pollutant after the pesticide, known as a pollutant that is very dangerous and highly toxic. Compared with other toxic pollutants, metals are pollutants that are not biodegradable [1-2]. Heavy metal is a pollutant second, after the pesticide, known as a pollutant that is very dangerous and highly toxic. Compared with other toxic pollutants, metals are pollutants that are not biodegradable [1-2].
Effects of heavy metals can affect directly to accumulate in the food chain although at very low concentrations [3]. If it enters into the human body of heavy metals have a tendency to congregate in organs and could not get out again through the digestive process. Water, land, and air is the medium that can be used for the deployment of heavy metals into the environment. Broad-leafed plants, in addition, to absorb heavy metals from the soil can absorb heavy metals from the air [4]. The heavy metal can be transferred within the reach very far and eventually can affect human health even in periods long enough and far from sources of pollution. Some of the heavy metals that can pollute the environment and is toxic is chromium (Cr), silver (Ag), cadmium (Cd), lead (Pb), zinc (Zn), mercury (Hg), copper (Cu), iron (Fe) , molybdate (Mo), nickel (Ni), tin (Sn), cobalt (Co) and elements belonging to the light metals such as arsenic (as), aluminum (Al) and selenium (Se) [5]. Depending on the concentration, these metals can be harmful or beneficial to human, animals, and plants. Therefore, the need for trace analysis methods was adequate increasingly necessary [3].
Existing methods for the analysis of metal ions such methods Flame Atomic Absorption Spectrometry (FAAS), Graphite Furnace Atomic Absorption Spectrometry (GFAAS) and inductively coupled plasma atomic method of emissions spectrophotometry (ICP-AES). However, this method is costly for operations, maintenance cost are quite expensive and less practical but it also cannot measure the levels of metal ions are very small [6]. Therefore, we need an alternative method that can overcome the limitations of those methods.
time at the stage of pre-concentration before measurement. In Stripping adsorptive voltammetry pre-concentration stage a shorter time, generally less than 1 minute [16].
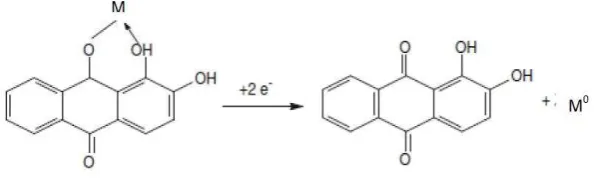
Determination of Pb, Cd and Zn simultaneously to have been done by the method of stripping voltammetry are: adsorptive stripping voltammetry using complex 5-chloro-7-iodo-8-hydroxyquinoline (Clioquinol) [17], anodic stripping voltammetry at a bismuth bulk electrode [18], differential pulse anodic stripping voltammetry at a bismuth/poly(p-aminobenzene sulfonic acid) film electrode [19], Array of peptide-modified electrodes [20], SWASV [21-25]. Alizarin is a natural dye and chelating agent, which has been used successfully in the stripping voltammetric determination of some metals including, Cu (I) and Cu (II) [26], Zn(II) [27], Mo [28], Al(III) [29] In(III) [30]. The observed AdCSV peak is most probably due to the cathodic reduction of ion metals in the adsorbed complex with alizarin and the electrochemical mechanism of the reduction process of alizarin–ion metals complex is illustrated in Fig. 1 [28]
Fig. 1. Mechanism of the electrochemical reduction process for alizarin–ion metal complex
In this study, we have examined the application of Alizarin to the simultaneous determination of Pb(II), Cd(II) and Zn(II) by AdCSV on a hanging mercury drop electrode (HMDE). The method relies on the effective accumulation of the Pb(II), Cd(II) and Zn(II) complexes with Alizarin onto the HMDE. The method is extremely sensitive, selective and simple for the determination of trace levels of lead, cadmium, and zinc in real samples tap water and optimum results obtained were compared with the atomic absorption spectrometric method.
2. EXPERIMENTAL
2.1. Instruments
All adsorptive cathodic stripping measurements were carried out with 797 VA computrace (Metrohn, Herisau, Switzerland) in connection with Dell Computer and controlled by (VA computrace 2.0) control software. Stripping voltammograms were obtained via a Hewlett–Packard laser jet printer. The working cell consisted of three electrode: mercury electrode (MME: multimode electrode) as the working electrode, Ag/AgC as reference electrode (KCl 3 M), and a platinum wire as an auxilary electrode (all from Metrohm).
A Chem Tech Analytical Model CTA-2000 Atomic absorption spectrometer (Shimatzu) was used for lead, cadmium and zinc determination. The pH values of the solution were adjusted employing a Metrohm Model 744 using a combined glass electrode.
All flasks and cell involved in the measurements were rinsed to eliminate contamination by using sequantially a 1% (v/v) solution in 50% ethanol (plastic flasks). All solutions were deaerated with ultrapure nitrogen for 5 min before the stripping voltammetry determinations.
2.2. Material
The materials used for this study were: Alizarin, concentrated HNO3, acetate buffer, ammonia buffer, nitrogen gas, doubly distilled water, What man filter paper and samples (tap water). Various chemicals were purchased from Merck and the aqueous solution of Cd, Pb and Zn 1000 mg/L were prepared by using the Analytical Grade Merck Product.
2.3. Sample preparation
Tap water samples were taken from the laboratory of Analytical Chemistry, Andalas University, taken with the added HNO3 with comparison HNO3: sample=1: 1000.
2.4. Work procedures
3. RESULTS AND DISCUSSION
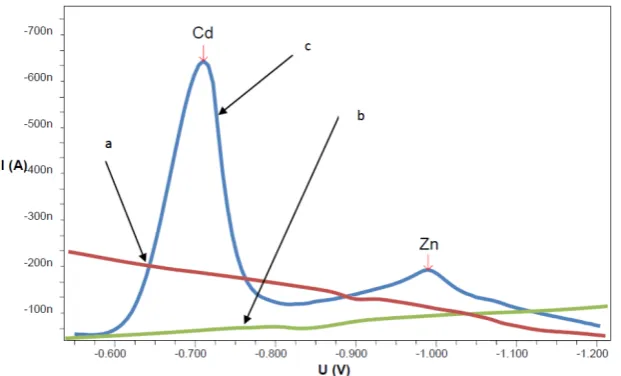
Preliminary experiments were performed to characterize the suitability of alizarin for the determination of Pb(II), Cd(II) and Zn(II) ions. Fig. 2 can be seen adsorptive cathodic stripping voltammetry of the Pb, Cd and Zn-alizarin systems at pH 5.0 (acetate buffer), after deposition at -0.2 V for 60 s on a HMDE. The blank solution (the ligand without metal ions) (Curve a) and metal ions Pb(II), Cd(II) and Zn(II) without the addition of alizarin in pH of 5.0 (Curve b) did not show any peak in this potential range. The sample solution containing the metal ions with the ligand are represented by two peaks (Curve c) at -0.37, -0.76 and -1.076 V that correspond to the reduction of Pb(II), Cd (II) and Zn(II) complexes with alizarin in pH of 5.0.
For the best sensitivity in simultaneous determination of Pb(II), Cd(II) and Zn(II), the influence of different parameters such as pH, ligand concentration, deposition time and potential were investigated.
Fig. 2. Voltammogram adsorptive cathodic stripping voltammetry (a) Alizarin without metal, (b) metal without alizarin,(c) Pb(II), Cd(II) and Zn(II) respectively is 0.01 μg/L with Alizarin 0.5 mM
3.1. Optimization of parameters
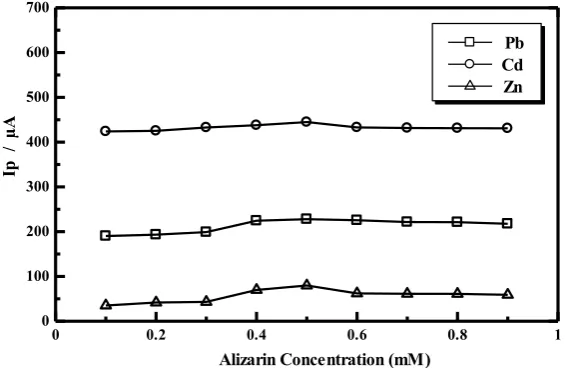
3.1.1. Effects of alizarin concentration
Fig. 3. Effect of Alizarin concentration to the peak current (Ip), Conditions: 10 mL of a mixture of standard solution of Pb(II), Cd(II) and Zn(II) with a concentration of each of 0.01
μg/L, acetate buffer 0.2 mL (pH 5), accumulation potential -0.2 V, accumulation time of 60 s and a potential scan from 0 to-1.2 V
The peak current resulting from the reduction of metal-ligand complexes are adsorbed on the surface of the working electrode on the stripping step. While the reduction in peak current at concentrations alizarin higher than the optimum concentration occurs because of competition ligands adsorbed on the surface of the electrode when step deposition (pre-concentration) and form complexes with metal ions as well as competition adsorption between ligand with ligand-free so that the electrode surface is available for adsorption of metal-ligand complex into smaller, besides the high ligand concentration of metal-ligand complex would be difficult to be reduced so that the resulting peak currents lower [32]. For the concentration of 0.5 mM alizarin was chosen as the optimum conditions for simultaneous determination of metal ions Pb(II), Cd(II) and Zn(II) by adsorptive cathodic stripping voltammetry.
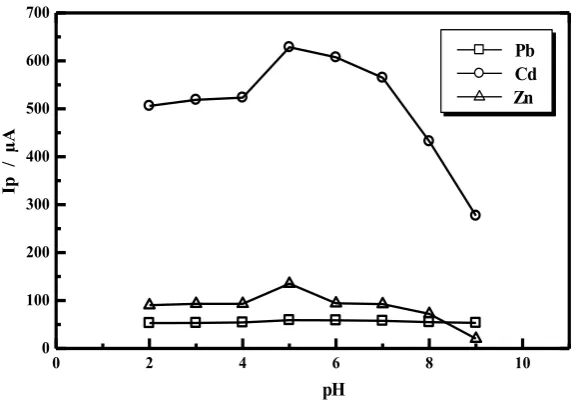
3.1.2. Effects of pH
The complex formation between the Pb(II), Cd(II) and Zn(II) ions with alizarin at accumulation step were affected by pH. The reaction process is described in reaction:
At the proper pH it was expected more and more Pb, Cd and Zn-alizarin complexes formed at the electrode surface, so that they would produce optimum peak current at the time of measurement. The influences of pH on the adsorptive peak currents (Ip) of Pb, Cd and Zn were studied in the pH range of 2 to 9. The result is shown in Fig. 4. At accumulation (pre-concentration) step, the complex formation between the Pb(II), Cd(II) and Zn(II) ions with alizarin was affected by pH. The results showed that the peak current Pb, Cd and Zn-alizarin rose from pH 2 to pH 5 and drops ranging from pH 6 to pH 9. At low pH there is an excess proton resulting in competition with metal ions to form a bond with the ligand so that the resulting current low, while at a pH greater than the pH optimum peak current decline due to OH- ions so that metal ions can form hydroxide and will settle on electrode surface that is
3.1.3. Effects of Accumulation Time
Accumulation time is the time when the analyte accumulated or deposited on the surface of the working electrode HMDE (Hanging Mercury Drops Electrode). At the accumulation time, pre-concentration was useful to improve sensitivity and lower detection limit [33-34]. Fig. 5 illustrates the relationship of the stripping voltammetric peak current versus accumulation time for 0.01 µg/L Pb (II), 0.01 µg/L Cd (II) and 0.01 µg/L Zn(II) with 0.5 mM alizarin and pH 5 over various adsorption times. Variation of the accumulation time over the range 30 – 90 s at a preconcentration potential of -0.2 V showed a gradual enhancement for Pb(II), Cd(II) and Zn(II) peak current up to 60 s and decreased with longer preconcentration times. As a consequence, the accumulation time of 60 s was selected as an optimum for further studies.
Fig. 5. The curve between the accumulated time versus the peak current (Ip), Conditions of measurement: 10 mL of a mixture of Pb(II), Cd(II) and Zn(II) with a concentration of each 0.01 ug/L, 0.5 mM Alizarin 0.2 mL, 0.2 mL of acetate buffer (pH 5), accumulation potential -0.2 V, and a potential scan from 0 V to -1.2 V
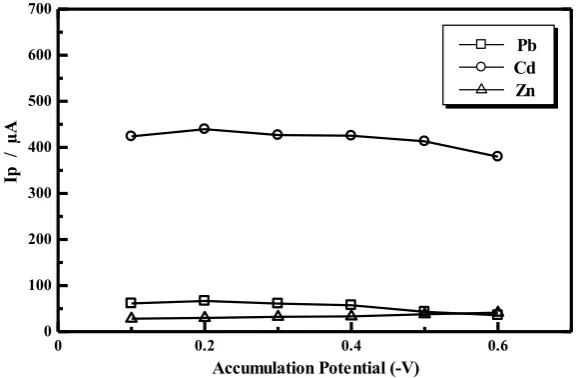
3.1.4. Effects of Accumulation Potential
Fig. 6 illustrates the relationship of the stripping voltammetric peak current versus accumulation potential for 0.01 µg/L Pb(II), 0.01 µg/L Cd(II) and 0.01 µg/L Zn(II) with 0.5 mM alizarin and pH 5. When the adsorption of formed Pb, Cd, and Zn-alizarin complex was measured as a function of accumulation potential at 60 s collection time over the range from -0.1 V to -0.6 V, it was observed that monitored peak current increased slightly when applying -0.2 V as the optimal accumulation potential.
Fig. 6. Accumulation potential curve of the peak current (Ip). Measurement conditions: 10 mL of a mixture of Pb(II), Cd(II) and Zn(II) with a concentration of each of 0.01 ug/L, 0.2 mL Alizarin 5 mM, 0,2 mL acetate buffer (pH 5), accumulation time of 60 s and a potential scan from 0 to -1.2 V
In this study also conducted to determine the relationship between accumulation potential with peak currents of Pb, Cd, and Zn-Alizarin. Pb, Cd and Zn-alizarin peak current highest accumulation potential obtained at -0.2 V. On a more positive potential than -0.2 V peak currents low due to the complex process of deposition on the surface of the working electrode has not reached the maximum, while the accumulation potential more negative than optimum potential analyte complex reduction process occurs during the deposition process takes place so that the peak current is obtained decreasing [32]. Potential -0.2 V was chosen as the optimum accumulation potential for the simultaneous determination of metal ions Pb(II), Cd(II) and Zn(II).
3.2. Analytical figure of merit
3.2.1. Relative standard deviation (RSD)
The relative standard deviation is used to look at the precision of the method is the same operating conditions. The determination of the relative standard deviation performed at optimum conditions has been defined above. At the optimum conditions with eight times replicates (n=10) measurements of 0.01 µg/L standard solution of Pb(II), Cd(II) and Zn(II) were: 1.25, 0.4 and .1.12%, respectively. According to the AOAC method, the value of relative standard deviation was smaller than 15% at the concentration of 0.01 µg/L. That mean this method has a high degree of precision because the RSD obtained for each metal was smaller than 15% [34].
3.2.2. Recovery
Recovery is used to determine the level of accuracy of this method, it was necessary to determine the value of recovery. Samples of known concentration were added the amount of standard solution and then compared with the concentrations of samples and standards added. In this study the recovery of tap water samples studied was taken from the laboratory of Analytical Chemistry, Andalas University. The results of recovery of Pb(II), Cd(II) and Zn(II) by adsorptive stripping voltammetry at the optimum conditions, its value obtained were: 99.45, 98.66 and 99.72%, respectively. According to the AOAC method, the percent recovery for the solution with the concentration of 0.01 µg/L was in the range of 70-125%.That is, this method has high accuracy [34].
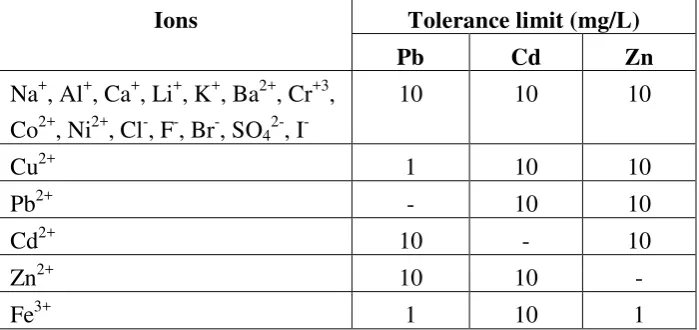
3.3. Interference studies
The evaluation of the selectivity of the method is very important. To check the selectivity of the proposed stripping voltammetric method the influence of many ions on the determination of Pb(II), Cd(II) and Zn(II) was examined, and interference as taken as the level causing the error in excess of 4%. The results of this study are summarized in Table 1. From the results, found that most of the foreign ions did not interfere for Pb(II), Cd(II) and Zn(II) determination. The interference of anions can be eliminated easily by the addition of the interfering ion to the solution containing 10.0 mg/L of these metals using the optimised conditions.
Table 1. Tolerance limit to foreign ions in the determination of Pb(II), Cd(II) and Zn(II)
Ions Tolerance limit (mg/L)
Pb Cd Zn
Na+, Al+, Ca+, Li+, K+, Ba2+, Cr+3, Co2+, Ni2+, Cl-, F-, Br-, SO42-, I-
10 10 10
Cu2+ 1 10 10
Pb2+ - 10 10
Cd2+ 10 - 10
Zn2+ 10 10 -
Fe3+ 1 10 1
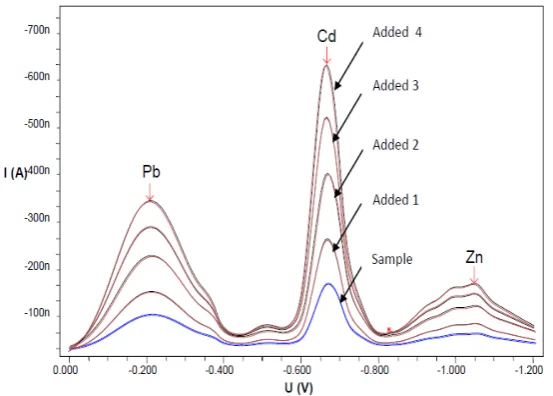
3.4. Application
addition method. The results presented in Fig. 7, show the high sensitivity of the proposed method.
Fig. 7. Voltammogram of Pb, Cd and Zn in tap water
Table 2. Practical application of AdCSV for the determination of Pb(II), Cd(II) and Zn(II) content in tap water sample and comparison with the results obtained by AAS technique
Sample
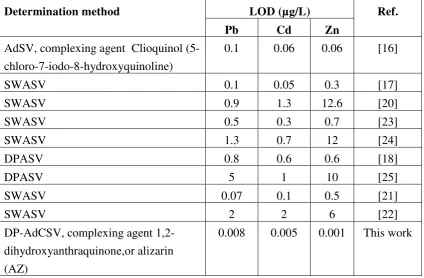
In table 3 shows limit of detection (LOD) in present work compared with some previous works performed by AdCSV applied for simultaneous determination of Pb(II), Cd(II) and Zn(II) using alizarin as a complexing agent. The results of the analysis shows the detection limit of Pb(II) 0.008; Cd(II) 0.005 and Zn(II) 0.001 µg/L. The detection limit is lower, so this method is more sensitive and selective than the method that has been done for the determination of Pb(II), Cd(II) and Zn(II).
Table 3. Limit of detection (LOD) in present work compared with some previous works
performed by AdCSV applied for simultaneous determination of Pb(II), Cd(II) and Zn(II) using alizarin as a complexing agent
Determination method LOD (µg/L) Ref.
4.CONCLUSION
It can be concluded that the optimum conditions for the determination of Pb(II), Cd(II) and Zn(II) simultaneously with AdCSV, namely: alizarin concentration of 5 mM, pH 5, the accumulated time of 60 s and a potential accumulation of -0.2 V. By using the optimum condition is the determination of relative standard deviation for each metal at 1.2% for Pb(II), 0.4% for Cd(II) and 1.12% for Zn(II).The optimum conditions of simultaneous measurement of all three metals are then applied to tap water samples. On tap water samples obtained measurement as follows: by AdCSV 0.045 μg/L for Pb(II), 20 μg/L for Cd(II) and 129 μg/L
Zn(II), by AAS technique 16 μg/L for Cd(II), 115 μg/L for Zn(II) and no metal content of
Pb(II). recovery for the third calculation of Pb(II), Cd(II) and Zn(II) is 99.45%, 96.66%, and 99.72%. This method offers a practical potential for trace determination of Pb(II), Cd(II) and Zn(II) with high selectivity, sensitivity, simplicity and speed.
Acknowledgment
The author would like to thank to Ministry of Research, Technology and Higher Education, which has funded this study, in accordance with the Agreement Implementation o f research Leading Universities No: 46/H.16/UPT/LPPM/2016, February 24, 2016.
REFERENCES
[1] S. E. Manahan, Hazardous Waste Chemistry, Toxicology and Treatment, Lewis Publisher, Inc., USA (1990).
[2] H. S. Stoker, H. S. and S. L. Seager, Environmental Chemistry; Air and Water Pollution, 2nd edition, Scott, Foresman and Company, Illinois, (1976).
[3] E. Sahara, J. Chem. 2 (2008) 110.
[4] Saryati, and S. Wardiyati, Indones. J. Mater. Sci. 2 (2007) 26.
[5] Suhendrayatna, Heavy Metal Bioremoval by Microorganism: A Literature Study, Sinergi Forum PPI Tokyo Institute of Technology, Tokyo (2001).
[6] J. C. Richard, J. Brown Martin, and T. Milton, Trend Anal. Chem. 24 (2005) 266. [7] Deswati, H. Suyani, R. Zein, A. Alif, and H. Pardi, J. Chem. Pharm. Res. 7 (2015) 840. [8] A. A. Ensafi, S. Abbasi, and H. R. Mansour, Anal. Sci. 17 (2001) 609.
[9] A. Shahryar, A. Bahirae, and F. Abbasai, Food Chem. 129 (2011) 1274. [10] S. Zang, and W. Huang, Anal. Sci. 17 (2001) 985.
[11] R. Jugade, and A. P. Joshi, Anal. Sci. 22 (2006) 571.
[12] M. B. Gholivand, A. Pourhossein, and M. Shahlaei, Turki J. Chem. 35 (2011) 839. [13] Deswati, H. Suyani, Safni, U. Loekman, and H. Pardi, Indones. J. Chem. 13 (2013)
[14] P. Proti, Introduction to modern voltammetric and polarographic analysis techniques, Amel Electrochemistry Ed. 4th, (2001).
[15] M. K. Amini, and M. Kabiri, J. Iran. Chem. Soc. 2 (2005) 32.
[16] E. Herrero, V. Arancibia, and C. Rojas–Romo, Anal. Electroanal. Chem. 729 (2014) 9. [17] K. C. Armstrong, C. E. Tatum, R. N. Dansby-Sparks, J. Q. Chambers, Z. L. Xue,
Talanta 82 (2010) 675.
[18] Y. Wu, N. B. Li, and H. Q. Luo, Sens. Actuators B 133 (2008) 677.
[19] N. Serrano, B. Prieto-Simón, X. Cetó, and M. Valle, Talanta 125 (2014) 159. [20] M. A. G. Rico, M. Olivares-Marin, and E. P. Gil, Talanta 80 (2009) 631. [21] F. Torma, M. Kada, K. Toth, and E. Tatar, Anal. Chim. Acta 619 (2008) 173. [22] G. Kefala, and A. Economou, Anal. Chim. Acta 576 (2006) 289.
[23] V. Rehacek, I. Hotovyand, and M. Vojs, Microsyst. Technol. 14 (2008) 491. [24] G. H. Hwang, W. K. Han, J. S. Park, and S. G. Kang, Talanta76 (2008) 301. [25] E. A. McGraw, and G. M. Swain, Anal. Chim. Acta 575 (2006) 180.
[26] C. R. B. Cordeiro, A. L. Brandes Marques, E. P. Marques, W. S. Cardoso, and J. Zhang, Int. J. Electrochem. Sci. 1 (2006) 353.
[27] A. H. Alghamdi, J. Saudi Chem. Soc. 14 (2010) 1.
[28] K. Tyszczuk, and M. Korolczuk, Anal. Chem. Acta 624 (2006) 232. [29] L. Wang, R. Chen, S. Wen, and J. Zhu, Anal. Chem. 15 (1987) 118. [30] J. Z. Zhao, D. Z. Sun, D. J. Liu, and F. Huaxue, 24 (1996) 101.
[31] Deswati, L. Amelia, H. Suyani, R. Zein, and J. Jin, Rasayan J. Chem. 8 (2015) 362. [32] H. Palar, Heavy Metal Contamination and Toxicology, Rineka cipta, Jakarta (2012). [33] S. Abbasi, B. Atousa, and A. Freshteh, Food Chem. 129 (2011) 1274.
[34] AOAC Guidelines for Single Laboratory, (Http://www.aoac.org/Official Methods/slv guidelines.pdf),19/12/2002.
[35] J. C. Miller, and J. N. Miller, Statistics for Analytical Chemistry. Ellis Horwood, New York (1994).
[36] [36] A. W. Bott, Current Separat. 14 (1995) 24.
[37] W. M. Peterson, R. Wong, and G. Princeton, Applied Research, Electrochemistry Product Group, Copenhagen (1991).
[38] T. M. Florence, J. Electroanal. Chem. 168 (1984) 207.
Copyright © 2016 by CEE (Center of Excellence in Electrochemistry)
ANALYTICAL & BIOANALYTICAL ELECTROCHEMISTRY (http://www.abechem.com)