PAPER • OPEN ACCESS
Water Quality Assessment and Determining the
Carrying Capacity of Pollution Load Batang Kuranji
River
To cite this article: I Dewata and Z Adri 2018 IOP Conf. Ser.: Mater. Sci. Eng.335 012027
View the article online for updates and enhancements.
Related content
Application of Nemerow Index Method and Integrated Water Quality Index Method in Water Quality Assessment of Zhangze Reservoir
Qian Zhang, Minquan Feng and Xiaoyan Hao
-Relationship between land use and water quality in Pesanggrahan River
Hefni Effendi, Sri Muslimah and Prita Ayu Permatasari
-Using CSLD Method to Calculate COD Pollution Load of Wei River Watershed above Huaxian Section, China
Lei Zhu, JinXi Song and WanQing Liu
Water Quality
Assessment
and Determining the
Carrying
Capacity
of Pollution Load
Batang
Kuranji
River
I Dewata1,2*, and Z Adri2
1
Chemistry Department, Faculty of Mathematics and Science, Universitas Negeri Padang, Indonesia
2
Environmental Science, Postgraduate Program, Universitas Negeri Padang, Indonesia
Abstract. This study aims to determine the water quality and carrying capacity of pollution
load Batang Kuranji River in the headwaters, middle, and downstream. This research is descriptive quantitative parameters of pH, BOD, COD, TSS, and DOES Depictions of river water quality refer to RegulationNo.82/2001, while determination of carrying capacity of pollution load river refers to the Kep Men LHNo.10/2003.The result is Kuranji Batang River water quality upstream region included in either category who meet the quality standard first class ofPP82/2001. TSS concentrations at head waters of 21 mg/L, BOD1,6 mg/L, COD7,99mg/L and DO 7,845 mg/L. While the carrying capacity of pollution load river in upstream region included in both categories namely BOD of 4,4 kg/sec, COD 273,60 kg/sec, TSS906,00kg/sec, and DO parameters of 49.20 kg/sec. Middle region (point 2, 3, and 4) water quality Batang Kuranji River has exceeded the quality standard of 82/2001 for class II and class III. Meanwhile, carrying capacity of pollution load river in area included in ugly category. The calculation is done with application Qual2Kw show that carrying capacity of pollution load river of BOD -857.3 kg/sec, COD -777.40 kg/sec, TSS +9511.5 kg/sec, and DO +69.30 kg/sec.
1. Introduction
Padang City is one of the cities in West Sumatra that has several rivers, including Batang Arau River, Batang Kandis River, Batang Kuranji River, Air Dingin River and other rivers. One of the best quality river is Batang Kuranji River. Administratively Batang Kuranji River is located in 4 (four) sub-districts of Padang City, namely Pauh, Kuranji, Nanggalo, and sub-districts of North Padang. Batang
Kuranji River Basin has an area of 202.70 km2 and the length of the river is 17 km. Upstream Batang
2
that is currently still can be used or utilized by the community will not be utilized again by the community along the river in the future (Bapedalda, 2007).
Based on the description, to maintain the water quality of Batang Kuranji River in order not to decrease in the future, it is necessary to study the quality of river water in the existing condition, so it can determine the capacity of Batang Kuranji River. Capacity of the river is useful to know the potential or ability of the river in receiving the incoming liquid waste that causes the river to become uncontaminated. In addition, because water is one of the resources needed, so to anticipate future Source through Qual2Kw method. Water quality research and determination of Batang Kuranji River capacity is carried out in Batang Kuranji river basin. The research begins in April 2012 until February 2013.
2.1.Data Collection
Secondary data required is water quality from related institutions and community activities along streams that produce both point source and non-point source liquid wastes. Primary data in the form of GPS(Global Positioning System) river, river’s width, the details of incoming flow and outflow of
Batang Kuranji River, Batang Kuranji River’s water quality, etc. Physical parameters measured are
temperature, solid, turbidity, and color. Parameters of water chemistry such as pH value, BOD (Biochemical Oxygen Demand), COD (Chemical Oxygen Demand), DO (Disolved Oxigen).
2.2.Data Analysis
The determination of river pollution load capacity is by Qual2Kw method by United States Environmental Protection Agency (US EPA). The data required are river flow, river quality, river length and width, air temperature, wind speed, cloud cover, water sampling coordinates, wastewater quality monitoring in accordance with river water parameters and discharge of water source or liquid waste into the river (KLH, 2009).
2.2.1. Quality of River Water. Data analysis on water quality of Batang Kuranji River refers to PP. No. 8/2001 on Water Quality Control and Water Pollution Management.
2.2.2.Load Pollution Capacity. The capacity of the river is determined based on KepMen LH.
Win,i = The total mass flow rate entering streams from point and nonpoint source, (m
3
/dt)
Wab,i = The total mass flow rate out of the river from point and nonpoint source, (m
3
/dt)
V = River flow rate (m/dtk)
A = River cross section area (m2) (Pelletier G J.,et all,. 2005
3. Results and Discussion
3.1. Results
Padang city is located on the west coast of Sumatra Island at the position of 00° 44'00"- 10° 10' 35" SL and 100° 05'05"- 100° 05' 05" WE, with a height of 0 - 500 meters on the mdpl and the area around
694, 96 km2. In terms of topography of the four sub-districts traversed by the River Batang Kuranji is
at an altitude of 0-100 meters from sea level with a length of 17 km.
Land utilization in the four sub-districts traversed by the Batang Kuranji stem rivers, namely Pauh sub-district, still exist state forests and community forests which are conservation areas as protection for all watersheds. In addition, there are also rice fields, gardens and fields in the upstream of the river. Meanwhile, compared to the downstream area of the river (North Padang Subdistrict) there is no state forest that is used as a protection for the ecosystem of organism.
3.2. Indentify Pollutant Sources
Identification results of the Batang Kuranji River basin are found that pollutant sources are generally derived from residents' wastes, industrial activities such as tofu factories, restaurants, catering, workshops, car and motor washings, chicken farms, C excavations, traditional markets and agricultural activities.
3.3. River Water Quality
3.3.1 Batang Kuranji River Water Quality
The result of Batang Kuranji River water quality inspection from upstream to downstream based on primary data and secondary data presented in Tables 3 and 4 shows that there has been a change of water quality of Batang Kuranji River from upstream to downstream for TSS parameter, BOD, COD, DO, and pH. In the upstream area, the water quality of Batang Kuranji River is still considered good, that is still fulfill the quality standard of class 1 (one) PP 82/2001. Water in this class may be designated as raw water for drinking water or other designations in accordance with the same water quality requirements.
Table 1. The result of Batang Kuranji Water Quality Of Padang in sampling 1,2, and 3 Analysis :
laboratory of Chemistry, FMIPA UNP Padang.
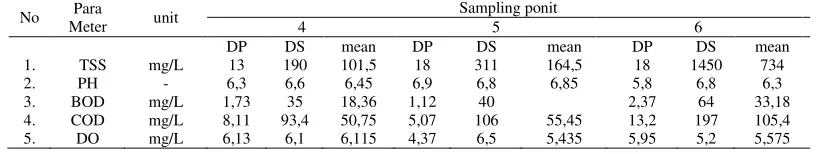
Table 2. The result of Batang Kuranji Water Quality Of Padang in sampling point 4, 5, 2, dan6.
4
Analysis: laboratory of chemistry Universitas Negeri Padang, DP is Primery Data and DS is Secondary Data
1 : Main stream of Kuranji River (0O53’ 56” S; 100O27’ 38” E)
2 : Limau Manis and Batu Busuak river position (0O55’ 19” S; 100O26’21” E)
3 : Kalumbuk (0O55’ 14” S; 100O23’ 27” E)
4 : Intake PDAM (0O54’ 20” S; 100O22’ 26” E)
5 : Kuranji river and Batang Guo river intersection (0O53’ 58” S; 100O21’ 22” E
6 : Down stream of Kuranji River (0O54’ 20” S; 100O20’ 52” E)
Table 1 shows the quality of river water at each sampling site by comparison of water classes. BOD, COD, and TSS parameters tend to change their quality from upstream to downstream areas. Specifically, for TSS Parameters experienced significant changes in downstream area at the point of sampling location 5 that is TSS concentration 164,5 mg/L and point 6 TSS concentration 734 mg/L accumulated sediment due to river edge erosion in upstream and middle river area and sand or stone harvesting by communities will enrich suspended solids (TSS) in the area.
3.3.2 Batang Kuranji River Capacity
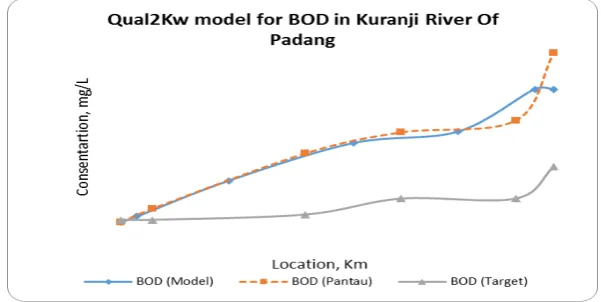
The calculation of Batang Kuranji River Capacity is carried out based on the monitoring result which has been done and the assumption of the determination of water class in each region or segment in Batang Kuranji River (Figure 3). Qual2Kw application review results known that the pollutionload capacity of Batang Kuranji River (BOD, COD, TSS and DO) in upstream areas is categorized as good, whereas pollution load capacity in downstream areas is categorized as poor. Next Figure shows the concentration of BOD monitoring results exceeding the threshold. The green curve with triangle points is the targeted BOD concentration when each water segment is defined according to PP 82 of 2001. While the red color curve (dashed line) is the result of monitoring the quality of Batang Kuranji river. Through Qual2kw application approach is calculated BOD pollution load into river from upstream to downstream is 2,169,30 kg/second. Pollution load that enter at existing condition in upstream area (segment 1) for BOD parameter is 68 kg/s, while based on PP 82/2001 or targeted is 72.40 kg/sec. This means that upstream of Batang Kuranji River is still able to accommodate pollution loads of 4.4 kg/sec on BOD parameters.
Figure 1. Qual2Kw modeling BOD kconcentration in Batang Kuranji River,
Padang City.
area of the river. The pollution load on area 2 has exceeded the 299.5 kg/s capacity threshold from the pollution load target of 54.6 kg/sec. In the third and fourth sections, it has exceeded 557.80 kg/sec of the total targeted pollution load of 218.40 kg/sec. Whereas in down stream, the pollution load that has entered has exceeded the target which is charged at 296,40 kg/sec. Description of Batang Kuranji River pollution load pollution curve for BOD parameter is presented in Figure1.
1 2 3 4 5
Figure 2. Capacity of pollution load of Batang Kuranji river in Padang, COD parameter.
Based on the above description and Figure 2, the pollution load capaity in the upstream area (segment 1) for the BOD parameter in good category. Meanwhile, for the middle area (segments 2, 3, and 4) are in bad condition, while in the downstream area (segment 5) the pollution load capacity with BOD parameter is included in bad category.
The pollution load capacity for COD parameter also shows the same with BOD as shown in next Figure. The green color curve (COD target) is the target of pollution load of Batang Kuranji River when the river class has been determined in accordance with PP 82 of 2001, meanwhile the blue curve (COD Model) is the output of river quality modeling from upstream to downstream. While the red colors curve (COD monitor) is the result of monitoring the quality of Batang Kuranji river in Figure 3.
Figure 3. Qual2Kw modeling COD concentration in Batang Kuranji river, Padang
city COD parameter.
In the upstream area (segment 1) the pollution load capacity of COD can still accommodate pollution loads of 273.60 kg/sec from the pollution load target of 482.00 kg/sec. The second segment area of the incoming pollution load has exceeded the targeted threshold for the class II class water of 455.00 kg/sec while the monitoring result on the second segment shows the pollution load is 868.00 kg/sec. In areas 3 and 4 designated as class III water, it has also exceeded the
Qual 2KW model for COD of Kuranji River
Monitoring location (Km)
(monitor)
C
onc
entra
ti
6
threshold of 364.40 kg/sec from the targeted 1,820 kg/sec. While downstream, the COD parameter has been overloaded by 413 kg/sec of the target set at 2,470 kg/sec. In this area is defined as the segment that has water with the standard grade 4. Based on the description, the pollution load capacity for upstream to COD parameters is good, middle area (segment 2, 3, and 4) load capacity of pollution load included in bad category, while the downstream area of its capacity is quite bad .
1 2 3 4 5
Figure 4. Capacity of pollution load of Batang Kuranji river, Padang city COD parameter.
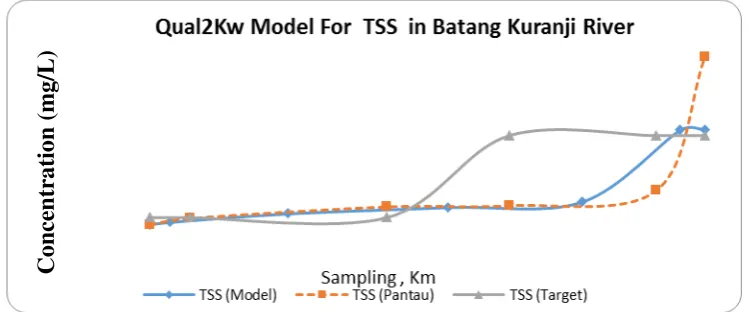
The result of Qual2Kw application modeling for TSS parameter is shown in Figure below. The green color curve (TSS Target) is the concentration of TSS when the river class is determined in accordance with PP 82 of 2001. In the upstream area set class I, in the second segment is set class II, area 3 And 4 is designated water with class III, meanwhile for downstream area (segment 5) determined class IV. The red curve (monitored TSS) is the monitoring results of river quality from upstream to downstream, while the blue color curve (TSS model) is the modeling output issued by the Qual2Kw application. (Figure 4). Upstream river is still able to accommodate a TSS pollution load of 906.00 kg/sec from the targeted of 1,510 kg/sec. The upstream area (segment 1) is defined as water having a class I class. While in the middle (section 2) the pollution load is 2,000 kg/sec in excess of the target of 910 kg/sec. This area is designated as water with class II standard. In the 3 and 4 segments based on Qual2Kw modeling it can still accommodate pollution loads of 10601.50 kg/sec.
Figure 5. Qual2Kw modeling TTS Concentration in Batang Kuranji river Padang city.
This area is designated as standard class III water with the target of pollution load allowed to enter 14,560 kg/sec. Further, downstream is designated as class IV, the pollution load allowed for TSS parameter is 12,480 kg/sec. The monitoring results for the 5th segment show 25,659.00 kg/sec
Conce
n
tr
at
ion
(
m
g/L
)
C
apasi
ty (
kg
/s
which exceeds 13,179.00 kg/sec of the charged target. For further details, the pollution load capacity of the Batang Kuranji River from upstream to downstream is presented in Figure 5.
1 2 3 4 5
Figure 6. Capacity of pollution load of Batang Kuranji river in Padang City for TTS
Parameter
Referring to the description, the pollution load capacity for the upstream area of the TSS parameter is included in good category. In the middle area (segments 2, 3, and 4) the pollution load capacity is included in good category because it can still accommodate pollution loads of 9,511.5
kg/sec. While in downstream area capacity of pollution load of Batang Kuranji River classified as
poor. This can be seen from the total pollution load that has been entered has exceeded the threshold determined by PP 82/2001.
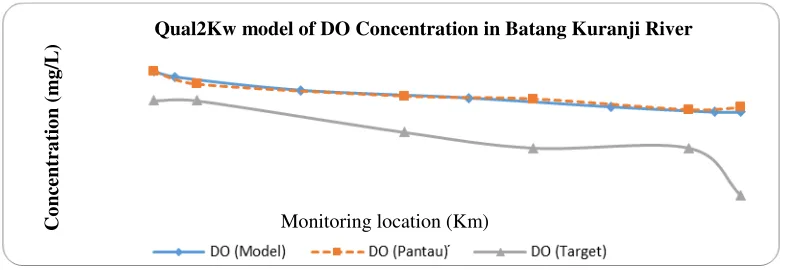
Furthermore, the parameters of DO pollution load coming from upstream to downstream areas still meet the quality standard threshold set by PP 82/2001. The results of modeling with Qual2Kw applications for the DO parameters are shown in Figure 6.
Figure 7. Qual2Kw modeling DO concentration in Batang Kuranji river
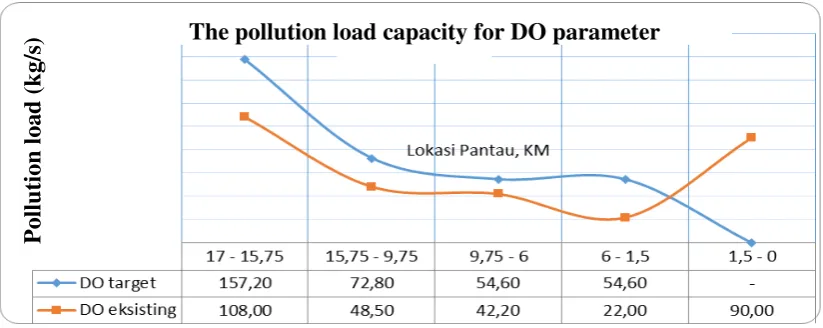
In upstream areas, the DO concentrations are still able to accommodate a pollution load of 49.20 kg/sec from the total target charged at 157.20 kg/sec. The upstream of the river is designated as water with a class I standard intended for raw water for drinking water. In the middle area (segment 2) the contamination load is 48.50 kg/sec, while the pollution load target for segment 2 is 72.80 kg/sec or still able to accommodate pollution load of 24.30 kg/sec. Segment 2 is defined as an area with a class II quality standard. Area of 3 and 4 segments which is intended for class III water quality, total pollution loads are 64.2 kg/sec. While the target of pollution load in this area is 109,20 kg/sec, so this area still able to accommodate the contamination load of 45 kg/sec. In the downstream area, the total burden of contamination of 90 kg/sec is designated for class IV water, which is not required to target pollution loads.
Monitoring location (Km)
Qual2Kw model of DO Concentration in Batang Kuranji River
Co
ncent
ra
tio
n (
mg
/L
)
Monitoring location (Km)
C
apasi
ty (
kg
/s
8
Figure 8. Capacity of pollution load of Batang Kuranji river in Padang city DO parameter
Based on the above description, the pollution load capacity of Batang Kuranji River for the DO parameters in the upstream, middle and downstream areas are classified as good (Figure 8)
4. Discussion
Water quality and pollution of Batang Kuranji River Padang hence obtained some findings as follows:
a. There has been a decrease in water quality for BOD, COD, TSS, DO and pH parameters in
Batang Kuranji River from upstream to downstream areas caused by the increasing number of settlements in the downstream area. The water quality of Batang Kuranji River in upstream areas is still included in the category of raw water class I (one) which is required as drinking water water and / or other allotment which requires the same water quality as the use. Upper river areas are areas where there are only rice fields, plantations, protected forests as the center of conservation areas, and a small proportion of human settlements.
b. The middle of the transition area also has decreased the quality of river water. The middle area
is designated for water with classes II and III in accordance with Government Regulation 82 of 2001. Field monitoring shows that this area is found in many agricultural, livestock, residential, commercial and excavation activities.
c. In the downstream areas, the water quality condition of Batang Kuranji River belongs to the category of class IV water (four) which is designated as water for irrigation, cultivation and or other allotment which requires the same water quality as the use. In this area, there are many settlements and activities that produce liquid waste. With such population data and monitoring results, it is found that downstream areas have decreased the quality of river water exceeding the threshold of class IV PP 82 year 2001.
The decrease of pollution load capacity of Batang Kuranji River River, it is necessary to manage the wastes that enter the river so that water quality will also increase.
a. The pollution load capacity of Batang Kuranji River in the upstream area is included in either
category. This is evidenced by the calculation of pollution load using the application of Qual2Kw. For BOD parameters in upstream areas still able to accommodate pollution loads of 4.4 kg/sec, COD parameters 273,60 kg/sec, TSS 906 kg/sec, and for parameter of DO equal to 49,20 kg/sec. While in the downstream area of pollution load capacity based on Qual2kw application modeling included in the category of ugly. These conditions can be seen from the ability of the river to receive pollution loads.
b. In general, central area of Batang Kuranji River is included in bad category. This is indicated by
the capacity for BOD and COD parameters to exceed the specified threshold (Table 13). As for TSS parameters on segment 2 exceeds the specified threshold. The calculation result shows that TSS capacity in area 2 is -1.090 kg/sec, this is because in this region class II is defined while the
The pollution load capacity for DO parameter
activity in this area is C excavation which can lead to the increase of TSS. In areas 3 and 4 the water is designated with class III so that the capacity of the river is increased while the existing activities along this area based on the monitoring results do not significantly increase the TSS content. The activities that exist in this area are agriculture, traditional market, and residential area.
c. The BOD parameters in the downstream area have exceeded the capacity of 674,60 kg / s, COD
413,00 kg / s, TSS 13,179,00 kg / s, and for the DO parameter the incoming pollution load is 90 kg / s. In the downstream area, the total pollution load for the required DO parameters is not required. This is because the threshold on this area is included in the class 4 water quality standard, which DO requirement is 0 (zero). The decrease of pollution load capacity in the downstream area is triggered by the excavation activity C that is the taking of sand, stone, and gravel. So, with this activity there is an increase in TSS concentration in the river.
5. Conclusion
Conclusion of water quality and determination of Batang Kuranji river capacity research are:
On the Batang Kuranji River Upstream: Water quality is in good category and fulfill first class water quality standard 1 (one) according to PP 82 year 2001. TSS concentration in upstream area 21 mg/L, BOD 1,6 mg/L, COD 7,99 mg/L and for parameter DO 7.845 mg/L. The pollution load capacity is in good condition and able to accommodate incoming pollution load for BOD parameter of 4.4 kg/sec, COD parameter 273,60 Kg/sec, TSS 906,00 kg/sec, and DO parameter 49,20 Kg/sec. On the Batang Kuranji River Central: Point 2, TSS concentrations 48 mg/L, BOD 4.15 mg/L, COD 16.35 mg/L and DO 7.04 mg/L which has exceeded the threshold. Point 3, TSS concentrations of 96.5 mg/L, BOD 14.45 mg/L, COD 40.05 mg/L, and DO 6.29 mg/L have exceeded the class III threshold. Point 4, TSS concentration 101,5 mg/L, BOD 18,365 mg/L, COD 50,755 mg/L, and DO 6,115 mg/L have exceeded class III quality standard. The pollution load capacity of Batang Kuranji River in the ugly category, ie, segments 2, 3, and 4 are BOD -857.3 kg/sec, COD -777,40 kg/sec, for TSS +9.511.5 kg/sec, while DO + 69.30 kg/sec. On the Batang Kuranji River Downstream, Water quality of Batang Kuranji River for downstream area included in bad category, is TSS concentration in downstream area that is 734 mg / L, BOD 33,185 mg / L, COD, 105,39 mg / L, and DO concentration that is 5,575 mg / L. The river capacity downstream (section 5) for BOD parameters has exceeded -674.60 kg/sec, COD -413.00 kg/sec, TSS -13.179,00 and DO at 90 kg/sec.
References
[1] Biro Pusat Statistik, 2007 “ Padang Dalam Angka“, BPS Kota Padang
[2] Bapedalda Kota Padang. 2007. Penetapan Daya Tampung Beban Pencemaran Batang Arau
Padang
[3] Keputusan Menteri Lingkungan Hidup Nomor 110 Tahun 2003 tentang Pedoman Penetapan Daya
Tampung Beban Pencemaran Air Pada Sumber Air
[4] Pelletier G J., Chapra S C., Tao H. 2005. Qual2Kw – A Modeling Framework For Simulating
River and Stream Water Quality (version 2.07)
[5] Peraturan Pemerintah Nomor 82 Tahun 2001 tentang Pengelolaan dan Kualitas Air dan
Pengendalian Pencemaran Air
[6] Undang-Undang Republik Indonesia Nomor 32 tahun 2009 tentang Perlindungan dan Pengelolaan