The rSPA Processes of River Water-quality Analysis System
for Critical Contaminate Detection, Classification
Multiple-water-quality-parameter Values and Real-time Notification
Chalisa VEESOMMAI, Yasushi KIYOKI
Graduate School of Media and Governance, Keio University 5322 Endo, Fujisawa, Kanagawa 252-0882 Japan
E-mail: {chalisav, kiyoki}@sfc.keio.ac.jp
Abstract
The water quality analysis is one of the most important aspects of designing environmental systems. It is necessary to realize detection and classification processes and systems for water quality analysis. The important direction is to lead to uncomplicated understanding for public utilization. This paper presents the river Sensing Processing Actuation processes (rSPA) for determination and classification of multiple-water- parameters in Chaophraya river. According to rSPA processes of multiple-water-quality-parameters, we find the pollutants of conductivity, salinity and total dissolved solid (TDS), which are accumulated from upstream to downstream. In several spots of the river, we have analyzed water quality in a maximum value of pollutants in term of oxidation-reduction potential (ORP). The first range effect of parameter is to express high to very high effects in term of dissolved oxygen, second is to express intermediate to very high effect in term of conductivity, third is to express low to very high effect in term of total dissolved solid, fourth is to express completely safe to very high effect in term of turbidity and the final is to express completely safe for effect in term of salinity.
Keywords: river water quality, warming system, River Sensing Processing Actuation (rSPA), PostgresSQL, Chaophraya River.
1. INTRODUCTION
Chao Phraya river is the main river and important river of the Chao Phraya basin and Thailand. The Chao Phraya river flows past provinces in the central area region of Thailand [2]. The beside area crossing river will take many advantages including agriculture, transportation, community development, housing, business, commerce, tourism, industry, etc. All of process or operation of the activity cause pollution, wastes and wasteswater that affect to an environment of the water resource.
Generally, river water containing different pollutants such as biological, physical and chemical has significant adverse effect on human health and water born diseases. The pollutants containing in river water show as Table 1 [3]. The Bacteria contamination (Coliform bacteria and Fecal Coliform Bacteria) is possible health impact, as an opportunistic pathogenic, and causes a variety of nosocomial infections of the urinary tract, respiration tract, blood, several other normal sterile in patients [4] food poisoning, gastroenteritis, urinary tract infections and neonatal meningitis [5]. The physical pollutants as conductivity, total solid, total dissolved solid [6] and turbidity are possible in short-term (when more that standard value) and long-term (when less that standard value) of hazardous and impact [7]. The chemical pollutants exist as dissolved oxygen (impossible in nitrification when less that 4.0 mg/l)[8], biological oxygen demand (impossible effect to aquatic life and cause of sewage) and nitrate (high nitrate level can cause methemoglobinemia or blue baby syndrome and eutrophication)[9].
One of the most important issues in this situation is to realize a warming system of the result in pollutants to public for preparing the protection and treatment process in industry. Processing, Actuation and Action (SPA) is a concept for supporting the definition of rule in automatically performing initial actions in response to the occurrence of real-time events by Y. kiyoki [10]. The sensing (S) is a sensing phase from input to raw water quality data and water sensing equipment. The processing (P) is a phase for the analysis of logic test and knowledge databases, and the evaluation causes the next action to be carried out. The actuation (A) is an output action phase to make the notification, warning, send action and update current situation.
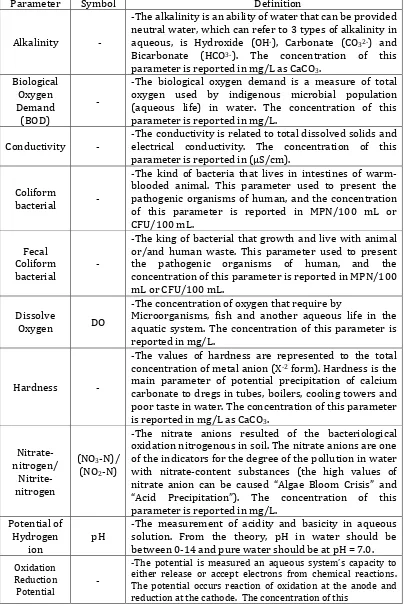
Table 1. The definitions of characteristic for physical, chemical and microbiological contamination [3]
Parameter Symbol Definition
Alkalinity -
-The alkalinity is an ability of water that can be provided neutral water, which can refer to 3 types of alkalinity in aqueous, is Hydroxide (OH-), Carbonate (CO32-) and Bicarbonate (HCO3-). The concentration of this parameter is reported in mg/L as CaCO3.
Biological oxygen used by indigenous microbial population (aqueous life) in water. The concentration of this parameter is reported in mg/L.
Conductivity -
-The conductivity is related to total dissolved solids and electrical conductivity. The concentration of this parameter is reported in (μS/cm).
Coliform
bacterial -
-The kind of bacteria that lives in intestines of warm-blooded animal. This parameter used to present the pathogenic organisms of human, and the concentration of this parameter is reported in MPN/100 mL or concentration of this parameter is reported in MPN/100 mL or CFU/100 mL.
Dissolve
Oxygen DO
-The concentration of oxygen that require by
Microorganisms, fish and another aqueous life in the aquatic system. The concentration of this parameter is reported in mg/L.
Hardness -
-The values of hardness are represented to the total concentration of metal anion (X-2 form). Hardness is the main parameter of potential precipitation of calcium carbonate to dregs in tubes, boilers, cooling towers and poor taste in water. The concentration of this parameter is reported in mg/L as CaCO3.
Nitrate--The nitrate anions resulted of the bacteriological oxidation nitrogenous in soil. The nitrate anions are one of the indicators for the degree of the pollution in water with nitrate-content substances (the high values of nitrate anion can be caused “Algae Bloom Crisis” and “Acid Precipitation”). The concentration of this parameter is reported in mg/L. between 0-14 and pure water should be at pH = 7.0.
Oxidation Reduction Potential
-
Table 1. The definitions of characteristic for physical, chemical and microbiological contamination [3] (Cont.)
Parameter Symbol Definition
parameter is reported in μs/cm.
-Salinity -The salinity is the total number of all non-carbonate salts dissolved in water. The concentration of this parameter is reported in parts per thousand (ppt).
Total Dissolved
Solids
TDS
-Total Dissolved Solids which refers to solid compound or article in the solid phase is dissolved in aqueous, such the inorganic acid and the organic compound. The concentration of this parameter is reported in mg/L.
Turbidity -
-The turbidity can by caused by infection of soil, sand, algae, plankton, diatom and colloidal, and is an efficiency indicator for water analysis in Environmental field, which measured by the light-transmitting properties in the water. The concentration of this parameter is reported in NTU.
2. RELATED WORKS
notification and warning systems will be important in this situation. The architecture of process shows as figure 1.
Figure 1. The architecture of processes [13]
4. SYSTEM DESIGN
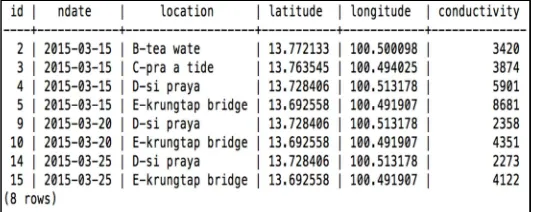
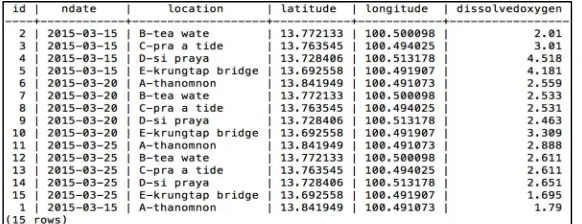
The lower of Chao Phraya river is located in the Nontha Buri and Bangkok Province. The study areas from Nontha Buri province to Bangkok Province where are 13.841949, 100.491073 to 13.692258, 100.491907, 26 kilometers. We have designed two sites as sampling sites: sampling site (A, B, C, D points) and global river flux site (E point). The sampling sites have been affected from the utilization of water, wasteswater and transportation. The global river flux site is the final point for checking areas. We have checked the water quality from the drain to the lower area and evaluated the accumulation of pollutant.
The sampling points is 5 points: A is Thanomnon (13.841949, 100.491073), B is Tea-wate (13.772133, 100.500098), C is Pra-a-tide (13.763545, 100.494025), D is Sipraya (13.728406, 100.513178) and E is Krungtap Bridge (13.692558, 100.491907), for the Geographic location and sampling points of study area shown in figure 2.
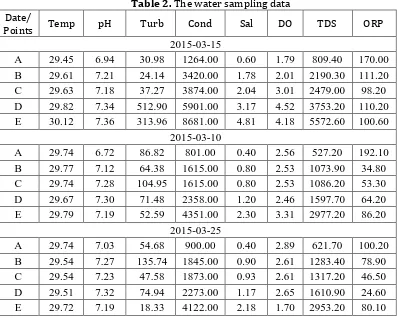
B. Water Sampling
The water samplings were collected from difference place and taken to determine pollutant of Chao Phraya river is present, in March 2015. The process of sampling water follows the standard of ISO 5667-6 [14]. The water parameters are temperature, pH, dissolved oxygen (DO), conductivity, salinity, total dissolved solid, turbidity, oxidation reduction potential (ORP) and GPS by using The Multi water quality checker (15) water sampling data are shown in table 2.
Table 2. The water sampling data Date/
Points Temp pH Turb Cond Sal DO TDS ORP
2015-03-15
A 29.45 6.94 30.98 1264.00 0.60 1.79 809.40 170.00 B 29.61 7.21 24.14 3420.00 1.78 2.01 2190.30 111.20 C 29.63 7.18 37.27 3874.00 2.04 3.01 2479.00 98.20 D 29.82 7.34 512.90 5901.00 3.17 4.52 3753.20 110.20 E 30.12 7.36 313.96 8681.00 4.81 4.18 5572.60 100.60
2015-03-10
A 29.74 6.72 86.82 801.00 0.40 2.56 527.20 192.10 B 29.77 7.12 64.38 1615.00 0.80 2.53 1073.90 34.80 C 29.74 7.28 104.95 1615.00 0.80 2.53 1086.20 53.30 D 29.67 7.30 71.48 2358.00 1.20 2.46 1597.70 64.20 E 29.79 7.19 52.59 4351.00 2.30 3.31 2977.20 86.20
2015-03-25
A 29.74 7.03 54.68 900.00 0.40 2.89 621.70 100.20 B 29.54 7.27 135.74 1845.00 0.90 2.61 1283.40 78.90 C 29.54 7.23 47.58 1873.00 0.93 2.61 1317.20 46.50 D 29.51 7.32 74.94 2273.00 1.17 2.65 1610.90 24.60 E 29.72 7.19 18.33 4122.00 2.18 1.70 2953.20 80.10
C. Analysis Process
The rSPA was a tool in this study to detection the critical points and classification of multi-parameter in detail. The procedures used for rSPA are described below (for creating is step 1 to 4 and analysis is step 5-8) and show as figure 1.
Step 1: To select the water parameter. The parameter of water resource in this study as conductivity, dissolved oxygen (DO), salinity, total dissolved solid (TDS) and turbidity.
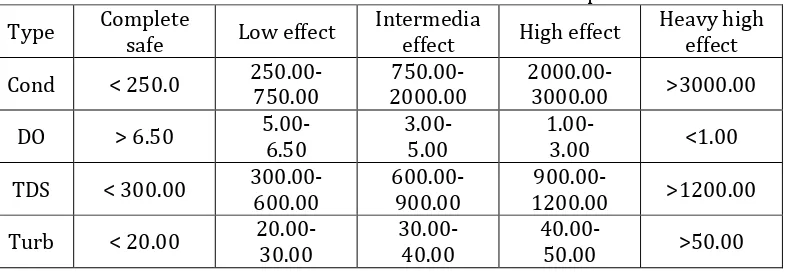
computing, training data, and threshold values. The design database of the standard threshold value for multi-parameter is shown in table 3.
Step 3: To design the database of classification. In this database design, we provide to the effect range based on case study, literature review and international organization for standardization [21], [22], [23], [24] as knowledge databases. The logic test is processed by using comparison or expression in PostgreSQL. The design database of classification of multi-parameter is shown in table 4.
Step 4: Step 4: To design the actuation and notification or warning system based on the trigger. In this step, we create the function of trigger for executing the automatic notification of threshold results in actuation part on the system by using the comparison or expression between the international standard value-classification range of water quality and observed water quality value.
Step 5: To map the input data onto the database. In this step, the input data are registered to the database and compared with the value in the water quality database by using international standard value and classification range.
Step 6:To execute the critical contaminate detection points by analyzing the multi-river water-quality parameters that relate to threshold value. The result from this step is the information of point, which has the over-threshold value as a contaminated point. The process will be the comparison or expression of the input data and knowledge database (turbidity, conductivity, salinity, dissolved oxygen and total dissolved solid).
Step 7: To execute the effect of classification in detail by analyzing the multi-river water-quality parameters that relate to classification range. The result from this step is the information of points, which indicates the classification range, and the process will be the comparison or expression of the input data and knowledge database, and then executes the effect of classification of each point (turbidity, conductivity, salinity, dissolved oxygen and total dissolved solid).
Step 8: To execute the critical contaminate detection and classification of multiple-parameter-water quality by real-time warning system. The result from this step is the information of current points, which are over-threshold values and classification ranges as critical points. The process is to make comparisons or expressions of the input data and knowledge database and to execute the effect of classification of each point.
Table 3. The database of standard threshold value for multi-parameter
Turb (NTU) Cond (μS/cm) Sal (ppt) DO (mg/L) TDS (mg/L)
Table 4. The database of classification of multi-parameter characteristic of water resource into 3 points as below
5.1.1 Physical characteristic
The color of water resource is an indicator to estimate the quality of water bodies. At the site, we observe the color of water resource in several points and we found the color of water bodies that is yellow and light brown, which can cause the form algae as Dinoflagellates (Ceratium furca).
5.1.2 Pollution source in river
The pollution source mainly causes low quality in the river because most of municipal and industrial lead the wastewater to the river by drainpipe. The waste disposal at riversides also leads the leached of waste to river or/and ground water. The main sources of pollution that we observe are as follows:
• Wastewater from municipal effluents
• Wastewater from decomposition of organic
• Inorganic compound waste in water body
• Waste disposal site
5.1.3 Characteristic of parameters can be divided into 2 groups
• The constantly changing parameters. It has been changed between points and the values depend on environment factors which are organic particles, decompose of the plant, animal matter, inorganic particle, heavy rain, algae blooms and transportation. All of the environmental factors make the turbulence in the water body, as turbidity parameter increases after transportation and wastewater drain. The constantly changing parameters are dissolved oxygen (DO), pH, Oxidation Reduction Potential (ORP), Temperature and turbidity (Turb).
5.2 The critical contaminate detection of multiple-parameter-waters
As this result from rSPA process and apply postgresSQL, the system will detect the input value and use standard threshold value (from knowledge database which is designed in material and method step).
The results of rSPA found the critical contaminate detection as below
• The conductivity is shown 8 points. In this area can be damage to the aquatic system by affected in the growth of aquatic life and vegetation, industrial by corrosive equipment, and irrigation by affected to water-quality. The results in detail show as the figure. 3.
• The dissolved oxygen (DO) is shown 15 points. In this area can be damage to aquatic system by decreased respiration and feeding activity of the aquatic life. The results in detail show as the figure. 4.
• The salinity is shown 10 points. In this area can be damage to aquatic system by affected to water and chemical by interrupted, agriculture system by affected to life and vegetation by decreasing osmotic pressure and effect on water equilibrium, and affects to osmosis process in crop and reduce growth by mechanism of water uptake, and industrial system by encrusted in process. The results in detail show as the figure. 5.
• Total dissolved solid (TDS) is shown 2 points. In this area can be damage to an agricultural system by cause death, sickness or impaired growth or degradation products of livestock and poultry, drinking water by affected to water taste and chronic damage to human body, industrial system by indirectly enters into equipment of industrial processes and cause damage and chronic corrosion, scaling and fouling in equipment, and irrigation system by caused accumulation of salts in the root zone, loss of permeability of the soil due to excess sodium (Na+) or calcium (Ca2+) leaching . The results in detail show as the figure. 6.
• Turbidity is shown 10 points. In this area can be damage to water by reduces the aesthetic quality and harmful impact in drinking water, aesthetically unpleasant, decrease rate of photosynthesis in the plant, increase water temperature and reduce water clarity. The results in detail show as the figure. 7.
Figure 3. The results of critical contaminate detection of conductivity: The result result has shown the critical value (left column) and information of
Figure 4. The results of critical contaminate detection of dissolved oxygen (DO): The result has shown the critical value (left column) and information of points.
Figure 5. The results of critical contaminate detection of salinity: The result has shown no the critical value and information of points because no value of each
point more that standard threshold.
Figure 6. The results of critical contaminate detection of total dissolved solid (TDS): The result has shown the critical value (left column) and information of
points.
Figure 7. The results of critical contaminate detection of turbidity: The result has shown the critical value (left column) and information of points.
5.3 The effect classification
This result from rSPA process and apply PostgresSQL, the system will detect the input value and use range effect for classification which design and provide in table 5 from knowledgebase discovery in water quality area as a knowledge database for analysis process of rSPA. The results of effect classification parameter as
• The effect classification of conductivity found 3 classes:
• Dissolved oxygen (DO) found 2 classes: high affect 4 points and very high affect 11 points.
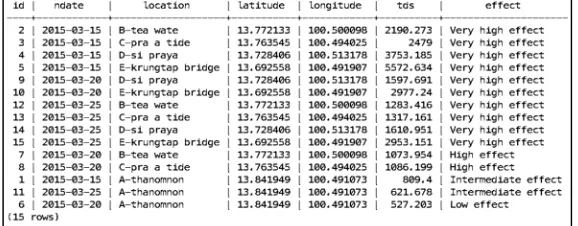
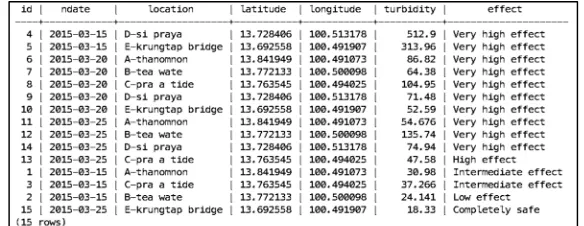
• Total dissolved solid (TDS) found 4 classes: low effect 1 point, intermediate effect 2 points, high effect 2 points and very high effect 10 points.
• Turbidity found 5 classes: completely safe 1 point, low effect 1 point, intermediate effect 2 points, high effect 1 point and very high effect 10 points
The results in detail are shown as figure. 8-11.
Figure 8. The results of classification of conductivity: The result has shown the value, effect class and information of points (2 last left column).
Figure 9. The results of classification of dissolved oxygen (DO): The result has shown the value, effect class and information of points (2 last left column).
Fig. 11. The results of classification of turbidity: The result has shown the value, effect class and information of points (2 last left column).
5.4 The critical contaminate detection and classification of multiple-parameter-waters by real-time warning system
The results of notification or warning system when applying trigger to rSPA. The system will work by detecting the value of data if input value of data more than standard threshold and made the classification and then sent output in term of information of point, value and effect class as
• The conductivity at E point (Krungtap Bridge on March 25, 2015), the value is 4122 and very high effect.
• The dissolved oxygen (DO) at E point (Krungtap Bridge on March 25, 2015), the value is 1.695 and very high effect.
• The salinity is not notification or warning because the input value of data less than standard threshed.
• The total dissolved solid (TDS) at E point (Krungtap Bridge on March 25, 2015), the value is 5572.634 and very high effect.
• The total turbidity at D point (Siphraya on March 25, 2015), the value is 74.94 and very high effect.
The results in detail show as figure 12-16.
Figure 12. The real-time notification system of conductivity: The result has shown the notification of parameter when the value more than the standard
threshold in part of value, effect class and information of points.
Figure 13. The real-time notification system of dissolved oxygen (DO): The result has shown the notification of parameter when the value more than the
Figure. 14. The real-time notification system of salinity: The result has shown the notification of parameter no data when the value less than the standard.
Figure 15. The real-time notification system of turbidity: The result has shown the notification of parameter no data when the value less than the standard.
Figure 16. The real-time notification system of total dissolved solid (TDS): The result has shown the notification of parameter no data when the value less than
the standard.
6. CONCLUSION
This paper has presented the river Sensing Processing Actuation processes (rSPA) for determination and classification of multiple-water-parameters in Chao Phraya river and has shown the method for water quality analysis in water resource primary concerning in Thailand.
We have made experimental study in the pollutants in Chao Phraya river, which have been accumulated to the downstream in the parts of conductivity, salinity and total dissolved solid (TDS).
The rSPA processes are the flexible tools to detect and classify water quality data with a simple framework. The results have expressed assessments as understandable visualizations, especially in public consideration. The rSPA is an effective process for realizing notification and warning system in river-water quality analysis.
As the future work, we will realize and extend rSPA processes to heavy metal compounds that dissolved and accumulated in water-bodies (which effect to ecosystem and environment).
Acknowledgements
REFERENCES
[1] V. Chalisa, Y. Kiyoki and S. Sasaki, “A Multi-dimensional River-water Quality Analysis System for interpreting Environmental Situations”
Proceedings of the 25th International Conference on Information Modelling and Knowledge Bases, Tampere Finland, ed. 1, p. 48-68. [2] Pollution Control Department, The Pollution Management Plan
2012-2016, Pollution Control Department: Ministry of Natural Resources and Environment, 2012.
[3] V. Chalisa, Y. Kiyoki, S. Sasaki and C. Petchporn, Wide-Area River-Water Quality Analysis and Visualization with 5D World Map System, Information Molling and Knowledge Bases XXVII, Vol. 280, pp. 31-41, 2016.
[4] JL. Badger, MF. Stins and K. Sik Kim, Citrobacter freundii invades and replicates in human brain micro vascular endothelial, Infect Immune, Vol. 67, pp. 4208-4215, 1999.
[5] K. Todar, Online textbook of bacteriology, University of Wisconsin-Madison Department of Bacteriology, 2008.
[6] US States Environmental Protection Agency, Water Quality Standards Handbook, Vol. 2, Washington, DC, 1994.
[7] Authority of the Minister of Health, Guidelines for Canadian Drinking Water Quality, Authority of the Minister of Health, Canada, 2013.
[8] M.F. Raisbeck, B.S. Riker, C.M. Tate, R. Jackson, M.A. Smite, K.J. Reddy and J.R. Zygmunt, Water Quality for Wyoming Livestock & Wildlife, University of Wyoming Department of Veterinary Science, 2008.
[9] J.R. Self and R.M. Waskom, Nitrates in Drinking Water, Colorado State University Soils Testing Laboratory Manager; & Colorado State Extension water quality specialist; soil and crop sciences, no.0.517, 2013.
[10] Y. Kiyoki and X. Chen, Contextual and Differential Computing for the Multi-dimensional World map with Spatial-Temporal and Semantic Axes, Information Modelling and Knowledge Bases (IOS Press), Vol. XXV, no 278 March 2014.
[11] L. Li, Y. Qian, Y. Zhang, Developing water pollution accident emergency warning system for Chu River downstream basin, 4th international conference on Bioinformatics and Biomedical Engineering (ICBBE), vol. 4, pp. 1-6, 2010
[12] L. Nan, F. Zetian, W. Boqi and Z. Xiaoshuan, FDEWS 2.0: A Web-GIS-Based Early Warning System for Fish Disease via Water Quality Management, Proceedings of the 6th World Congress on Intelligent Control and Automation, Vol. 1, pp. 2570-2574, 2006.
Processes” International Electronics Symposium (IES) co-sponsored IEEE Press, vol. 17 (2015), p. 212-217. 2015.
[14] International Organization for Standardization, Water Quality Sampling Part 6: Guidelines for Sampling of Rivers and Streams (ISO 5667-6), 2nd ed., Switzerland, 2005.
[15] Horiba Ltd. Multi-parameter Water Quality Checker U-50 series Instuction Munual, ed 1., Japan 2008.
[16] J. Kibena, I Nhapi, W. Qumindoga, Assessing the relationship between water quality parameter and changes in landuse patterns in the Upper Manyame River, Zimbabwe, Physics and Chemistry of the Earth, Vol 67-69, pp. 153-163, 2014.
[17] K. Intarukdach, S. Songprakhop, Water Quality Management Measures for Urban Areas, Wastewater Management Division, Pollution Control Department, Bangkok, Thailand, 2010.
[18] Ministry of Natural Resource and Environment, The standard of water quality of water body in Thailand, Ministry of Natural Resource and Environment, Bangkok, Thailand, 1994.
[19] R.S. Ayers and D.W. Westcon, Water Quality for Agriculture, Irrigation and Drainage, Food Agriculture Organization of the United Nations (FAO), 1994.
[20] United States Environmental Protection Agent, Parameters of Water Quality Interpretation and Standards, Ireland, 2001.
[21] Canadian Council of Ministers of the Environment, Canadian environmental quality guidelines, Canada, 2007.
[22] N. Bharti and D. Katyal, Water quality indices used for surface water vulnerability assessment, Int. J. Environ. Sci. 2, vol 1, pp. 154-173, 2011.
[23] New York State Department of Environmental, Interpretation Guidance for Marien Dissolved Oxygen (DO) Standard TOGS 1.1.6, Conservation, Albany, New York, 2015.
![Table 1. The definitions of characteristic for physical, chemical and microbiological contamination [3] (Cont.)](https://thumb-ap.123doks.com/thumbv2/123dok/4040611.1984031/4.595.101.497.118.370/table-definitions-characteristic-physical-chemical-microbiological-contamination-cont.webp)
![Figure 1. The architecture of processes [13]](https://thumb-ap.123doks.com/thumbv2/123dok/4040611.1984031/5.595.184.441.577.725/figure-the-architecture-of-processes.webp)