Radiation Metrology for Environmental in Indonesia
Gatot Wurdiyanto
Center for Technology of Radiation Safety and Metrology,National Nuclear Energy Agency of Indonesia
Jl. Lebak Bulus Raya No. 49 Jakarta Selatan, 12440 Indonesia, E-mail: [email protected]
Abstract. Utility of nuclear technology in every field is growing rapidly. Along with the use of this technology it requires increased safety and awareness of the impact of the utilization of this technology. One indicator to determine the increased radiation exposure is by measuring the level of radioactivity in the environment. Environmental radiation has very low levels of radioactivity with different types of radioactive and its daughter. The special problem in low level counting is that the ratios of counting rates of sample to background are often so low that significant modifications to the measurement system are needed to improve sensitivity. Various environmental radiation measurement methods have evolved with society needs security and safety against the use of nuclear technology. PTKMR-BATAN has prepared various measurement methods as well as some standard sources to conduct environmental radiation measurements accurately and have traceability to the international system of units. The measurements of environmental radiation is very useful to obtain data which can then be used to help make the correct decisions to properly care for our environment. Keywords : nuclear technology, environmental radiation, metrology
Introduction
Radioactivity measurements on environmental samples are usually made to assure that levels are kept below current maximum permissible concen-trations. The larger number of radionuclides found in the environment can be divided into four categories : namely,
(i) “natural” radioactivity from uranium, thorium, and other primordial radionuclides;
(ii) radionuclides produced by cosmic-ray inter-actions in the atmosphere;
(iii) The man made contaminants from nuclear weapons fallout and effluent from nuclear facilities.
(iv) Radioactive tracer studies have also been used to measure transport phenomena.
The special problem in low level counting is that the ratios of counting rates of sample to background are often so low that significant modifi-cations to the measurement system are needed to improve sensitivity. Some extensive general refe-rences in this field are Watt and Ramsden (1964), ICRU (1972), Harley (1972), and NCRP (176b; 1983; 1984)
Normally there are four steps in the measure-ment of environmeasure-mental radioactivity :
1. Selecting measurement system 2. Collecting a suitable sample
3. Separating and, or, concentrating the desired species by radiochemical and, or, physical means 4. Assaying the radioactivity in the source with a detector that has been calibrated under counting conditions with appropriate radioactivity standards.
This paper describes the preparation and the things that have been done in Radiation Metrology Laboratory in order to conduct radiation measure-ments for environmental samples. The purpose of this paper is to improve the ability of Radiation Metrology Laboratory, PTKMR-BATAN which is a reference laboratory in the field of radiation measurements in providing radiation measurement of environmental samples accurately, precission and traceable so as to meet domestic needs.
Methodology/Theoritical
Selecting of a Low-Level-Measurement System
The choice of a measurement system for a particular application is based on a consideration of such factors as : cost, amount of sample available, type and intensity of radiation to be measured by the detector, time available of counting, background, and efficiency. Many expressions have been develop that are useful in comparing different detectors or different measurements system. For example, Moghissi (1970) derived an expression often used for comparing liquid-scintillation-counting systems, as a Y value as minimum radioactivity concentration detectable for a one-minute counting time as :
Y(pCi/g) = √B / 2.22 MƐ ... (1)
Where :
B = background count rate, in counts per minute Ɛ = counting efficiency, in counts per minute per
disintegration per minute, M = sample mass (g)
and constant 2.22 is number of disintegrations per minute per picocurie.
be considered in optimizing the sensitivity of the measurement process. It can be seen that equation 6.1 is of the general form :
Constant x Detection Limit
Y(pCi/g) = --- , ...(2) Sample Size x Efficiency
Where Moghissi used √B as the detection limit. In the more general case, detection limits and efficiency terms wiol depend on th system under consideration. Some comments concerning detection limits, sample size, and background that way aid in evaluating a measurement procedure are given in the following paragraphs.
Detection limits
The problem of assigning an a priori detection limit to a measurement involves the theory of hypothesis testing. Basically one must decide whether a given response is statistically different (at prescribed confidence limits) from the background response. This problem has been examined by Altshuler and Pasternack (1963), Currie (1968), Pasternack and Harley (1971), and Donn and Wolke (1977).
In the simple case, a counting system is set up to detect the radiation of interst and the total number of counts recorded for equal periods of time as diffrent samples are put in place. Let Nt be the
number of counts recorded with an unknown sample and Nb be the number of recorded counts when a
blank sample is substituted to determine the black gound level. The net counts resulting from the unknown are then calculated as :
Ns= Nt– Nb ... ( 3 )
To make a decision whether the sample contains activity, Ns is then compared with a critical level, Lc that will be detemined in the analysis that follows. A simple protocol is followed: if Nsis less than Lc,
it is concluded that the sample does not contain activity, where as if Ns exceeds Lc, it is assumed that some real activity is present.
Fig.1.The distributions expected for the net counts Ns for the cases of (a) no activity present, and (b) a real activity present. Lc represents the critical level or “trigger point” of the counting system.
Sample Size
The sample size will usually be limited by such practical aspects as cost, shipping, and storage space. In the laboratory, other limitations on sample size may be imposed by the analytical procedure or physical dimensions of the detector and shielding. For each detector, there will also be an optimum sample size and shape that will depend on conside-rations such as the average distance of penetration of the radiation within the source, and on geometry.
Background
The background may be defined as the count rate observerd when measuring a “blank” that simulates as closely as possible in chemical compo-sition and physical form the source being measured. Care shoud be taken that the structural mterials and reagents used in the preparation of the blank and the counting sample contain minimal activity.
Preparation of Sample Standard
To make use of solution radioactivity standards, it is necessary to take quantitative samples. This involves leaving the standard in the laboratory for a sufficient length of time to attain thermal equilibrium. Then the solution is mixed by gently shaking and inverting the ampoule to avoid error caused by condensation on the upper walls of the vessel. It is important to allow the liquid to drain from the neck after the last inversion, then to open ampoule and transfer quickly most of the solution to another vessel, which is closed immediately. Such simple precautions will avoid the most common sources of error in sampling solution, i.e., inadequate mixing and losses due to evaporation. If the sample is to be taken volumetrically, the vessel to which the solution is transferred is usually a small volumetric flask whereas, for gravimetric sampling, the solution is transferred to a pycnometer if the dispensing is to be done forthwith.
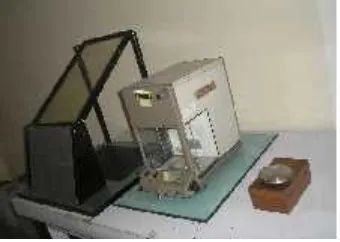
Fig. 2. Semimicro-balance apparatus.
The amount of radioactive material that is prepared is dependent on the equipment used. To create a standard source that has a specific activity, then the dilution factor plays an important role.
III. Measurement Methods
There are several methods for measuring the radiation environment. This depends on the type of source, decay model, intensity and energy of gamma ray, half-life, a form of material, standard source or a measuring tool that belongs. Several methods have been developed in the Radiation Metrology Labora-tory, PTKMR-BATAN is like the statement below.
a. Gamma Spectrometry System
Gamma-ray spectrometry in the environment has been applied over two or three decades by a small group of expert teams, mainly for uranium prospecting and for environmental monitoring [a]. Gamma ray spectrometry with germanium semi-conductor or NaI scintillation detectors as a tool for assay of radionuclide is described in various text books (e.g. Debertin and Helmer, 1988; Hnatowicz, 1986; Knoll, 1989).
This tool is very simple and practical as it can perform qualitative and quantitative analysis, however, these tools require adequate standard source in use. The main considerations in deter-mining a standard source is to have traceability to the system of international units , has a range of sufficient energy, the intensity of gamma ray which is quite large, the amount of activity that is appro-priate, the geometry and the same matrix, homo-geneous, and has a long half-life. Gamma spectro-meter device used to measure environmental radia-tion as is nowhere menradia-tioned in the paragraphs below.
The detector is an HPGe model GC1018 (Canberra, USA), which has a relative efficiency of 10.3% with an energy resolution of 1.69 keV FWHM at 1332.5 keV. The detector is equipped
Fig.3. Gamma Spectrometer System.
with a model 2002CSL pre-amplifier, and a Canberra model 2020 amplifier and operates at a bias voltage of +4500 V. Signals from the detector are processed by the Canberra gamma spectrum analysis system using GENIE 2000 software (Canberra Industries, USA).
b. -(LS)–Coincidence System
This system can measure the activity of a single sample in absolute terms by combining the use of a tracer method. The use of a liquid scintil-lation detector makes the detection efficiency becomes higher so that the measurement becomes faster and more accurate. However, this method requires a source other radionuclides that acts as a tracer. Sources of radioactive tracer is used usually have the same chemical properties, so it will be homogeneous when mixed. This system can also be used to measure beta and alpha particles depending on the working voltage detector to be used.
The measurement of activity by the coinci-dence method can be applied to any nuclear decay involving two or more distinguish able radiations occurring in prompt succession. Two detectors are usually required, each of which responds, ideally, to one only of two types of radiation. A third counting channel, derived from a coincidence circuit, records those events from the two detectors that occur in coincidence. Then, for simple two-stage beta-gamma decay of a source with a true disintegration rate No, and with beta- and
gamma-detector efficiencies , , the channel counting rates would be :
N= No; N= No; and Nc= No ... (4)
The value of No is then simply NN/Nc and No
knowledge of the detector efficiencies is required, but, in this simple case, these latter clearly emerge from the data, with equal to N/No or Nc/Nand
equal to N/Noor Nc/N.
Fig. 4. 4-coincidence system.
c. Alpha-Particle Spectrometer System
The measurement of alpha–particle by spectro-metry system, the source should be in very thin layer to provide maximum resolution. If absorption corrections are to be less than 1 percent, the source thickness should be less than 1 percent of the average range of the alpha particles when counting in a 2configuration (Lucas and Huchinson, 1976). This criterion means that a sample of low atomic weight should have a surface density of approxi-mately 100g/cm2or less.
The use of silicon surface-barrier semiconductor detectors, that were previously fragile and costly, are now probably the most widely used in alpha-particle spectrometry. A 1- cm2actice area detector typically has a resolution of 15 to 20 keV FWHM for 5.5 MeV alpha particles emitted from source 1.5 detector diameters away. Placing the source closer to the detector increases the detection efficiency at the expense of degraded resolution. This fact may necessitate more extensive sample preparation prior to counting than for pulse-ionization detection. Electrodeposition and evaporation are frequently used as the final step to cancentrate the activity on to a small area.
d. Beta-Particles Spectrometer System
We are use plastic scintillator as detectors for beta-particles spectrometry. While the continuous energy spectrum of beta particles precludes the high selectivity offered among radionuclides in -ray spectrometry, situations arise where beta-particle spectrometry is nevertheless of value. In such appli-cations the scintillator should have a thickness sufficient to absorb the full energy of incident beta particles, e.g. about 1-2 cm. The use of plastic scintillators with shapes other than discs can reduce the scattering of beta particles out of the detector and
the distorsion of spectral shapes, and increase the detection efficiency (Gardner and Meinke, 1958). The probability of gamma rays interacting with these specially-shaped scintillators is greater because of their larger size. Hence, these scintillators have higher backgrounds than simple disc-shaped scintillators.
To obtain beta-ray spectra, of medium to high energy, scintillator pulses from only those events which are coincident in the two detectors are recorded by a pulse-height analyzer. With the addition of a logaritmic amplifier to the system, Tanaka, et al. (1967) were able to interpret, without complicated calculations, beta particle spectra from radionuclides with beta-particle end-point energies as low as approximately 150 keV, as for example,
35S and14C.
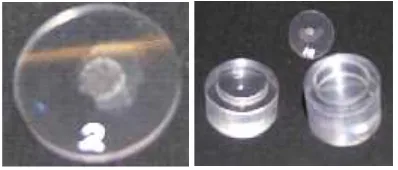
We use two geometries for the UPS-89 plastic scintillators, as shown in Fig 5.(a) and (b). Geometry G1 consists of two 1mm thick, 25mm diameter well-polished plastic scintillator disks are bound together with optical cement. Geometry G2 is a fitting together of two well-polished cylinders. Each of the cylinders was machined as a single scintillating piece.
Fig. 5. Plastic Scintillation.
IV. Result and Discusion
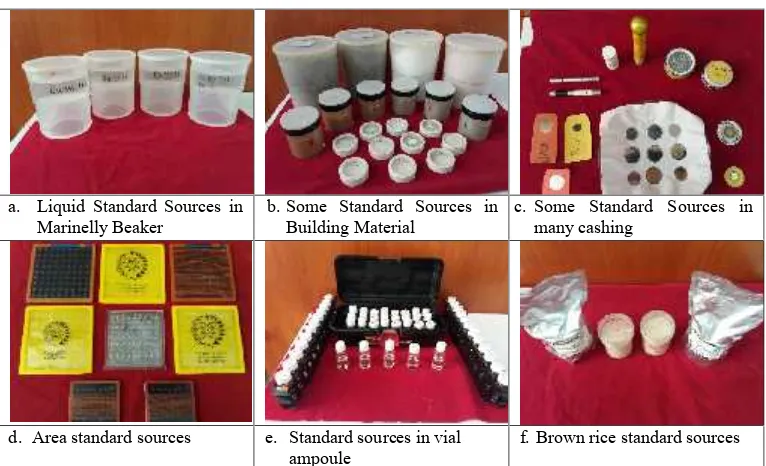
Some sources of standards prepared by the Radiation Metrology Laboratory PTKMR-BATAN for the measurement of low activity, shown in Fig. 6.
Figure 6a, shows many liquid standard sources in a container of 1 liter Marinelly beaker. The radionuclide of Standard sources are 152Eu, 133Ba,
mix standard sources60Co,134Cs and137Cs, and the
mixture 133Ba and 137Cs. The use of the liquid
standard sources in the container Marinelly improve the efficiency of the detector more than 10 times compared to a point standard source for the gamma-ray energy below 200 keV. Figure 6b, shows many various geometries of 152Eu standard sources in a
Figure 6c, shows a variety of sources that standards were prepared by electro deposition method in PTKMR-BATAN, also there been a source of standard 131I in charcoal for calibrating
iodine monitoring detector. In the picture there is also some stick standard sources that can be used to calibrate surveymeter in environment radiation level. Figure 6d. indicate the various sizes of area sources, i.e,14C,90Sr and241Am. This can be used to calibrate
surface barrier detectors, or detector contamination. Figure 6e shows the default source in the glass vial. The type of this sources are measured using the -absolute coincidence system or by LSC. Figure 6f, are manybrown rise standard sources from the Fukushima accident. In addition PTKMR has also made standard sources with existing domestic rice.
The ANSTO, BARC, INER and NMIJ measured the activity using a proportional counter
for an -counter and made coincidence measure-ments with a NaI (Tl) scintillation -counter. The BARC also measured the activity using a liquid scintillation counter with the CIEMAT/NIST method (CN2003) with 3H used as a tracer. The
KRISS measured the activity using a pressurized proportional counter for an counter and made coincidence measurements with a NaI(Tl) scintil-lation -counter. The OAP measured the activity using a well-type pressurized ionization chamber, whose response was determined by using51Cr,57Co, 60Co, 85Sr, 134Cs and 137Cs solution calibrated by
NMIJ. The PTKMR measured the activity using a high-purity Germanium detector whose efficiency was determined by152Eu point source.
a. Liquid Standard Sources in Marinelly Beaker
b. Some Standard Sources in Building Material
c. Some Standard Sources in many cashing
d. Area standard sources e. Standard sources in vial ampoule
f. Brown rice standard sources
Fig. 6. Many kind and type of standard sources made by PTKMR-BATAN
V. Conclusion
The Radiation Metrology Laboratory PTKMR-BATAN has made efforts in preparing the standard radioactive source for measuring the radiation levels of the environment. Some sources of certain standards such as (152Eu, 134Cs, 137Cs, 60Co, 133Ba, 131I, 125I, 241Am, etc.) standardized by the absolute
method order has a value of uncertainty smaller. Efforts undertaken include mastery of measurement methods, equipment and adequate facilities, and human resources support reliable. PTKMR-BATAN has prepared various measurement methods as well as some standard sources to conduct environmental radiation measurements accurately and have trace-ability to the international system of units. The measurements of environmental radiation is very useful to obtain data which can then be used to help make the correct decisions to properly care for our environment.
Acknowledgments
The author would like to thank the Government of Indonesia, especially the leaders of all ranks BATAN which has provided the opportunity to successfully complete this study.
References
1. ICRU Report 53, Gamma-Ray Spectrometry in the Environmental, issued : 1 December 1994, Maryland, USA.
2. Moghissi A. A., (1970), “Low Level Liquid Scintillation Counting of and emitting Nuclides”, page 86 in The Current Status of
Liquid Scintillation Counting, Bransome, E. D.,
Ed, (Grune & Stratton, New York).
3. Altshuler, B., and Pasternack, B. S. (1963), “Statistical Measures of The Lower Limit of Detection of a Radioactivity Counter”, Health Phys. 9. 293.
4. Currie L. A., (1968), “Limits for Qualitative Detection and Quantitative Determination. Applications to Radiochemistry”, Anal. Chem. 40, 586.
5. Pasternack, B. S., and Harley, N. H., (1971), “Detection Limits for Radionuclides in the analysis of Multi-Component Gamma Ray Spectrometer Data”, Nucl. Instrum. Methods 91, 533.
6. Donn, J. J. and Wolke, R. L., (1977). ”The Statistical Interpretation of Counting Data From Measurements of Low-Level Radioacti-vity”, Health Phys. 32.1
7. Moran, J. J. (1967), “Measurement of Volume : Liquid”, Page 4279 in Treatise on Analytical
Chemistry, Part 1, Vol. 7, Kolthoff, I. M., Elving, P. J., and Sandell, E. B., Eds. (John Wiley, New York).
8. Merritt, J.S., (1973). “Present Status in Quanti-tive Source Preparation” Nucl. Instrum. Methods, 112, 325.
9. Campion et al., 1964, “ A Study of weighing techniques used in Radionuclide Standardi-zation”, Nucl. Instrum. Methods 31, 253. 10. Debertin, K., and Helmer, R.G.(1988), Gamma
and X-Ray Spectrometry with Semiconductor Detectors ; North Holland, Amsterdam. 11. Hnatowicz, V., (1986). Handbook of Nuclear
Data for Neutron Activation Analysis, Vol. I, Evaluation of Gamma-Ray Spectra (Nuclear Information Center, Czechoslovak Atomic Energy Commission).
12. Knoll, G. F. (1989), Radiation Detection and Measurement, 2nd ed., (Wiley and Sons, New
York).
13. Lucas, L.L., and Huctchinson, J. M. R. (1976), “Study of the scattering Correction for thick Uranium-Oxide and Other Alpha-Particle Sources-Part I; Theoretical, “Int. J. Appl. Radiat. Isot., 27, 35.
14. Gardner, D. G., and Meinke, W.W. (1958), “ -Ray Spectroscopy Using a Hollow Plastic Scintillator”, Int. J. Appli. Radiat. Isot. 3, 232. 15. Tanaka, S., Sakamoto, K. and Takagi, J.
(1967). “An extremely low-level gamma-ray spectrometer”, Nucl. Instrm. Methods 56, 319. 16. Youcef Nedjadi, Claude J. Bailat, Francois O.