PENGANTAR
Pelayanan rumah sakit sebagai industri jasa merupakan bentuk upaya pelayanan kesehatan yang bersifat sosioekonomi, yaitu suatu usaha yang walau bersifat sosial namun diusahakan agar bisa memperoleh surplus dengan cara pengelolaan yang profesional. Rumah sakit merupakan institusi yang sifatnya kompleks dan sifat organisasinya majemuk, maka perlu pola manajemen yang jelas dan modern untuk setiap unit kerja atau bidang kerja.1 Sebagai contoh pada bidang manajemen Hiperkes dan Keselamatan Kerja.
Survey nasional di 2.600 rumah sakit di USA rata-rata tiap rumah sakit 68 karyawan cedera dan 6 orang sakit (NIOSH 1974-1976). Cedera tersering adalah strain dan sprain, luka tusuk, abrasi, contusio, lacerasi, cedera punggung, luka bakar dan fraktur. Penyakit tersering adalah gangguan pernapasan, infeksi, dermatitis dan hepatitis. Hasil identifikasi hazard RS ditemukan adanya gas anestesi, ethylen oxyde dan cytotoxic drug.
Laporan NIOSH 1985 terdapat 159 zat yang bersifat iritan untuk kulit dan mata, serta 135 bahan kimia carcinogenic, teratogenic, mutagenic yang dipergunakan di rumah sakit. California State
MANAJEMEN HIPERKES DAN KESELAMATAN KERJA
DI RUMAH SAKIT
(TINJAUAN KEGIATAN KESELAMATAN DAN KESEHATAN KERJA
DI INSTITUSI SARANA KESEHATAN)
OCCUPATIONAL SAFETY HEALTH AND ENVIRONMENT MANAGEMENT AT HOSPITAL (Contemplation Occupational Health and Safety Activity at Health Services Field)
Hamzah Hasyim
Fakultas Kedokteran Program Studi Kesehatan Masyarakat, Universitas Sriwijaya, Sumatera Selatan
ABSTRACT
Implementation Occupational Safety Health and Environment (OSHE) management at hospital represent the effort in realizing safe, comfort and hygiene job environment, protect and improve the health employees, safe and have high performance.
According to regional and multilateral agreement like AFTA 2003, APEC 2005 and WTO 2020 requiring corporate world were inclusive of hospital to do various effort in anticipating globalization, which issues human right problems, equation of gender and health environmental. One of fundamental issue and important to prerequisite of competition and international standard demand were Occupational Health and safety (OHS) issue which related to issue of labor protection and human right.
Applying of Policy of OSHE management hospital represent the part of activity process to reach productivity, was required to increase competitiveness and also strive in anticipating resistance of technique era commerce and globalization.
Keywords: Occupational Safety Health and Environment (OSHE) management, hospital
Departement of Industrial Relations menuliskan rata-rata kecelakaan di rumah sakit 16,8 hari kerja yang hilang per 100 karyawan karena kecelakaan. Karyawan yang sering mengalami cedera, antara lain: perawat, karyawan dapur, pemeliharaan alat, laundry, cleaning service, dan teknisi. Penyakit yang biasa terjadi antara lain: hypertensi, varises, anemia, ginjal (karyawan wanita), dermatitis, low back pain, saluran pernapasan, dan saluran pencernaan.2 Klaim kompensasi karyawan RS lebih besar dibanding pegawai sipil lain.2
Risiko bahaya dalam kegiatan rumah sakit dalam aspek kesehatan kerja, antara lain berasal dari sarana kegiatan di poliklinik, bangsal, laboratorium, kamar rontgent, dapur, laundry, ruang medical record, lift (eskalator), generator-set, penyalur petir, alat-alat kedokteran, pesawat uap atau bejana dengan tekanan, instalasi peralatan listrik, instalasi proteksi kebakaran, air limbah, sampah medis, dan sebagainya.3
jaminan terhadap kecelakaan, jaminan kematian, serta syarat-syarat kerja lainnya. Hal tersebut perlu dikembangkan secara terpadu dan bertahap dengan mempertimbangkan dampak ekonomi dan moneter-nya, kesiapan sektor terkait, kondisi pemberi kerja, lapangan kerja, dan kemampuan tenaga kerja. Amanat GBHN ini menuntut dukungan dan komitmen untuk perwujudannya melalui penerapan K3. Upaya K3 sendiri sudah diperkenalkan dengan mengacu pada peraturan perundangan yang diterbitkan sebagai landasannya. Di samping UU No. 1/1970 tentang Keselamatan Kerja, upaya K3 telah dimantapkan dengan UU No. 23/1992 tentang Kesehatan, yang secara eksplisit mengatur kesehatan kerja. 3
Dalam peraturan perundangan tersebut ditegaskan bahwa dalam setiap tempat kerja wajib diselenggarakan upaya keselamatan dan kesehatan kerja. Hal itu mengatur pula sanksi hukum bila terjadi pelanggaran terhadap ketentuan tersebut. Undang-Undang No. 23/1992 tentang Kesehatan yang menyatakan bahwa tempat kerja wajib menyelengarakan upaya kesehatan kerja apabila tempat kerja tersebut memiliki risiko bahaya kesehatan yaitu mudah terjangkitnya penyakit atau mempunyai paling sedikit 10 orang karyawan. Rumah sakit sebagai industri jasa termasuk dalam kategori tersebut, sehingga wajib menerapkan upaya Keselamatan dan Kesehatan Kerja Rumah Sakit (K3RS). Upaya pembinaan K3RS dirasakan semakin mendesak mengingat adanya beberapa perkembangan. Perkembangan tersebut antara lain dengan makin meningkatnya pendayagunaan obat atau alat dengan risiko bahaya kesehatan tertentu untuk tindakan diagnosis, terapi maupun rehabilitasi di sarana kesehatan. Terpaparnya tenaga kerja (tenaga medis, paramedis, dan nonmedis) di sarana kesehatan pada lingkungan tercemar bibit penyakit yang berasal dari penderita yang berobat atau dirawat, adanya transisi epidemiologi penyakit dan gangguan kesehatan. Hal tersebut diikuti dengan masuknya IPTEK canggih yang menuntut tenaga kerja ahli dan terampil. Hal ini yang tidak selalu dapat dipenuhi dengan adanya risiko terjadinya kecelakaan kerja. Untuk itu diperlukan adanya peningkatan SDM di sarana kesehatan, tidak saja untuk mengoperasikan peralatan yang semakin canggih namun juga penting untuk menerapkan upaya K3RS. 2,3
Program Occupational Safety Health and Environment (OSHE) bertujuan melindungi karyawan, pimpinan, dan masyarakat dari kemungkinan terjadinya kecelakaan dan penyakit akibat kerja (PAK) (singkatannya), menjaga agar alat dan bahan yang dipergunakan dalam proses
kegiatan yang hasilnya dapat dipakai dan dimanfaatkan secara benar, efesien, serta produktif. Upaya OSHE sangat besar peranannya dalam meningkatkan produktivitas terutama mencegah segala bentuk kerugian akibat accident. Masalah penyebab kecelakaan yang paling besar yaitu faktor manusia karena kurangnya pengetahuan dan keterampilan, kurangnya kesadaran dari direksi dan karyawan sendiri untuk melaksanakan peraturan perundangan K3 serta masih banyak pihak direksi menganggap upaya K3RS sebagai pengeluaran yang mubazir, demikian juga dikalangan karyawan banyak yang menganggap remeh atau acuh tak acuh dalam memenuhi SOP kerja. Penyebab lain adalah kondisi lingkungan seperti dari mesin, peralatan, pesawat, dan lain sebagainya. 2
RISIKO BAHAYA POTENSIAL DI RUMAH SAKIT Penyakit akibat kerja di sarana kesehatan umumnya berhubungan dengan berbagai faktor biologis (kuman patogen; pyogenic, colli, baccilli, stapphylococci, yang umumnya berasal dari pasien). Begitu besar risiko yang akan dihadapi apabila masalah sanitasi termasuk pengelolaan limbah, kurang mendapat perhatian yang serius. Tahun 1977 dari seluruh rumah sakit di AS menunjukkan bahwa penderita yang dirawat 5%-10% menderita infeksi nosokomial (Hospital Ac-quired Infection). Di AS insiden infeksi nosokomial ± 5% dan CFR 1 %, di U.K ± 9,2%, di Malaysia prevalens ± 12,7%, di Taiwan insiden ± 13,8%, di Jakarta ± 41,1%, di Surabaya ± 73,3% dan di Yogyakarta ± 5,9%. Hari perawatan pasien yang menderita infeksi nosokomial tersebut bertambah 5-10 hari, demikian pula angka kematian pasien menjadi lebih tinggi yaitu sebesar 6% dibanding yang tidak terkena infeksi nosokomial hanya sebesar 3%. Tenaga medis RS mempunyai risiko terkena infeksi 2-3 kali lebih besar daripada medis yang berpratik pribadi. Kerugian akibat penambahan hari perawatan dan pengobatan tersebut mencapai lebih dari 2 milyar US. 3
Dapat dibayangkan bagaimana besarnya kerugian itu seandainya dihitung untuk rumah sakit di Indonesia, dimana kondisi sanitasi dan K3RS yang pada umumnya masih lebih buruk.
yang terus menerus (kebisingan dan getaran diruang generator, pencahayaan yang kurang dikamar operasi, laboratorium, ruang perawatan, suhu dan kelembabam tinggi diruang boiler dan laundry, tekanan barometrik pada decompression chamber, radiasi panas pada kulit, tegangan tinggi pada sistem reproduksi, dan lain-lain) serta faktor psikososial (ketegangan dikamar bedah, penerima pasien gawat darurat dan bangsal penyakit jiwa, shift kerja, hubungan kerja yang kurang harmonis, dan lain-lain).3
Bagian pemeliharaan terpajan dengan solvent, asbes, listrik, bising, dan panas. Karyawan di bagian cleaning service terpajan deterjen, desinfektan, tertusuk sisa jarum suntik dan lain-lain. Karyawan katering sering mengalami tertusuk jari, luka bakar, terpeleset, keletihan, stres kerja, dan lain-lain. Teknisi radiologi potensial terpajan radiasi dari sinar X dan radioaktif isotop atau zat kimia lainnya. Perawat sering cedera punggung, terpajan zat kimia beracun, radiasi, dan stres akibat shift kerja. Petugas di ruang operasi mempunyai risiko masalah reproduksi atau gastroenterologi Pajanan limbah gas anaestesi, risiko luka potong – tusuk, radiasi, dan lain-lain. 2
Rumah sakit merupakan penghasil sampah medis atau klinis terbesar, yang kemungkinan mengandung mikroorganisme patogen, parasit, bahan kimia beracun dan radioaktif. Hal ini dapat membahayakan dan menimbulkan gangguan kesehatan baik bagi petugas, pasien maupun pengunjung rumah sakit. Di samping itu, jika pengelolaannya tidak baik dapat menjadi sumber pencemaran terhadap lingkungan yang pada gilirannya akan menjadi ancaman terhadap kesehatan masyarakat yang lebih luas. Pengelolaan sampah dan limbah rumah sakit merupakan bagian dari upaya penyehatan lingkungan, bertujuan melindungi masyarakat akan
bahaya pencemaran lingkungan yang bersumber dari sampah atau limbah rumah sakit. 3,4,5
Peraturan Pemerintah RI No 19/1994 menetapkan bahwa limbah hasil kegiatan RS dan laboratoriumnya termasuk dalam daftar limbah B3 dari sumber yang spesifik dengan kode limbah D227.1 Sesuai dengan Permenkes No. 986 Menkes/Per/XI/1992, tanggal 14 November 1992 tentang prasyaratan kesehatan lingkungan rumah sakit meliputi; penyehatan bangunan dan ruangan termasuk pengaturan pencahayaan, penghawaan serta pengendalian kebisingan, penyehatan makanan dan minuman, penyehatan air termasuk kualitasnya, pengelolaan limbah, penyehatan tempat pencucian umum termasuk pencucian linen, pengendalian serangga dan tikus, sterilisasi atau desinfeksi, perlindungan radiasi serta penyuluhan kesehatan lingkungan. 6
PENGENDALIAN PENYAKIT DAN KECELAKAAN AKIBAT KERJA DI RS/SARANA KESEHATAN
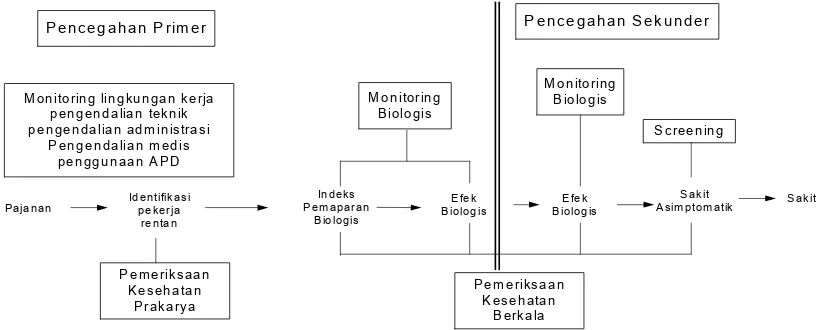
Dalam pelayanan kesehatan kerja dikenal tahapan pencegahan PAK dan kecelakan akibat kerja (KAK) yakni pencegahan primer, meliputi pengenalan hazard (potensi bahaya), pengendalian pajanan yag terdiri dari monitoring lingkungan kerja, monitoring biologi, identifikasi pekerja yang rentan, pengendalian teknik, administrasi, pengunaan APD. Pencegahan sekunder meliputi screening penyakit, pemeriksaan kesehatan berkala, pemeriksaan kesehatan bagi pekerja yang berpotensi terpajan hazard tertentu, berdasarkan peraturan perundangan (statutory medical examination).7
Pelayanan kesehatan kerja juga diberikan pada tahapan pencegahan tersier meliputi upaya disability limitation dan rehabilitasi. Pelayanan kesehatan kerja tersebut, seperti yang diilustrasikan pada Gambar 1 di bawah ini.
! !" # $ ! ! " % &" ' (
Gambar 1. Pelayanan Kesehatan Kerja dalam Konsep Pencegahan Penyakit yang Timbul Akibat Hubungan Kerja
Dengan kata lain pengendalian PAK dan KAK di RS meliputi:
1. Legislative control seperti peraturan perundangan, persyaratan-persyaratan tehnis dan lain-lain
2. Administrative control seperti seleksi karyawan, pengaturan jam kerja dan lain-lain 3. Engineering control seperti substitusi/isolasi/
perbaikan sistem dan lain-lain serta 4. Medical control
DASAR HUKUM MANAJEMEN HYPERKES DAN KESELAMATAN KERJA DI RUMAH SAKIT
Beberapa standar hukum yang digunakan sebagai landasan pelaksanaan manajemen hyperkes dan keselamatan kerja di rumah sakit antara lain;
1. Undang-Undang No 14/1969 tentang Ketentuan Pokok Tenaga Kerja.
2. Undang-Undang No 1/1970 tentang Keselamatan Kerja.
3. Undang-Undang No 23/1992 tentang Kesehatan.
4. Permenkes RI No 986/92 dan Kep Dirjen PPM dan PLP No HK.00.06.6.598 tentang Kesehatan Lingkungan RS.
5. Permenkes RI No 472/Menkes/Per/V/96 tentang pengamanan bahan berbahaya bagi kesehatan.
6. Kepmenkes, No. 261/MENKES/SK/II/1998 dan Kep Dirjen PPM dan PLP No HK. 00.06.6.82 tentang Petunjuk Tehnis
Pelaksanaan Persyaratan Kesehatan Lingkungan Kerja.
7. Kepmenkes, No. 1335/MENKES/SK/X/2002 tentang Standar Operasional Pengambilan dan Pengukuran Sampel Kualitas Udara Ruang RS.
Pengorganisasian K3 di rumah sakit berdasarkan atas;
1. Surat edaran Direktur Jenderal Pelayanan Medik No.00.06.6.4.01497 tanggal 24 Februari 1995 tentang PK3-RS
2. Optimalisasi fungsi PK3-RS dalam pengelolaan K3 RS
3. Akreditasi RS
4. Audit manajemen K3 RS
5. SK MenKes No 351/MenKes/SK/III/2003 tanggal 17 Maret 2003 tentang Komite Kesehatan dan Keselamatan Kerja Sektor Kesehatan
6. SKB No. 147 A/Yanmed/Insmed/II/1992 Kep. 44/BW/92 tentang Pelaksanaan Pembinaan K3 Berbagai Peralatan Berat Nonmedik di Lingkungan RS
Salah satu contoh struktur organisasi rumah sakit BUMN yang telah mencantumkan manajemen hiperkes dan Keselamatan Kerja RS, yang diimplementasikan kedalam sistem manajemen sanitasi rumah sakit dan pengendalian infeksi nosokomial serta manajemen keselamatan kerja terlihat seperti pada Bagan 1.
* 2
#
3 4 5
2 4
6 7 8
4 6 *
2 *
2 * 9 8 3
2
' 3
4
; 3 ; $
; 3 ; $
; 3 ; $
; 3 $
$ 3 $ $
; 3 ; $
3 ; $
3 ; ; $
3 ; ; $
3 ; ; $
3 ; $
$ $ 3 $
; ; 3 $
3 $
$ $ $ 3
$ $ $ $
$ $ $ $
$ $ $ $
$ $ $ $ 3
Bagan 1. struktur salah satu organisasi rumah sakit BUMN Keterangan
U = Unit dari
X = Interaksi medis tehnis O = Interaksi medis administrasi
PELAKSANAAN MANAJEMEN K3 RS
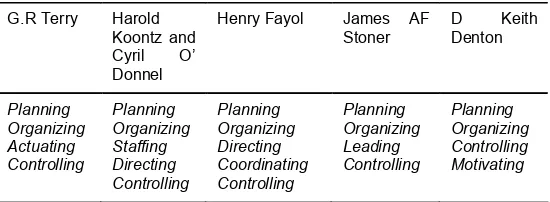
Pelaksanaan manajemen hiperkes dan K3 RS, berupaya meminimalisasi kerugian yang timbul akibat PAK dan KAK, perlindungan tenaga kerja serta pemenuhan peraturan perundangan K3 yang berlaku (law-compliance). Perekonomian global telah menstandarkan ISO baik seri 9000 maupun seri 14.000, kriteria yang ditetapkan antara lain kualitas produk atau jasa/pelayanan yang tinggi, keamanan pada tenaga kerja dan konsumen atau pasien serta ramah akan lingkungan. Fungsi manajemen, yang dikemukakan oleh beberapa ahli, mengacu kepada tiga fungsi pokok manajemen yaitu perencanaan, pengorganisasian dan pengawasan atau pengendalian 8,9,10,11 seperti yang terlihat pada pada Tabel 1.
Fungsi manajemen lainnya disesuaikan dengan falsafah RS yang bersangkutan.
Fungsi perencanaan dalam manajemen Hyperkes dan K3 RS, merupakan bagian integral dari perencanaan manajemen perusahaan secara menyeluruh, yang dilandasi oleh komitmen tertulis atau kesepakatan manajemen puncak. Pengorganisasian K3 RS mengacu ke UU No 1/1970 tentang Pembentukan Panitia Pembina K3 RS (P2K3 RS) yang keanggotaannya terdiri dari 2 unsur (bipartite) yaitu unsur pimpinan dan unsur tenaga kerja. Fungsi pengawasan atau pengendalian didalam manajemen hiperkes dan K3RS merupakan fungsi untuk mengetahui sejauhmana pekerja dan pengawas atau penyelia mematuhi kebijakan K3RS yang telah ditetapkan oleh pimpinan serta dijadikan dasar penilaian untuk sertifikasi.
KESIMPULAN DAN SARAN
Tujuan Manajemen hiperkes dan K3RS adalah melindungi petugas RS dari risiko PAK/PAHK/KAK serta dapat meningkatkan produktivitas dan citra RS, baik dimata konsumen maupun pemerintah. Keberhasilan pelaksaanaan K3RS sangat tergantung dari komitmen tertulis dan kebijakan pihak direksi. Oleh karena itu, pihak direksi harus paham tentang kegiatan, permasalahan dan terlibat langsung dalam kegiatan K3RS. Pelaksanaan K3 di rumah sakit ditujukan pada 3 hal utama yaitu
SDM, lingkungan kerja dan pengorganisasian K3 dengan menggalakkan kinerja P2K3 (Panitia Pembina atau Komite K3) di RS.
UCAPAN TERIMA KASIH
Saya ucapkan terima kasih kepada Dr. H.M.A Husnil Farouk, MPH selaku ketua PSKM FK Unsri dan Dr. H. Danardono Soekimin, MPA, ASC, selaku ketua Ikatan Dokter Kesehatan Kerja (IDKI) Provinsi Sumatera Selatan atas bimbingannya.
KEPUSTAKAAN
1. Darmanto Djojodibroto R., Kiat Mengelola Rumah Sakit, Hipokrates, Cetakan I, 1997. 2. Kepala Pusat Kesehatan Kerja, Kesehatan
Kerja Disarana Kesehatan, Pentaloka Fasilitator K3 Di Pusdiklat Jakarta, 14 Juli 2003.
3. Komite K3. Seminar K3 di RS, Jakarta 22 Januari 1994.
4. Depkes RI DIRJEN PPM dan PLP, Pedoman Sanitasi Rumah Sakit Di Indonesia, Depkes RI, 1990.
5. Keputusan Dirjen P2M dan PLP No. HK.00.06.6.44. Tanggal 18 Februari 1993, Tentang Persyaratan dan Petunjuk Teknis Tata Cara Penyehatan Lingkungan Rumah Sakit. 6. Permen Kes RI No. 986/menkes/per/XI/1992
Tanggal 14 November 1992, Tentang Persyaratan Kesehatan Lingkungan Rumah Sakit. 1992.
7. Jeyaratnam, J., Koh, D. Prevention Of Occu-pational Diseases, In Jeyaratnam J, Koh D (eds), Textbook Of Occupational Medicine In Practice Singapore; World Scientific; 1996. 8. Sugeng Budiono, A.M., Higiene Perusahaan,
dalam Bunga Rampai Hiperkes dan K3, 2nd, Jakarta 2003.
9. Yusuf, RMS,, Manajemen Hiperkes Dan Kesehatan Kerja di Perusahaan, dalam Bunga Rampai Hiperkes dan K3, 2 nd, Jakarta. 2003. 10. Benny. L. Priatna. Integrasi SMK3, dalam Bunga
Rampai Hiperkes dan K3, 2 nd, Jakarta 2003. 11. Bennet Silalahi, et.al. Manajemen K3, Seri
Manajemen No. 12 PT Pustaka Binamam Pressindo, Jakarta 1985.
6.2 ' < 7
8 $=
< 4 ! 4
INTRODUCTION
Child health is now being increasingly recognised as a pre-requisite for future economic growth. Better health among infants and children leads to higher survival rates and better health among adults that boosts gross domestic product (GDP) per capita by increasing the ratio of (economically active) workers to dependents.1,2
Considering child health in a broader production function context casts different light on the role of health insurance. Health insurance lowers the costs of medical care, increases utilisation of medical care, and assuming connection between medical care and health, it improves health status of the
PENDAPATAN, PENDIDIKAN, TEMPAT TINGGAL, DAN KEMAUAN
MEMBAYAR ASURANSI KESEHATAN ANAK: PENGGUNAAN TEKNIK
“BIDDING GAME”
INCOME, EDUCATION, RESIDENCE, AND WILLINGNESS TO PAY FOR CHILD HEALTH INSURANCE: THE USE OF BIDDING GAME TECHNIQUE
Bhisma Murti Department of Public Health,
Faculty of Medicine, Sebelas Maret University, Surakarta, Central Java
ABSTRACT
Backgrounds: Over recent years health policymakers and academicians in Indonesia have shown zealous interest in expanding the explicit role of health insurance in the health financing system. However, many health financing policies produced are lacking in prudent consideration of economic theory and empirical evidence. This paper presents the results of a willingness to pay study for child health insurance that used a robust contingent valuation method, namely the bidding game technique.
Subject and methods: A total of 409 children aged 3 to 7 years from 10 and 9 kindergartens in Surakarta and Boyolali (Central Java, Indonesia), respectively, were selected for study by proportional random sampling. Each father of these children was interviewed by use of a set of structured questionnaire. Willingness to pay was estimated by Ordinary Least Square (OLS) regression.
Results: Thirty six percent of fathers did not want to buy a child health insurance scheme. Income, education, and residence do not determine this decision. Mean WTP for child’s premium is Rp28.743,00 per month, with standard deviation of Rp29.271,00, and median WTP of Rp20.000,00. Family income, education, and residence are important determinants for WTP for child’s health insurance, and they are all statistically significant at 1% level. Family income has an elasticity of 0.53 (95%CI 0.40 to 0.65), meaning that a 10% increase in family income leads to 5% rise in WTP for child health insurance.
Conclusion: The paper has informed policymakers of the demand for health insurance and feasible prices. It is particularly useful for estimating the level of subsidies required to fill the gap between the maximum possible premium to be charged to social health insurance participants and the costs of providing health care services. An understanding of the determinants of WTP is useful for selecting the appropriate strategies for expanding the coverage of health insurance.
Keywords: health insurance, willingness to pay, bidding game technique
insured. In Indonesia, health insurance was first introduced in 1947. However, the progress has been so slow that after a half century only 14 percent of the population, about 28.7 million people, is covered by health insurance.3 About 7 percent
of those insured are government employees, their dependents, and retirees, covered under the Askes compulsory health insurance scheme. The remaining 7 percent of the insured are non-government employees covered under the Jamsostek mandatory social security scheme, and purchasers of private health insurance.4,5
passed the National Social Health Insurance Act (SJSN). Under this act, citizens are obliged to have some social security for the entitlement of primary care and hospital services. For individuals working in the state and the industrial sector, the premium is to be shared by workers and the employer, while the premium for the poor is to be paid by the government. Although there is a keen drive to develop universal coverage of health insurance in Indonesia, there is a dearth of research that provides evidence for policy-making. Particularly, there is a lack of studies that estimates an individual’s and family’s willingness to pay (WTP) for health insurance using a robust method. WTP studies are useful to determine the demand and price of a health insurance scheme, while information on feasible price is important to determine the revenue to be generated from a given package of insurance benefits.6
Given the immediate policy relevance of WTP studies, the current research seeks to estimate fathers’ WTP for children’s health insurance, using data drawn from families living in rural and urban areas in Indonesia. The WTP values are elicited by use of the bidding game technique, one of an array of contingent valuation (CV) methods that is being increasingly used in developing countries. The second objective is to estimate factors determining WTP, including family income, parental education, gender, age, and illness history. The possibility of starting point bias is also considered. The utility of the study is to inform policy decisions of the demand for health insurance and feasible prices. In particular, it is useful for health planners in estimating the level of subsidies required to fill the gap between the maximum possible premium to be charged to social health insurance participants and the costs of providing health care services.
The remainder of the chapter is organised as follows. Section 2 outlines the theoretical framework. Section 3 briefly reviews previous work. Section 4 states the hypotheses. Section 5 describes the material and methods. Section 6 presents the results. Section 7 conveys discussion and policy implications. Section 8 concludes.
THEORETICAL FRAMEWORK Willingness To Pay
The neo-classical theory of demand assumes that individuals are able of making rational choices between alternative goods to maximise their utility and that this choice leads an individual to the point at which marginal value for a good equals the price paid. According to welfare economic theory, the value (i.e. benefit) to an individual of a good or service is defined as the individual’s maximum
willingness to pay (WTP).7,8,9 Willingness to pay
(WTP) is the maximum amount of income an individual is willing to give up to ensure that a proposed good or service is available.10 Willingness
to pay (WTP) for a commodity is an indicator of the utility or satisfaction to her of that commodity.11
According to Olsen and Smith12, WTP is
“theoretically correct” in that it has theoretical basis in welfare economics and is correct in its application to health and health care.
Willingness to pay values can generate a demand curve that is useful to estimate the social value of priced and non-priced (e.g. health) goods and services. The utility of WTP studies is twofold. They can assist policy makers to make decisions about how to best use of limited resources, both in private and public provisions of health care, derived from cost-benefit analysis framework.7,9,13
Willingness to pay (WTP) studies can also assist policy-makers in setting price, since maximum WTP represents just the “price” (i.e. money extracted from the consumer) that one is prepared to sacrifice something else to get the good or service.9,13
However, WTP is different from price in that maximum WTP reflects the gross value enjoyed by a consumer of the product, thereby represents opportunities forgone to consume, whereas price of the product is an element that must be netted out from the gross value.14 In a private market, for
most individuals who purchase the product, their maximum WTP is more than the price and their WTP is at least equal the price.7
The Demand for Health Insurance
The model of the demand for health insurance developed here draws on Grossman15,16,
Jacobson17 and Bolin et al.,18. A family is assumed
to have a single utility function. Let the family consists of father, h, mother, w, and child, c. The family’s objective is to maximise utility derived from the service flow of family member’s health capital, consumption of other commodities, and the service flow of social capital; subject to the production of health capital, “home goods”, subject to the joint wealth and time constraint (Equation 1):
(1)
(2)
Market health inputs (i.e. medical care) may be purchased directly at the point of service or indirectly through health insurance. It is conceivable that just as the demand for medical care is a derived demand for health15,16, so is the demand for health
insurance. At the point of service the insured patients pay low or even zero amount of money for the cost of medical care, thereby permitting the insured patients to use necessary medical care. In that way, ceteris paribus, the introduction of health insurance is assumed to produce improvement in population health. While health insurance is an exogenous factor in the production function of health capital, in Equation 3 it is treated as an endogenous factor for which the effects of predictors are to be determined. The demand for health insurance is determined by family member’s initial stock of health (Hi); a vector of the family member’s characteristics (Xi), including initial health status, age and gender; a vector family characteristics, including parental income (Y), parental education (E); and vector of environmental factor, such as urban-rural residence (G); and the initial bids offered to parent as the respondent in the WTP study; subject to budget constraint (Equation 3):
i=m,f,c (3)
In the original Grossman’s15,16 model of the
demand for health, net investment in the stock of health is determined by current health state. The poorer current health state, the larger gross investment is needed to maintain the same level of net investment. Illness history for the past 3 months was intended to portray current health state. It is reasonable to assume that the more frequent a child experiences illness episodes in the past months, the greater gross investment is needed to preserve the same health stock, the greater amount of money parent is willing to pay for child health insurance.
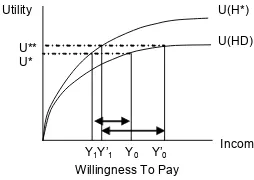
Figure 1 illustrates the concept of WTP for a good or service, relating income and utility. The good in question is a health insurance scheme. Notice that the utility function of income is typically concave, and the individual is called a risk averter, a necessary condition for a health insurance scheme to be viable.19,20
Assume that the scheme proposed to the respondents covers outpatient care, inpatient care, and surgery. These benefits permit the insured to use necessary care in the event of an illness or an injury so that her health status moves from a specific illness state (HD) to full health (H*). When an individual buys a health insurance scheme, she must give up some of her income, thereby her utility will decline. The difference between Y0 and Y1 reflects the individual’s maximum WTP for the health insurance scheme, since an increase in utility due to improved health state just offsets the reduction in utility due to buying insurance premium. It follows that a rise in income would lead to larger difference between Y’0 and Y’1, implying larger WTP. According to Grossman15,21 education is a
factor that improves the efficiency with which one can produce investments to health. It is reasonable to hypothesise that the higher educated better recognise the advantages of having health insurance in lowering the cost of medical care when ill. Therefore, the higher educated families demand more child health insurance.
Previous Research
Willingness to Pay (WTP) studies are being increasingly used as a method for the valuation of benefits, modelling of demand, and the design and implementation of user fees for a variety of goods and services in the health sector.22,23 However, only
a few studies have applied WTP to estimate the benefit of a health insurance scheme.24,25,26,27,28
Asenso-Okyere, et al.24 employed bidding
contain are likely to accept higher health insurance premiums. Age had the positive sign but was not statistically significant, even at 10 percent level. Mathiyazhagan25 estimated WTP for rural health
insurance in India and found that WTP was positively and significantly associated with family size, health status, source of health care service utilised, income, income flow, distance, and familiarity of health system. Age was inversely related to WTP, although it was not statistically significant.
Banks, et al.26 estimated consumers’ WTP for
MOH-sponsored voluntary health insurance in Jordan. Ninety-eight percent of all focus group participants indicated that they would be willing to purchase health insurance from the public or private sectors, if presented with the option. Seventy-six percent of all focus group participants stated that government-sponsored health insurance should be voluntary, not compulsory. Dong, et al.28 estimated
WTP for community-based insurance in Burkina Faso. They found that education and economic status positively influence WTP, implying higher years of schooling and economic status and higher WTP. Age and distance to health facility negatively influence WTP, thus higher age and longer distance and less WTP.
Hypothesis
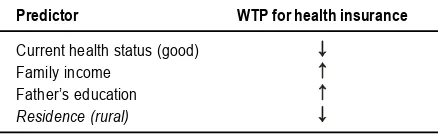
Based on available theories and previous research, the hypotheses on WTP for child health insurance are summarised as follows (Table 1).
Table 1. Hypothesis On WTP For Child Health Insurance
Predictor WTP for health insurance
Current health status (good) Family income
Father’s education Residence (rural)
MATERIAL AND METHODS
The present study follows the National Oceanic and Atmospheric Administration (NOAA)’s29 strong
recommendation that WTP studies be carried out as face-to-face interview. The WTP study was conducted in two diverse districts in Central Java, Indonesia. Surakarta municipality (population is 553,580) represented urban area. Boyolali district (population is 931,380) represented rural area. Ten kindergartens in Surakarta and 9 kindergartens in Boyolali were selected to represent high, middle, and low socio-economic status of populations. A total of 409 children aged 3 to 7 years were selected by proportional random sampling from the selected schools. Fathers of these children were interviewed
by nine trained interviewers, using a set of structured questionnaire. Consent for the survey was obtained from schoolmaster of each school. Parents were allowed to decline.
WTP Instrument
There are two approaches for estimating WTP: (1) direct method, and (2) indirect method.30 Direct
or contingent valuation (CV) method surveys a sample of respondents and directly asks them what they would be willing to pay for the good in question. The technique is prospective and determines WTP contingent upon a hypothetical market presented to the respondent. The estimates are not based on observed or actual behaviour, but instead, on inferring what an individual’s behaviour would be from the answers he or she provides in the survey framework.
The CV method is classified into two groups: open-ended or closed-ended.30 For the sake of
unbiased estimates of WTP, the NOAA29 (1993) has
always recommended the use of the closed-ended method, in which respondents are asked whether they would pay a specified amount to obtain the good in question, with possible response being “yes” or “no”. A type of CV methods being increasingly used in developing countries is the bidding game technique. In this technique, information about consumer preferences is obtained by suggesting different prices and bidding the respondent up or down depending on the answers given.23,31 A relative merit to the other
techniques is that it mimics the decision making process that individuals usually practice in everyday market transaction in many developing countries, where the seller typically initiates the bargaining by quoting a high price, and then buyer haggles until both sides arrive at agreed price.23 The
purported drawback of this technique, however, is its vulnerability to starting point bias.32,33,34 Starting
point bias refers to a bias where respondents are influenced by the amount used to start the bidding, so that higher starting bids tend to produce higher accepted bids, ceteris paribus.
from being a member of the scheme, and the economic consequence of their participation. In line with the NOAA29, respondents were reminded that
if they decided to become members, they had to pay premium on a regular monthly basis at the expense of a reduction in their disposable income available for consumption of other public and private goods. The following scenario was presented:
“Allow me to ask you some hypothetical questions about health insurance. First I would like to explain the relation between illness and health insurance. Every one has the probability of being sick. Now suppose within the next one year your child would experience an illness. As a result, your child would be absent from school, and you need to take your child to a doctor or specialist. The child may even need hospital care or surgery, and the consequential medical expenditure could be high. If you purchase a health insurance scheme, all of your child’s medical costs will be covered by the scheme, including costs of doctor visit, specialist consultation, medicine, inpatient services at private hospital, and surgery. For these benefits to be made effective, you need to pay some amount of money so-called as premium, on a monthly basis. This money will not be refundable if your child is not sick, because it is not a saving scheme. Bear in mind if you purchase this insurance scheme, you have to give up some other use of this money. For example, you may reduce family’s expenditures for recreation or education”
In line with the NOAA29 recommendation, WTP
was elicited using the binary-choice bidding game technique. In anticipation to the existence of starting point bias, three initial bids were allocated at random to each respondent (i.e. each father): Rp20,000,00, Rp30,000,00, and Rp40,000,00. This strategy for eliminating starting point bias has been used by others.13,35 In order to make the good in
question as realistic as possible, the bid values follow the premiums set in three different health insurance packages (so-called as the blue, silver, and gold packages) which PT Askes has marketed over the past several years. Respondents were asked whether they were willing to pay the pre-specified initial bid. If the answer were yes, the respondents were asked whether they would be willing to pay a pre-specified higher amount. If the answer were no, the respondents were asked whether they would be willing to pay a pre-specified lower amount. It was decided to have a maximum of three-point bids in order to avoid complexity of the exercise posed to the respondents. The bidding ended at the third bid with an open-ended question eliciting the exact amount of money respondents would willing to pay for the proposed insurance
scheme. The open-ended follow up question produces continuous scale WTP values, and thus allows an estimation using OLS regression. The bidding questions were posed as follows:
“Now I would like to ask you the following questions. Given the above consideration regarding the benefits and consequences of the proposed health insurance scheme, would you decide to buy it or not? (0) No; (1) Yes. Given you decide to buy the proposed child health insurance scheme:
- Are you willing to pay Rp30.000,00 per month for the premium of child health insurance scheme? [If yes, go to B, and if no go to C].
- Are you willing to pay Rp40.000,00 per month for the premium of child health insurance scheme? [No matter the answer, go to D].
- Are you willing to pay Rp20.000,00 per month for the premium of child health insurance scheme? [No matter the answer, go to D].
- What is the maximum amount that you are willing to pay for the premium of child health insurance scheme? [Amount in Rupiah …………]”.
Econometric analysis
The analytical framework employs the two-part model (Figure 2). The two-part model has been used in former health insurance research.13,25,36
The first part of the model seeks to examine factors determining the willingness to buy health insurance. The decision to buy or not buy is a dichotomous variable taking the value of 0 if not buy, and 1 if buy. Differences in percentage of willingness to buy across income quintiles, education, illness history, child’s gender, rural-urban residence, respectively, were tested for statistical significance in bivariate analysis by use of chi-square test. Logistic regression followed bivariate analysis. The second part estimates WTP for child’s health insurance premiums, given father was willing to buy. Differences in mean WTP across income
quintiles, education, etc. in bivariate analysis were tested by F test or t test. WTP for child’s health insurance is assumed to be a function of family income, father’s education, child’s age, child’s gender, illness history, rural-urban residence, and initial bid. Since the dependent variable was measured in continuous scale (i.e. Rupiah), WTP was estimated by OLS regression analysis (Equation 4):
(4)
where WTP, willingness to pay; á, intercept; â, coefficients of explanatory variables; X, explanatory variables. The transformation of WTP and income variables to logs achieves three things. Firstly, as previous studies have examined, a non-linear relationship between WTP and income is adequately captured by a log transformation. Secondly, the log transformation corrects for the right-skewed distribution of residuals commonly exists when the dependent variable is skewed to the right. The resulting normal distribution of residuals allows the use of OLS regression. Thirdly, this convenient transformation allows universal comparisons with the results of other studies as the regression results provide elasticities. An elasticity reports the percentage change in one dependent variable for a 1 percent change in the independent variable, and is a useful way to compare empirical results as it is a scale neutral.28,36,37,38
Dependent Variable
Willingness To Buy. Willing to buy variable is defined as respondent’s willingness to buy a hypothetical health insurance scheme proposed to the respondent after a scenario has been presented to describe the benefits and the consequences of purchasing a health insurance scheme. It has discrete values of 0 if willing, or 1 if not willing to buy.
Willingness To Pay. Willingness to pay is the maximum amount of income the respondent is willing to give up to ensure that the proposed health insurance scheme is available, given the respondent is willing to buy health insurance. It has continuous values (Rupiah).
Independent Variable
Income Family income is defined average monthly income that is earned or unearned over the past six months. The original values of income were transformed into natural logarithm. This transformation aims to correct the distribution of residuals which is typically skewed to the right when
the dependent is skewed to the right, and to obtain income elasticity estimate.
Education Father’s education was grouped into three levels: (0) no schooling/primary school, (1) secondary school, and (2) university. This variable was then dummy-coded.
Age Child’s age was measured in year to allow some continuous explanatory variables in the OLS regression model.
Sex Child’s sex is a binary variable taking the value of 0 if male and 1 if female child. Residence is a dichotomous variable: (0) urban, (1) rural.
Initial Bid Each respondent was assigned at random to one of the three initial bids: (0) Rp20.000,00; (1) Rp30.000,00; and (2) Rp40.000,00.
Statistical Analysis
Summary statistics are presented in mean, median, standard deviation, frequency, and percent. The OLS regression coefficients are presented in marginal effects with their 95% Confidence Interval. All analyses were performed using Stata Inter-Cooled Version 7.39
RESULTS
Characteristic of the Study Population
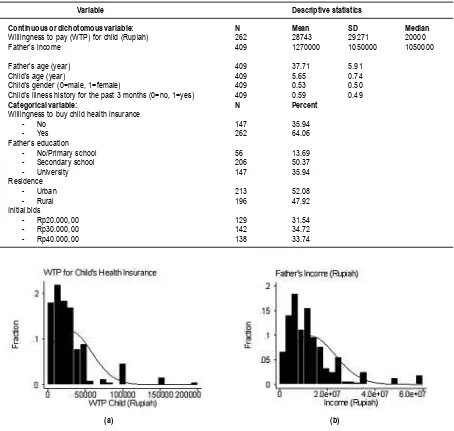
Table 2 shows the profile of the study population representing families in Surakarta and Boyolali (Central Java, Indonesia) who had children attending kindergartens. Average age of fathers was 37 years, ranging from 26 to 58 years. Average age of children was 5.7 years, ranging from 3.1 to 7 years. About half of the fathers had completed secondary schooling, and one-third of them had attended the university. Average income was Rp1.270.000,00, and median income was Rp1.050.000,00. The first WTP question asked respondents whether they would be willing to buy a health insurance scheme. As much as 64 percent of fathers were willing to buy the schemes for children. Mean WTP for child’s premium was Rp28.743,00 per month, with standard deviation of Rp29.271,00, and median WTP of Rp20.000,00. The large difference between the mean and median indicates heavily skewed distribution of WTP. Mean WTP accounts for 2.4 percent of monthly income. The initial bids were distributed at random to each respondent, i.e. each respondent had a 33 percent chance to receive one of the three initial bids. This means that the estimated WTP unbiased by the initial bids even if they influenced the amount of WTP.
Variable Descriptive statistics
Continuous or dichotomous variable: N Mean SD Median Willingness to pay (WTP) for child (Rupiah) 262 28743 29271 20000
Father’s income 409 1270000 1050000 1050000
Father’s age (year) 409 37.71 5.91
Child’s age (year) 409 5.65 0.74
Child’s gender (0=male, 1=female) 409 0.53 0.50 Child’s illness history for the past 3 months (0=no, 1=yes) 409 0.59 0.49
Categorical variable: N Percent
Willingness to buy child health insurance
- No 147 35.94
- Yes 262 64.06
Father’s education
- No/Primary school 56 13.69
- Secondary school 206 50.37
- University 147 35.94
Residence
- Urban 213 52.08
- Rural 196 47.92
Initial bids
- Rp20.000,00 129 31.54
- Rp30.000,00 142 34.72
- Rp40.000,00 138 33.74
Table 2. Descriptive Statistics of The Study Population
Bivariate Analysis
As Figure 4a shows, there is no clear gradient in the percentage of willing to buy child health insurance by education level (chi2(2)=3.67; p=0.161). Similarly, there is no obvious gradient in the percentage of willing to buy child health insurance by income quintile (chi2(4)=6.64; p=0.158) (Figure 4b). These crude analyses give preliminary evidence that education and income are not important predictors for the decision to buy child health insurance.
By contrast, the amount of WTP for child health insurance increases with education (F=17.58; p=0.000) (Figure 5a). Similarly, WTP for child health
insurance increases with income quintiles (F=17.09; p=0.000) (Figure 5b). The highly significant findings in the bivariate analysis project significant findings in the multivariate analysis.
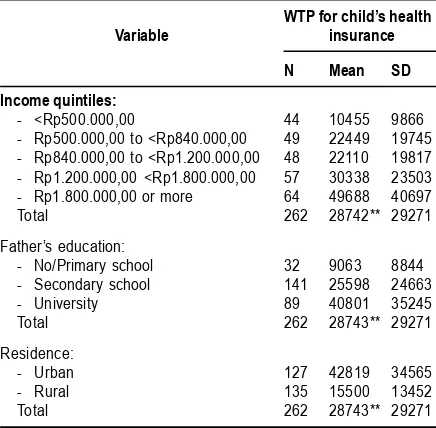
Table details WTP for child health insurance by income quintile, education level, and residence. WTP increases with income and education. Families living in rural area are less willing to pay for health insurance than peers in urban area. This information can be used to estimate the premiums that can be charged to the participants of a health insurance scheme according to income, education, and residence groups.
Figure 3. Histograms of (A) Father’s Wtp For Child’s Health Insurance (Mean=Rp28.743,00; Median=Rp20.000,00; SD=29,271; N=262); and (B) Father’s Income (Mean=Rp1.270.000,00; Median=Rp1.050.000,00; Sd=1.050.000; N=409)
Table 3 Descriptive Statistics of Wtp for Child Health Insurance, Stratified by Income Quintile, Father’s
Education, and Rural-Urban Residence
WTP for child’s health
Variable insurance
N Mean SD
Income quintiles:
- <Rp500.000,00 44 10455 9866 - Rp500.000,00 to <Rp840.000,00 49 22449 19745 - Rp840.000,00 to <Rp1.200.000,00 48 22110 19817 - Rp1.200.000,00 <Rp1.800.000,00 57 30338 23503 - Rp1.800.000,00 or more 64 49688 40697
Total 262 28742** 29271
Father’s education:
- No/Primary school 32 9063 8844 - Secondary school 141 25598 24663
- University 89 40801 35245
Total 262 28743** 29271
Residence:
- Urban 127 42819 34565
- Rural 135 15500 13452
Total 262 28743** 29271
** significant at 1 percent level, by F test
Multivariate Analysis
Multivariate analysis confirms whether the associations between variables shown in bivariate analysis remain after adjustment for potential confounding factors. The logistic regression model (results are not presented) found that none of the independent variables, including income, education, illness history, child’s age, child’s gender, and residence was statistically significant predictor for the decision to buy health insurance. The very low McFadden R2 (results are not shown) indicates that the decision to buy or not buy health insurance scheme is not influenced by variables included in the model but, perhaps some exogenous random factors, such as taste and belief. Provided respondent was willing to buy, the next step was to regress WTP for child’s health insurance on
income, education, child’s age, child’s sex, illness history, urban-rural residence, and initial bid.
Regression Diagnostics
Kernel density estimate shows approximately normal distribution of the residuals (Figure 6a). Indicator of skewness and the joint skewness-kurtosis test confirm normality (Table 4) The pattern of the residual variance gets thinner toward the left end (Figure 6b), but the Cook-Weisberg test cannot reject homoskedasticity (Table 4).
Ramsey’s test for specification error cannot reject the null hypothesis of no omitted variables (Table 4). The link test shows a significant predictor _hat and insignificant predictor _hatsq at 5 percent level. Thus, the model is correctly specified. A VIF of 1.73 indicates no multi-collinearity. Finally, the adjusted R-square indicates that more than half of the variation in WTP is explained by the predictors included in the model.
Regression Results
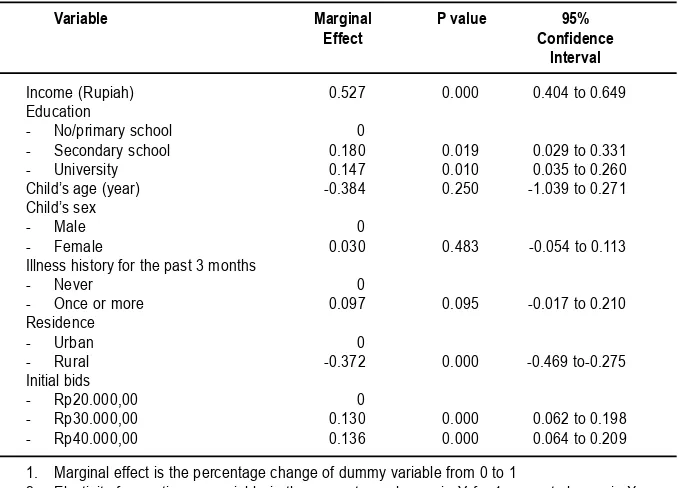
Table 5 shows an income elasticity of 0.53, meaning that a 10 percent increase in income would lead to 5 percent rise in WTP for child’s health insurance, and it is statistically significant. Thus, income is an important determinant for WTP. A move from no schooling/primary school to secondary gives rise in WTP to as much as 18 percent, and it is statistically significant. Thus, education is a significant predictor for WTP, although of less importance than income. Age has an elasticity of-0.38 for WTP, but it is not statistically significant. Similarly, there is no indication of gender bias in WTP. Illness history for the past 3 months only increases 10 percent of WTP, but is significant at 10 percent level. Rural residence has 37 percent lower WTP than urban residence, and it is statistically significant. Initial bids significantly determine WTP.
Figure 4. Ols Regression Diagnostics, WTP for Child: (A) Non-Normality; (B) Heteroskedasticity
(a) (b)
Table 4. Regression Diagnostics for Ols Regression on WTP for Child
Method or test Problem to address Statistic or graph P-value
Kernel density estimate Non-normality Graph -Skewness Non-normality -0.211 -Skewness-kurtosis test Non-normality - 0.230 Cook-Weisberg Heteroskedasticity chi2(1)=0.08 0.781 Rvf plot Heteroskedasticity Graph
Ramsey RESET Specification error F(3,249)=1.22 0.303 Link test Specification error _hat 0.014 _hatsq 0.191 VIF Multicollinearity Mean VIF=1.73 -Adjusted R-square Goodness-of-fit 56.79 percent 0.000
Discussion and Policy Implications
Setting prices is a key decision for any program that provides goods or services. Social programs such as health insurance need to balance program coverage, which allows services available to low-income families, and program revenue, which permits sustainability. Raising prices too high will deny health insurance schemes to poor families. On the other hand, maintaining needless low prices will either perpetuate reliance on external donors or place sustainability at risk. Until recently, health insurance managers in Indonesia have been forced to make pricing decisions without a reliable methodology for predicting the effect of price changes on program use and revenue. The present study has applied a simple survey technique to
estimate consumer’s WTP for health insurance schemes, allowing managers to make rational pricing decisions.
Willingness to Buy Health Insurance
About 36 percent of the respondents were not willing to buy the proposed health insurance scheme. The results of bivariate analysis and logistic regression have shown that variables such as income, education, illness history, age, gender, and residence are not good predictors for respondent’s willingness to buy health insurance. There must be important determinants unobservable in the current research, among which a religious belief that holds insurance is a kind of gambling is probably one. In addition, according to Table 5. Ols Regression Results on WTP
for Child’s Health Insurance
Variable Marginal P value 95%
Effect Confidence Interval
Income (Rupiah) 0.527 0.000 0.404 to 0.649 Education
- No/primary school 0
- Secondary school 0.180 0.019 0.029 to 0.331 - University 0.147 0.010 0.035 to 0.260 Child’s age (year) -0.384 0.250 -1.039 to 0.271 Child’s sex
- Male 0
- Female 0.030 0.483 -0.054 to 0.113 Illness history for the past 3 months
- Never 0
- Once or more 0.097 0.095 -0.017 to 0.210 Residence
- Urban 0
- Rural -0.372 0.000 -0.469 to-0.275 Initial bids
- Rp20.000,00 0
- Rp30.000,00 0.130 0.000 0.062 to 0.198 - Rp40.000,00 0.136 0.000 0.064 to 0.209
1. Marginal effect is the percentage change of dummy variable from 0 to 1
Gertler and Gruber40, in order to seek financial
security against unpredictability of poor health, most Indonesian families insure themselves informally via savings, credit markets, or borrowing from family or friends. These methods, however, are inadequate protection from financial loss due to severe illness. The socio-economic determinants for willingness to buy health insurance deserve further research.
About two out of three families are willing to purchase the scheme after they are informed about the scheme. This rate is relatively low, reflecting the obstacle of introducing health insurance in Indonesia. As a comparison, a study in Tanzania reported 79 percent respondents in favour of joining a local insurance system and paying a certain amount of money per year, after which all services from the hospital would be free for that year.41 As
much as 98.7 percent of the respondents agreed to participate in the scheme in Ghana and up to 63.6 percent of the respondents were willing to pay a premium of $3.03 a month for a household of five persons.24 Eighty-six percent of the respondents
in Ethiopia were willing to participate in indigenous social insurance scheme related to bereavement and funeral activities (locally termed as eders).42
The highest proportion occurred in Jordan, where 98 percent of the respondents indicated their willingness to purchase health insurance from the public or private sectors.36
WTP Estimates
Given father’s willing to buy, the average WTP is Rp28.743,00 per month for child’s health insurance premium. This amount of WTP accounts for 2.4 percent of monthly income. Median WTP was Rp20.000,00 per capita per month. As noted earlier, the scheme presented to the respondents cover comprehensive health insurance benefits, including outpatient care, consultation to specialist, inpatient care, and surgery. Price of the product is an element that makes up the gross value people enjoy of the product, i.e. his maximum WTP. These results translate into fathers purchasing health insurance scheme only when its price (i.e. premium) is equal or lower than their WTP. Obviously, if the WTP is higher than the premium, the health insurance scheme can be operated smoothly. But if the WTP is lower than the premium, the scheme cannot be operated smoothly and subsidies are required, otherwise sustainability would be at risk.
Income and Health Insurance
The results of multivariate analysis have shown that child health insurance is a normal and necessary good with income elasticity of 0.53 (95%
CI 0.40 to 0.65). That is to say, with 95 percent level of confidence, a 10 percent increase in father’s income would lead to 4 to 7 percent rises in WTP. WTP increases gradually with income quintiles. Families in lower income quintile are less willing to pay amount of money for health insurance than those in higher income quintile at proportionate degree. Marked positive effect of income on WTP for health insurance has also been reported in others such as those in Ghana24, India25, and
recently in Denmark.27
The results presented here have shown that families who fall in the lowest income quintile are willing to pay as low as Rp10.489,00 per month per head for health insurance. Considering the low WTP on the one hand and the very likely high costs of providing medical care services, these findings imply that the government should bear some of the costs of medical services provided to the poor. The central and local governments need to subsidise part of the premiums for the poor citizens. Otherwise the sustainability of the universal and comprehensive health insurance scheme will be at risk.
Economists have long argued that introducing subsidies to health care services may lead to ex-post moral hazard, reducing an individual’s marginal costs of medical care inputs and leading to use of additional medical services that patient values less than the marginal cost of producing them.43
However, as Jowett, et al.44 have argued, evidence
of moral hazard or hidden action is not always bad, especially among individuals at lower income levels in low-income countries, which typically have relatively high health needs, but very low levels of service usage. For example, in Vietnam poorer insured individuals tend to use inpatient facilities and public providers to a far greater extent than poorer uninsured individuals do.44 For the case of
Indonesia, selective benefits of health insurance are worth-considering. The scheme may better include inpatient care but exclude routine outpatient care. The reason for so doing is to protect the insured from catastrophic financial risk while restricting unnecessary provision of outpatient care. According to Pradhan and Prescott45, in Indonesia
exposure to catastrophic shocks can substantially be reduced if a larger proportion of government subsidies are directed to inpatient care.
Education and Health Insurance
education is a factor that improves the efficiency with which one can produce investments to health. The more educated have greater exposure to health information, and therefore recognise more the advantages of making regular small insurance payments to avoid large and sudden medically-related financial catastrophes. In turn, the more educated health insurance will be willing to pay more for health insurance. Many other studies have also confirmed the positive effect of education on WTP for health insurance, such as those conducted in Ghana,24 Denmark27, recently in Burkina Faso28,
and Taiwan.36
Illness History and Health Insurance
The hypothesis that WTP increases with illness history is supported. Respondents who reported child illness episodes during the past 3 months stated higher WTP for health insurance. In Grossman15,16, health depreciates due to illness. In
order to preserve a positive net investment in child health, a parent needs to make larger gross investment in child health. He or she may demand more health care and health insurance for the child. The more frequent a parent registers a child illness, the larger amount of money he or she is willing to pay for child health insurance. This finding is consistent with others. A study in rural India25 found
that people who were sick had a 172 percent higher WTP for the proposed health insurance scheme as compared to people registering no illness at that time.
Residence and Health Insurance
Residence is a strong predictor for WTP. Rural families are willing to pay significantly less than are urban families (marginal effect-0.379, 95%CI-0.471 to-0.287). A WTP study for private health insurance in Denmark found similar result in that individuals living in Copenhagen were willing to pay more than those living in other parts of Denmark.27 In Taiwan,
households located in either cities or towns are more likely to purchase private health insurance than village households.36 There is no wonder with
the results, since compared to cities and towns, by and large rural areas have less access for information about the importance of insurance to protect against financial loss. But the gap in WTP between rural and urban areas may also be explained by distant healthy facility commonly associated with rural areas. As Dong, et al.28 has
found it, the estimated WTP for community-based insurance in Burkina Faso was inversely related to distance to health facility.
The policy implication of this finding is that the government should work out a health insurance
scheme in rural communities, especially ways of determining the direct costs of health insurance scheme that communities will bear and selecting the appropriate local financing mechanisms. Local governments in rural areas need to contribute more of their local budget to subsidise the premiums for their communities. This suggestion is in line with the Decentralization Law enacted in Indonesia since 1999. Under this law, district and municipality governments have the authority to use their local resources for the welfare of the local communities.
Limitations of the Study
Shortcomings of the present study must be noted to place the results in context. Firstly, this study garnered information from restricted population, i.e. families who had children aged 7 years or less attending kindergarten schools. It does not include a small proportion of children who did not go to school. This limitation, however, by no means cancels out the internal validity of the results to the restricted target population. Secondly, the majority of the respondents were not familiar with the concept of health insurance prior the survey. Given 14 percent of the respondents had no schooling or primary school, comprehensive description of the health insurance scheme could have been cognitively demanding. Some respondents might have not fully understood the hypothetical good to be valued. As a result, when providing information about their maximum WTP, it is possible that some respondents did not consider all the factors that are important to them in the provision of health insurance scheme.
In the current research, efforts have been made to obtain unbiased estimates of WTP. Firstly, in order to preserve reliability, this study follows recommendation made by the NOAA29 to elicit WTP
by face-to-face interview. Face-to-face interviews allows the presentation of a considerable amount of information in a controlled sequence, while maintaining respondent interest and attention, as well as encouraging the respondent to carefully consider their responses and take the matter as of importance.12 Secondly, the value of bids were
chosen considering the concurrent premiums of health insurance scheme existing in the market, in order to present the hypothetical good as closely as possible to reality, thereby resulting in realistic estimates of WTP. Thirdly, as others have suggested11,22,36, the initial bids were allocated at
respondents. Fifthly, the adjusted R2 of 0.58
obtained from the OLS regression model is fairly high. Sixthly, compared with the average number of 304 respondents surveyed in published WTP studies and a median of 10212, this study with a
sample size of 409 respondents is large enough to yield precise estimates of WTP, and to detect the effect of any explanatory variable on WTP if it does exist. Seventh, despite the difficulties in explaining the unfamiliar concept of health insurance, the majority of respondents were both willing and able to complete the required complex task. In that sense, the bidding game seems to be a suitable method to elicit WTP in a developing country such as Indonesia, where people are used to bargain for a good or service. Lastly, the strong positive correlation between income and WTP confirms the construct validity of the estimated WTP in that WTP for a good or service must converge with ability to pay for that good or service.22,46,47
CONCLUSIONS
This study is the first to investigate WTP for health insurance scheme in Indonesia using a robust method, bidding game technique. The results can be used for modelling of demand, design and pricing of a health insurance scheme. In particular, this study provides health planners with information useful for estimating the level of subsidies required to fill the gap between the maximum possible premium to be charged to social health insurance participants and the costs of providing health care services, so as to maintain the scheme’s financial sustainability. Income, education, and rural-urban residence do not affect the decision to buy a health insurance scheme, but they are important determinants for the amount of WTP for child health insurance. An understanding of the determinants for WTP is useful for selecting the appropriate strategies for expanding the coverage of health insurance. Factors determining the decision to purchase child health insurance deserve further research.
Acknowledgements
The study was partially funded by PT Askes, Indonesia. The author would like to thank Dr. Gede Subawa and Dr. Veronica Margo S at PT Askes for securing such funding. This paper is excerpted from the author’s doctoral studies on the production of health at the University of Newcastle, Australia. The University of Newcastle has granted the University of Newcastle Research Scholarship (UNRS) and the Overseas Postgraduate Research Scholarship (OPRS) to the author. Conflict of interest: None.
REFERENCE
1. Hatasa, N. Health and economic development: a cross-national empirical analysis. Journal of National Institute of Public Health. 2001;50(3):168-80.
2. Maitra, P. Parental bargaining, health inputs and child mortality in India. Journal of Health Economics. (in press). 2003.
3. Tabrany, H., Pujianto. Asuransi kesehatan dan akses pelayanan kesehatan. Majalah Kedokteran Indonesia. 2000;50(6): 282-89. 4. Thabrany, H. Managed care in Indonesia. The
Electronic Journal of the Indonesian Medical Association. 2000;2(1):1-12.
5. Thabrany, H. Private health sector in Indonesia: Opportunities and progress. The Electronic Journal of the Indonesian Medical Association. 2001;2(5):1-13.
6. Ensor, T. Developing health insurance in transitional Asia. Social Science and Medicine.1999;48:871-79.
7. Bala MV, Mauskopf JA, Wood LL. Willingness to pay as a measure of health benefits. Pharmacoeconomics.1999;15(1):9-18. 8. Birch, S., Donaldson, C. Valuing the benefits
and costs of health care programmes: where’s the ‘extra’ in extra-welfarism? Social Science and Medicine. (in press).2000.
9. Donaldson, C. Eliciting patient’s values by use of ‘willingness to pay’: letting the theory drive the method.Health Expectation.2001;4:180-88.
10. Phillips, K.A., Homan, R., Luft, H. et al. Costs and financing of public goods: the case of poison control centers. Abstr Book Assoc Health Serv. Res. 1997;14:136-37.
11. Ryan, M., Ratcliffe, J., Tucker, J. Using willingness to pay to value alternative models of antenatal care. Social Science Medicine. 1997;44(3):371-80.
12. Olsen, J.A., Smith, R.D. Theory versus practice: A review of willingness to pay in health and health care. Health Economics. 2001;10:39-52.
13. Bhatia, M.R., Fox-Rushby, J.A. Willingness to pay for treated mosquito nets in Surat, India: the design and descriptive analysis of a household survey. Health Policy and Planning.2002;17(4):402-11.
14. Bennet, J. On values and their estimation. International Journal of Social Economics. 2000;27(7,8,9,10):980-93.
16. Grossman, M. The demand for health: a theoretical and empirical investigation. New York: Columbia University Press for the National Bureau of Economic Research. 1972b.
17. Jacobson, L. The family as producer of health – an extended Grossman model. Journal of Health Economics.2000;19: 611-37.
18. Bolin, K., Lindgren, B., Lindstrom, M., Nystedt, P. Investments in social capital – implications of social interactions for the production of health. Social Science and Medicine (in press).2003.
19. Johannesson, M. A note on the relationship between ex ante and expected willingness to pay for health care. Social Science and Medicine.1996;42(3):305-11.
20. Chiu, W.H. Health insurance and the welfare of health care consumers. Journal of Public Economics. 1997;64:125-33.
21. Grossman, M. The human capital model of the demand for health. Working paper 7078. Cambridge, MA: National Bureau of Economic Research. http://www. nber.org/papers/w7078. 1999.
22. Diener, A, O’Brien, B. Gafni, A. Health care contingent valuation studies: A review and classification of the literature. Health Economics.1998;7:313-26.
23. Onwujekwe, O. Searching for a better willingness to pay elicitation method in rural Nigeria: The binary question with follow-up method versus the bidding game technique. Health Economics.2001;10:147-58.
24. Asenso-Okyere WK, Osei-Akoto I, Anum A, Appiah EN. Willingness to pay for health insurance in a developing economy. A pilot study of the informal sector of Ghana using contingent valuation. Health Policy. 1997;42:223-37.
25. Mathiyazhagan, K. Willingness to pay for rural health insurance through community participation in India. International Journal of Health Planning and Management. 1998;13:47-67.
26. Banks DA, Muna NS, Shahrouri TA. Consumers’ willingness to pay for MOH-sponsored voluntary health insurance in Jordan: A focus group analysis. Technical Report No. 41. Partnerships for Health Reform. Abt Associates Inc, Bethesda, MD.1999. 27. Glydmark, M., Morrison, G.C. Demand for
health care in Denmark: results of a national survey using contingent valuation. Soc Sci Med.2001;53:1023-36.
28. Dong, H., Kouyate, B., Snow, R., Mugisha, F., Sauerborn, R., Gender’s effect on willingness to pay for community-based insurance in Burkina Faso. Health Policy, (in press).2002. 29. National Oceanic and Atmospheric
Administration (NOAA). Report of the NOAA panel on contingent valuation. Federal Register. 1993;58(10): 4601-14.
30. Zarkin, G.A., Cates, S.C., Bala, M.V. Estimating the willingness to pay for drug abuse treatment. A pilot study. Journal of Substance Abuse Treatment.2000;18:149-59. 31. Russell, S., Fox-Rushby,J., Arhin, D. Willingness and Ability to Pay for Health Care; Selection Methods and Issues, Health Policy and Planning. 1995;10:94-101.
32. Mitchell, R.C., Carson, R.T. Using survey to value public goods: The contingent valuation method. Resources for the future: Washington, DC. 1989.
33. Klose, T. The contingent valuation method in health care. Health Policy. 1999;47: 97-123 34. Frew, E.J., Wolstenholme, J.L., Whynes, D.K.
Comparing willingness to pay: bidding game format versus open-ended and payment scale formats. Health Policy (in press).2003. 35. Liu, J.T., Hammitt, J.K., Wang, J.D., Liu, J.L.
Mother’s willingness to pay for her own and her child’s health: A contingent valuation study in Taiwan. Health Economics. 2000;9:319-26. 36. Liu, T.C., Chen, C.S. An analysis of private health insurance purchasing decisions with national health insurance in Taiwan. Social Science and Medicine. 2002;55: 755-74. 37. Manning, W.G. The logged dependent
variable, heteroscedasticity, and the retransformation problem. Journal of Health Economics. 1999;17: 283-95.
38. Filmer, D., Pritchett, L. The impact of public spending on health: does money matter? Social Science and Medicine. 1999;49:1309-23.
39. StataCorp., Stata statistical software, release 7. College Station, TX: Stata Corporation. 2001Gupta, S., Verhoeven, M., Tiongson, E.R. Public spending on health care and the poor. Health Economics. 2003;12: 685-96.
40. Gertler and Gruber. Insuring consumption against illness. American Economic Review.2002.
41. Walraven, G. Willingness to pay for district hospital services in rural Tanzania. Health Policy and Planning. 1996;11(4):428-37. 42. Mariam, D.H. Indigenous social insurance as
43. Leibowitz, A.A. The demand for health and health concerns after 30 years. Journal of Health Economics. (in press).2004.
44. Jowett, M., Deolalikar, A., Martinsson, P. Health insurance and treatment seeking behaviour: Evidence from a low-income country. Health Economics (in press).2004.
45. Pradhan, M., Prescott, N. Social risk management options for medical care in Indonesia. Health Economics. 2002;11:431-46.
46. Cummings, R.G., Brookshire, D.S., Schulze, W.D. Valuing environmental goods: a state of the arts assessment of the contingent valuation method. New Jersey: Rowman and Alanheld.1986.
LATAR BELAKANG
Pembangunan kesehatan mempunyai visi mewujudkan “Indonesia Sehat Tahun 2010“, yaitu suatu gambaran masyarakat yang mempunyai perilaku sehat, lingkungan sehat, dapat menjangkau pelayanan yang bermutu sehingga mempunyai status kondisi kesehatan yang optimal.1 Visi pembangunan kesehatan
masyarakat dioperasionalkan dalam perencanaan melalui Rencana Pembangunan Tahunan atau Reperta (jangka pendek) dan Program Pembangunan Nasional atau Propenas Bidang
IMPLEMENTASI INDIKATOR KINERJA PROPENAS
DI PROVINSI
IMPLEMENTATION OF PROPENAS PERFORMANCE INDICATORS IN THE PROVINCES
Purnawan Junadi
Fakultas Kesehatan Masyarakat, Universitas Indonesia
ABSTRACT
Background: Performance indicators are used to assess the program achievement. The government used national development program (propenas) indicators to evaluate the outcome of health program every 5 years. Before decentralization, the collection of data never became a problem. After decentralization, regional do not have the responsibility to report to the central any more. As a result department of health finds itself difficulty to collect data needed for benchmark. In contrast, as its role moves toward guidance and control, the need to have performance indicators is bigger. Therefore, it is crucial to assess how in reality collection of propenas indicators in the province.
Objective: To assess how far the provinces achieved the target as specified by Propenas Indicators, and which province collected most of the indicators, which can be used to decide what kind of incentives needed in the future. In addition we would like to know which indicators were collected most, and which were difficult. This information is important for simplifying indicators, reduce data collection burden, which in return more likely to be collected
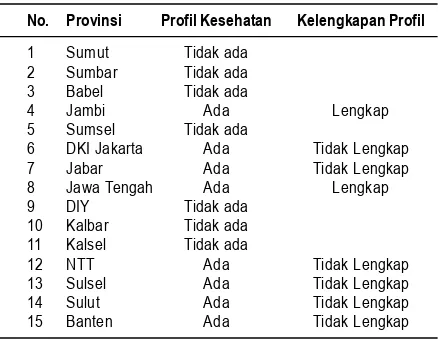
Methods: This was a post test study, conducted in 15 provinces selected based on its rank in term of health manpower indicator and geographical location. We collected available data on Propenas indicators in samples provinces. In addition we asked difficulties to collect each indicators and what their suggestion.
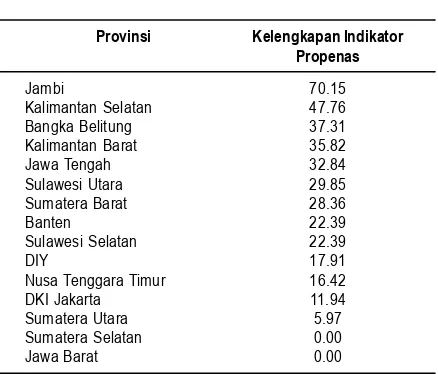
Conclusion: Out of 15 provinces, only Jambi, Kalimantan Selatan and Bangka-Belitung who relatively had complete Propenas Indicators. Only 8 provinces had health profiles, and only 2 of them complete. Out of 61 performance indicators specified in Propenas, only 16 of them are easily to collect.
We suggest that central government should takes this issue more seriously by providing special funds for data collection for health performance indicators, and giving province benchmarking and socio economic determinant analysis to produce useful information for province decision making. In addition, central government should refine performance indicators by simplifying data that proven difficult to be collected in the field, and takes roles of further validity, reliability and feasibility analysis
Keywords: decentralization, performance indicators, propenas
Kesehatan (jangka 5 tahun).2 Untuk mengetahui
seberapa jauh visi tercapai, maka dikembangkan indikator keberhasilan peningkatan pencapaian visi tersebut, meskipun sudah tentu perubahan yang terjadi bukan kontribusi pembangunan kesehatan saja, melainkan juga peran dari pembangunan sektor lain termasuk dalam pembangunan nasional.