i
PROCEEDING
SOUTH EAST ASIAN CONFERENCE ON MATHEMATICS
AND ITS APPLICATIONS
SEACMA 2013
“Mathematical Harmony in Science and Technology”
Published by:
MATHEMATICS DEPARTMENT
Testing Proportion for Portfolio Profit of
CAPM and LCAPM
Retno Subekti1, Rosita Kusumawati2
[email protected], [email protected]
ABSTRACT. Liquidity Adjusted Capital Asset Pricing Model (LCAPM) is a model that takes into account the relationship of liquidity as a risk to asset returns. The aim of this study is to test the proportion of portfolio profit Capital Asset Pricing Model (CAPM) and LCAPM along with illustrative case studies using stock data in 2012. Furthermore, how the performance of profit compared LCAPM portfolio in a month with CAPM performance prediction and reality as well as differences in the proportion of test results CAPM and LCAPM maximum profit. The data used are the daily returns from January to April 2012. Descriptively, about 60% the proportion of the portfolio that is formed shows maximum LCAPM more profitable than the CAPM. But the proportion of test data shows that the proportion of the sample does not yet support LCAPM portfolio to maximize profit from the proportion of profit that was formed CAPM.
Keywords: Test for the proportion, CAPM, LCAPM
1.
Introduction
CAPM is an equilibrium model that describes the relationship of risk and returns in a more modest, and only uses one variable (i.e. the variable beta). In the process of investment, an investor should first learn a few concepts from the investment policy will be the policy thinking at every stage of the investment decision will be made. The fundamental matter in the investment decision-making process is an understanding the relationship between the level of expected investment profitability (return) and the risk of an investment. Relationship of risk and expected return is a linear relationship. The greater the expected return level the greater the risk to be incurred. Therefore, we need to set up an optimal portfolio which is a combination of a number of preferred shares to obtain the highest profit and the smallest risk. A portfolio is inseparable from the existence of risks.
1
FMIPA UNY, Karangmalang Yogyakarta 2
FMIPA UNY, Karangmalang Yogyakarta Proceeding South East Asian Conference
on Mathematics and its Application (SEACMA 2013) ISBN 978-979-96152-8-2
xpected rate of return of a stock will be influenced by two factors namely systematic risk and stock liquidity. Liquidity is the cost of the sale or purchase of securities immediately. According to (Chordia, Roll, Subrahmanyam, 2000), liquidity is a risk of changing every time good for individual stocks as well as for the overall market. Stock liquidity approach can be measured by the bid - ask spread of a stock. Put forward CAPM model, a new approach that takes into account the liquidity risk is called Liquidity Adjusted Capital Asset Pricing Model (LCAPM) (Acharya, 200 ). In LCAPM model, the return of any security is influenced by several factors namely the price expectations of stock liquidity, covariance of stock returns, liquidity with market return and market liquidity. From the price of the sale and purchase of shares can be obtained daily stock price return. The value is obtained by calculation of stock returns given time period closing price of the previous period. Many authors proven that LCAPM has more advantages rather than CAPM such as (Minovic ivkoviz, 2012) and (Acharya, 200 ). This mini research as simple investigation to look performance in reality of portfolio formed by LCAPM. The simple idea is to look the realized return of two models then compare them from the proportion of positive profit. So this paper aims to compare the profit proportion of portfolio which is developed using CAPM and LCAPM.
2.
Literature Review
2.1 Portfolio and Investment
=
with:
= returnportofolio
=proportion of investor funds are invested in ithsecurities N =number of securities
Expected return on a portfolio is the weighted average expected return of individual securities. Therefore, the expected return of portfolio can be expressed mathematically as follows:
= = =
= =
(1)
2.2 CAPM and LCAPM
Assumed that investors can lend funds (lending) or borrowing (borrowing) funds in an amount not limited to the risk-free interest rate, following CAPM expected return,
= +
(2)
Liquidity can not be calculated or determined exactly. Therefore used an approach for calculating liquidity. There are several approaches that are used to calculate liquidity. One common approach used to calculate liquidity is bid-ask spread (B ).
=
(3)
id is the price of the stock purchase
Ask is the lowest price that the seller offered to buyers
xpected return LCAPM involve the liquidity of each stock and the market so that in the model there is an additional beta
= ,
= ,
= ,
= ,,
xpected eturn LCAPM (Acharya, 2 ) is
= + + O + O O O
( )
with :
is liquidity of the stock
2.3 Profit Portfolio
Suppose a portfolio consisting of 3 stocks namely X , Y and Z with respective weights a, b , and c then the portfolio return is = + + . Whereas if illustrated at the time when portfolio is constructed, the stock weights in the portfolio will show many strands of shares purchased by an investor at that price and value of portfolio
= + +
with,
initial portfolio value (portfolio value at time t 1)
, , many strands of stock
(weight x amount of capital) price of stock
Profit earned by portfolio is the difference between portfolio values when it is sold and initial portfolio value.
= + +
with,
= initial portfolio value at time t
, , = many strands of stock
= (weight x amount of capital) / price of stock
, , = share price of stock X, Y, and Z at time t (when it is sold)
Therefore, portfolio profit is equal with,
=
(5)
3.
Application of CAPM and Portfolio LCAPM
The research object in this study is listed stocks in the LQ – 45, which are stocks that have high liquidity ratio. Application of CAPM and LCAPM will be performed on all combinations of stocks that have previously been selected to meet the assumptions of normality return. Writers use daily closing price of stock listed on the Stock Exchange, listed stocks in the LQ – 45. Closing price data is used to predict stock returns. Besides using the bid ask spread data of each stock to calculate liquidity of the stock, Bank Indonesia Certificate is used also as a non-risky asset and IHSG data as market portfolio. The description of data can be seen from the data in Table 1.
Table 1. Data Description
Data Daily stock price, IHSG/CSPI, SBI
Source of data www.yahoofinance.comdan www.bigo.id
Period of data January 2012-March 2012
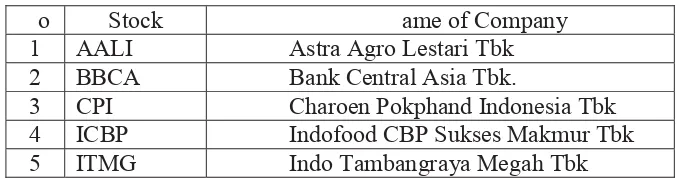
that is considered represent a variety of fields such as banking, food, and mining. For details, we choose stocks from 10 stocks that normally distributed. Those stocks are AALI, BBCA, PGAS, TL M, CPI , ICBP, and ITMG. Because the resticted of this research, we selected 5 from to get a new simple portfolio. So we have 21 combination portfolio. This is ilustration step by step of one of portfolio formed.
Table 2. List of Shares Being Object Observations
Step 1. Stock return data normality test
Before calculating the expected return, it is necessary to test the normality of the return portfolio data. ormality test data is worked using SPSS software. It can be seen from the output attachment stock normality test below, all p - values 0.05 so that the data normally distributed
One-Sample Kolmogorov-Smirnov Test
AALI BBCA CPI ICBP ITMG
olmogorov-Smirnov Z . 3 1.00 . 33 . 1 . 2
Asymp. Sig. (2-tailed) .300 .2 1 .34 .2 0 .355
a. Test distribution is ormal.
Step 2. Beta Counting
In relation to investment and stock trading Stock Exchange, beta is an indicator of risk level inherent in the stock market risk. nowing beta stocks, investors can determine the sensitivity of the stock to market risk. The movement of the Composite Stock Price Index (CSPI) reflects market risk. Since market is used as one of references, the market beta is represented by CSPI and set equal to one.
o Stock ame of Company
1 AALI Astra Agro Lestari Tbk 2 BBCA Bank Central Asia Tbk.
Stock, which has beta equal to one, has sensitivity equal to the market sensitivity. If the CSPI index fell by one percent, then the stock is also fell down one percent and if the index rose by two per cent, then the stock is increase also by two percent. Beta stock is less than one it means that the stock price sensitivity is lower than the index.
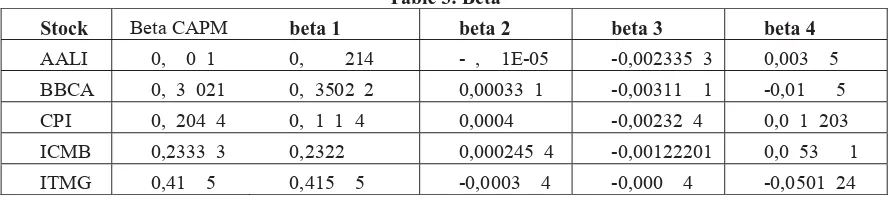
Table 3. Beta
Stock Beta CAPM beta 1 beta 2 beta 3 beta 4
AALI 0, 0 1 0, 214 - , 1E-05 -0,002335 3 0,003 5 BBCA 0, 3 021 0, 3502 2 0,00033 1 -0,00311 1 -0,01 5 CPI 0, 204 4 0, 1 1 4 0,0004 -0,00232 4 0,0 1 203 ICMB 0,2333 3 0,2322 0,000245 4 -0,00122201 0,0 53 1 ITMG 0,41 5 0,415 5 -0,0003 4 -0,000 4 -0,0501 24
alues ȕVKRZVWKHVHQVLWLYLW\ of a stock to market movements. So the
KLJKHUWKHYDOXHȕWKHPRUHstock sensitive to changes in the stock market. In this
case &3,1 KDV WKH JUHDWHVW ȕ YDOXH ZKLFK PHDQV WKH VWRFN &3,1 LV WKH PRVW
sensitive stock to changes in CSPI.
ȕ2 values show sensitivity of stock liquidity compare to market liquidity. Stocks with the highest ȕ2 value, is stock with liquidity that is very sensitive to changes in market liquidity. If the liquidity market liquidity of its stock changed it will also change. In this case, the most sensitive stock to stock market liquidity is CPI , liquidity of the stock will increase expected return of stock.
ȕ3 value indicates the sensitivity level of stock price to the liquidity of a stock. ICBP is the most sensitive stock to liquidityȕFRQWULEXWHGQHgatively to the expected return. This happens because investors will buy securities with greater liquidity and sell securities which are less liquid and this will drive up the price of liquid securities and push down prices of illiquid securities. nder these conditions the security price will be adjusted until all the securities that investors are willing to have are available.
alue of ȕ4 indicates the liquidity level of sensitivity to market changes. Liquidity of a stock will change if the market changes. Liquid stocks are very sensitive to changes in the stock market. ICBP has the highest value.
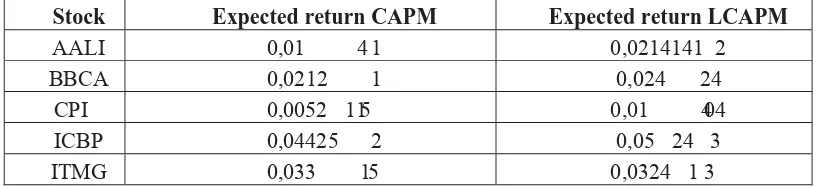
Step 3. Calculation of expected return using CAPM and LCAPM
variance is 0.0000 105. The interest rate of Bank Indonesia as risk-free assets is 5. 5 . The Calculation of expected return LCAPM should measure both liquidity and return marker sensitivity to market changes. Profit rate sensitivity to changes in the market is called beta investments. ext, expected return of each stock can be calculated using the CAPM and LCAPM.
Table 4.Expected eturn of CAPM Portfolio and LCAPM Portfolio
Stock Expected return CAPM Expected return LCAPM
AALI 0,01 4 1 0,0214141 2
BBCA 0,0212 1 0,024 24
CPI 0,0052 115 0,01 404
ICBP 0,04425 2 0,05 24 3
ITMG 0,033 15 0,0324 1 3
Step 4. Weight calculation based on the CAPM and LCAPM
sing the calculation of expected return on the above tables, the proportions of stocks in the portfolio selection can be calculated. sing Excel software, weights for each stock can be seen in table .
Table 5.Weight using CAPM and LCAPM
Stock Weight of CAPM Weight of LCAPM
AALI 1,2 4 50221 0, 14 203
BBCA 0,100 4 3 0,0 1 4
CPI 0,1 1 31 2 0,1101143 1
ICBP -0,445 3214 0,01 05 011
ITMG -0,121 55 3 -0,0 1124
Weighting results are based on weight / proportion of negative value means allowed short sale. Weight / greatest proportion in the portfolio CAPM and LCAPM is stock (aal) PT. Astra Agro Lestari Tbk, namely 1.2 and 0. .
Step 5. sing A IMA forecasting stock price for the period April 2012
assistance. Forecasting data is needed to provide an overview of the stock price in the portfolio formed
Table 6.Stock price forecasting using A IMA for April 2012
Tanggal AALI BBCA CPIN ICBP ITMG
02/04/2012 22 1 ,5 101,32 2 5,01 52 4,35 42 ,4
03/04/2012 224 , 103,14 2 4,4 52 ,03 42 1
04/04/2012 2233 ,1 104, 2 03, 3 52 3, 42 2,
2 /04/2012 22031 12 , 2 1 , 5 531 ,1 43 4 ,
2 /04/2012 22030, 12 , 1 2 2 ,3 531 , 43 11,5
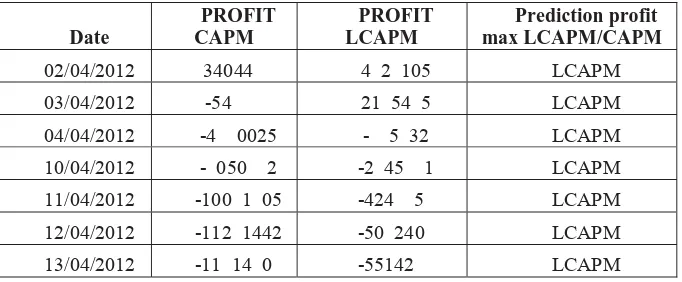
Step . CAPM and profit comparison LCAPM
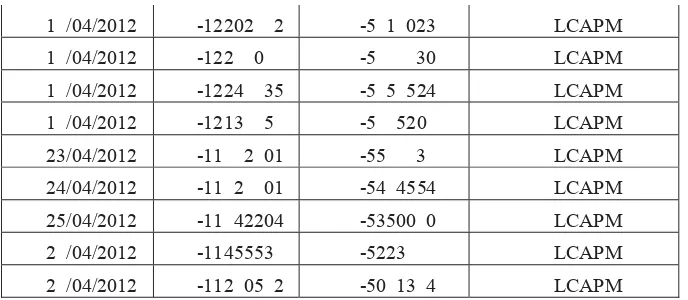
If the capital of the investor is p 500,000,000.00 to buy 5 shares of each stock weights in the Table 5. Investors will buy five shares on 2 March 2012, if the investor plans to sell the shares at the date of the period 2 April 2012 until April 2 , 2012 the investor can predict the value of the stock portfolio by first predicting stock prices period 2 April 2012 until April 2 , 2012 using A IMA method. Predictive value of the portfolio can be calculated by multiplying the difference between the purchase price and the sale price of real stock was predicted by the amount purchased. By using the share price prediction Table then we compare profit predictions LCAPM and CAPM method.
Table 7.Prediction Profit CAPM and LCAPM
Date
02/04/2012 34044 4 2 105 LCAPM
03/04/2012 -54 21 54 5 LCAPM
04/04/2012 -4 0025 - 5 32 LCAPM
10/04/2012 - 050 2 -2 45 1 LCAPM
11/04/2012 -100 1 05 -424 5 LCAPM
12/04/2012 -112 1442 -50 240 LCAPM
1 /04/2012 -12202 2 -5 1 023 LCAPM
1 /04/2012 -122 0 -5 30 LCAPM
1 /04/2012 -1224 35 -5 5 524 LCAPM
1 /04/2012 -1213 5 -5 520 LCAPM
23/04/2012 -11 2 01 -55 3 LCAPM
24/04/2012 -11 2 01 -54 4554 LCAPM
25/04/2012 -11 42204 -53500 0 LCAPM
2 /04/2012 -1145553 -5223 LCAPM
2 /04/2012 -112 05 2 -50 13 4 LCAPM
Portfolio of real value can be calculated by multiplying the difference between the purchase price and the sale price of shares of shares real estate with total shares purchased sheet. By looking at the real sale price on 2 April to 2 April 2012, the profit comparison can be seen in Table .
Table 8.Profit real CAPM dan LCAPM
TGL PROFIT CAPM PROFIT LCAPM PROFIT
02/04/2012 1 .0 . ,2 20. 02.1 , 1 LCAPM
03/04/2012 2 . 4.2 3, 4 23.20 .13 ,33 CAPM
04/04/2012 11.445. 44, . 53.334,2 CAPM
10/04/2012 .355. 2 , 5 . 53.11 , 34 CAPM
11/04/2012 14.532.55 ,22 .51 .053,2 CAPM
12/04/2012 .22 .25 ,2 4 . 13.44 , 5 LCAPM
13/04/2012 1 .3 3.0 ,4 14. 04.232,33 CAPM
1 /04/2012 22.00 .433, 14.04 .415,44 CAPM
1 /04/2012 24. 30. 00, 2 1 . 1 .02 ,0 CAPM
1 /04/2012 23.134.224, 1 .353.42 ,5 CAPM
1 /04/2012 25.41 .5 ,1 1 .3 4. 1 ,11 CAPM
23/04/2012 2 . 2 .5 3, 13. 0. , 1 CAPM
24/04/2012 . 5,13 2 -4.343.1 0,21 CAPM
25/04/2012 -11.10 . 4,1 - .51 .333,242 LCAPM
2 /04/2012 -25.41 .520,1 -1 . 2.5 3,2 LCAPM
From the summary results table shows profit predictions and reality of predicted maximal profit obtained on 2 April 2012 is p 4, 2 ,105.00, while real gains yield maximum profit obtained on April 23, 2012 is p 2 , 2 ,5 3. . While the application of prediction results show that the model gives a maximum profit is LCAPM. For information on the minus indicates a loss. If observed on 25 and 2 April when the two models produces a minus profit, using LCAPM received fewer loss than CAPM loss. Based on results from the CAPM and LCAPM, it looks like the LCAPM is the good one. But how with all portfolio, is it the same result Here is a summary comparison of 21 portfolios formed.
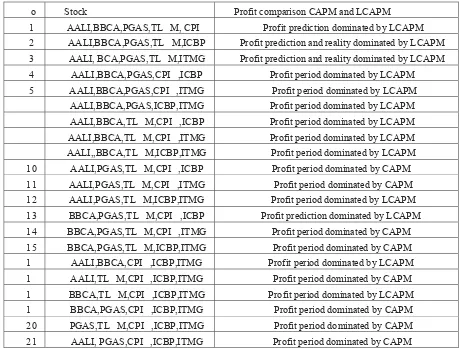
Table 9.Summary of profit portofolio comparison
o Stock Profit comparison CAPM and LCAPM
1 AALI,BBCA,PGAS,TL M, CPI Profit prediction dominated by LCAPM
2 AALI,BBCA,PGAS,TL M,ICBP Profit prediction and reality dominated by LCAPM 3 AALI, BCA,PGAS,TL M,ITMG Profit prediction and reality dominated by LCAPM
4 AALI,BBCA,PGAS,CPI ,ICBP Profit period dominated by LCAPM
5 AALI,BBCA,PGAS,CPI ,ITMG Profit period dominated by LCAPM AALI,BBCA,PGAS,ICBP,ITMG Profit period dominated by LCAPM
AALI,BBCA,TL M,CPI ,ICBP Profit period dominated by LCAPM AALI,BBCA,TL M,CPI ,ITMG Profit period dominated by LCAPM
AALI,,BBCA,TL M,ICBP,ITMG Profit period dominated by LCAPM 10 AALI,PGAS,TL M,CPI ,ICBP Profit period dominated by CAPM
11 AALI,PGAS,TL M,CPI ,ITMG Profit period dominated by CAPM 12 AALI,PGAS,TL M,ICBP,ITMG Profit period dominated by LCAPM
13 BBCA,PGAS,TL M,CPI ,ICBP Profit prediction dominated by LCAPM 14 BBCA,PGAS,TL M,CPI ,ITMG Profit period dominated by CAPM
15 BBCA,PGAS,TL M,ICBP,ITMG Profit period dominated by CAPM
1 AALI,BBCA,CPI ,ICBP,ITMG Profit period dominated by LCAPM 1 AALI,TL M,CPI ,ICBP,ITMG Profit period dominated by CAPM
1 BBCA,TL M,CPI ,ICBP,ITMG Profit period dominated by LCAPM 1 BBCA,PGAS,CPI ,ICBP,ITMG Profit period dominated by CAPM
Descriptive of 21 simulated portfolios dominated 13 from LCAPM and portfolio from CAPM. The proportion of profit dominated from LCAPM is 1. and from CAPM is 3 .1 . Then we want to check the positive return resulted from CAPM and LCAPM from all combination. The result is the number of positive profit from CAPM is 3 and we get positive profit from LCAPM . It means the proportion profit from CAPM and LCAPM are 14.2 and 33.33 respectively.
Then we test two proportion, we get the output from MI ITAB below, Hypothesis
H0 p LCAPM - p CAPM = 0 vs. Ha p LCAPM - p CAPM 0
calculation by using the following Minitab output
Test and CI for Two Proportions
Sample X N Sample p 1 7 21 0.333333 2 3 21 0.142857
Difference = p (1) - p (2)
Estimate for difference: 0.190476
95% lower bound for difference: -0.0202508
Test for difference = 0 (vs > 0): Z = 1.49 P-Value = 0.069
H0 is accepted because p - value> 0.05 so the sample is still not support the
hypothesis that proportion profit LCAPM is greater than the proportion profit CAPM.
4.
Conclusion
the beginning from our idea to explore LCAPM. ome aspects related with risk have been not investigated, this research will be continued to repair and developed into others perpective.
References
1. Acharya, v. d. 2005 . Asset ith Li uidty Risk . Journal of Financial Economic, , 3 5-410.
2. Chordia, T., Roll, R., ubrahmanyam, A. 2000 . Commonality in Li uidity. Journal Financial Economics.