SEMINAR NASIONAL PENDIDIKAN SAINS “Peningkatan Kualitas Pembelajaran Sains dan Kompetensi Guru melalui Penelitian & Pengembangan dalam Menghadapi Tantangan Abad-β1”
Surakarta, 22 Oktober 2016
CLIMATE CHANGE IMPACTS ON BALI MYNA (
LEUCOPSAR
ROTHSCHILDI
) DURING THE LAST DECADE
(CASE STUDY: WEST BALI NATIONAL PARK)
Jean Jacques Fanina
Master in Environmental Science at Sebelas Maret University, Surakarta, 57126
Abstract
Climate change is affecting birds worldwide. Such impacts have always been prevailing due to rising temperature or unpredictable rainfall that might be too abundant or little and which in turn bring about dire consequences upon the lives of the endemic bird known as Bali Myna (leucopsar rothschildi). In this paper we propose a framework analysis describing the possible patterns of change in the distribution of Bali Myna (leucopsar rothschildi) population based on climate parameters such as temperature, rainfall and humidity in hope to better have an improved quantitative methodology meant to identify and describe these patterns. This study uses a descriptive qualitative method recoursing to focus upon sites observation and a deep interviews to be carried out while using SPSS 16 in order to know the variables correlation in hope to determine the plausible significance between them that allow us to analyse the effects of environmental variables on bird species in this study. We tested the proposed methodology using data from the West Bali National Park and the existing data of climate variables over the last decade where climate variables are considered to be significant factors influencing the lives of Bali Myna (leucopsar rothschildi). This study discovers that increases in temperature and precipitation each year have adversely affected the number of Bali Myna (leucopsar rothschildi) population indicating that the bird’s survival capacity depends largely much on temperature. Besides, it has been perceived that Bali Myna is very reproductive in rainy season but its fluctuations whether high or low impacts them as well. The distribution mapping show a decline of population in 2006 while an increase was perceived during the last five year period of 2011-2015. Besides, over the same period, a slight increase of 0,4°C in mean temperature was noticed, precisely in Cekik our research site where Bali Myna (leucopsar rothschildi) are.
Keywords: Climate change, Bali Myna (leucopsar rothschildi), Temperature, Rainfall, Relative Humidity
Introduction
There are undeniable impacts of climate change upon biodiversity as a whole (Heller and Zavaleta, 2009) especially, affecting birds (Leech and Crick, 2007), their capacity to survive, productivity, and population dynamics as well (Sanz et al., 2003). Human activities have been blamed to have often led to such serious changes in the composition of global atmosphere (Robert M. Carter, et al. 2008; Janet K. Swim et al. 2011; Michael J. Ring, et al. 2012) in spite of some assumptions denying human interference on global warming (Chris Towsey et al. 2010). In fact, most of human activities have significantly caused the increase of greenhouse gases concentrations in the atmosphere, including aerosols, due to burning of fossil fuels releasing CO2, CH4, (Arthur B. Robinson, et al. 2007) which in
turn cause global warming that controls the Earth’s temperature (Joseph Santhi Pechsiri1 et al. 2010) resulting in rising sea level (Thomas F. Stocker et al. 2013), ocean acidification (Ellycia Harrould-Kolieb et al. 2010; G. Fauville et al. 2013; Eric V. Hull. 2014), changes of water cycle (Plate, E. J. 2002; Axel Bronstert, 2003; Thomas G. Huntington, 2006), extreme weather (IPCC 2012;), and so forth.
risks as backed by some researchers assuming that climate change could be the key extinction factor driving off tropical birds on the brink of extinction (Colwell et al. 2008; Sekercioglu et al. 2008; Hole et al. 2009). However, a lack of research poses as challenges to fully measure and predict the impacts of climate change regarding other drivers of extinction including loss of habitat, invasive predators, over exploitation, and disease (Brook et al. 2008; Sodhi et al. 2011) and the real causes of uncertainty predicting the climate change impacts on biodiversity that differ owing to the lack of long-term empirical Araujo & Rahbek 2006 data on that regard that fails to claim its incorporation on biological processes (Araujo & Rahbek 2006; Heikkinen et al. 2007; Beaumont et al. 2008). Only few studies were undertaken in tropical forest areas related with the climate change effects on the bird communities but most of them were not profoundly studied.
Among the most threatened birds in Indonesia, is the Bali's endemic white Myna, known as Rothschild's Starling (Leucopsar rothschildi). This would entail a clear message noting that this beautiful white Rothschild's Starling (Leucopsar rothschildi) is on the verge of extinction because of human activities related with forest loss contributing to the greatest threat to birds (Rahmani Asad R. 2008 in Anjan Dandapat et al. 2001).
Being aware of this situation that has put the country in jeopardy, the Indonesian government has been trying their best to tackle the issues on climate change as indicated in Indonesia government regulation number 108, 2015 about an amendment to government regulation number 28 of 2011 on the management of natural area where article 24 paragraph (3) of Law Number 21 Year 2014 reinforces forests conservation efforts. Besides, Law No. 32, 2009 focuses on the protection and management of the environment stipulating that global warming is increasing resulting into an exacerbated environmental degradation that requires a necessary environmental protection management. Article 2 in that law weighs the protection of environmental management
supported by article 5 that is meant to maintain the environmental balance, stability and productivity. Other than that, the Indonesia Climate Change Trust Fund (ICCTF), a nationally managed trust fund aims to contribute forests conservation efforts effectively and efficiently to climate change issues in government planning and the implementation of actions against climate change across Indonesia through emission reduction target and allocated sectorial target for 5 (five) strategic sectors, namely forestry and peat land, agriculture, energy and transportation, industry, and waste.
In spite of such huge endeavor though, the local government program on this battle is not sufficient to help promote any best concrete solution to fight against the dire impacts of climate change on Bali Myna (leucopsar rothschildi) despite some recent efforts leading to conservation system. Thus, it is high time to conduct an extensive research on the effects of climate change on tropical birds characteristics that make certain bird species more susceptible to climate change. Other than that, this paper will focus on how to understand the correlation of certain plausible parameters of climate change that affect the Bali Myna (leucopsar rothschildi).
Methods
This study uses a descriptive qualitative method, with a phenomenological approach. Phenomenological approach is a research that attempts to explain or reveal the meaning of a concept or phenomenon of experience faced by several individuals (Mardikanto, 2002). The approach used is a cross sectional one namely the data collection of independent variables and the dependent ones collected at the same time (point time approach) (Notoatmodjo, 2012).
Fatchan (2011) explains the purpose of qualitative research with phenomenological approach is to understand the meaning of events, symptoms and or
interaction of human
In order to better undertake this study, both primary and secondary data were necessary. With regard to primary data, sites observation had to be done and deep interviews were carried out as well. Collection of secondary data was obtained from local weather stations in Negara, Bali where temperature, rainfall, and humidity were recorded across the studied areas including independent variables that show the cause of the onset or changes in the dependent variable (Riwidikdo, 2009). The independent variables in this study are temperature, rainfall and humidity whereas the dependent variable is the variable that is affected by independent variable (Riwidikdo, 2009). The dependent variables in this study are Bali Myna.
Besides, we used SPSS 16 in order to know the variables correlation in hope to determine the plausible significance between variables that allow us to analyse the effects of environmental variables on bird species in this study.
1. Physical Condition Location a. Location
West Bali National Park also locally known as Taman Nasional Bali Barat (Bali Barat National Park) covers an area approximately 190 square kilometers where 158 square kilometers of which are land and the rest for sea surface. Several habitats consisted of 10 areas are considered to be the main release distribution sites of the Bali Myna including Banyuwedang, Teluk Terima, Cekik, Prapat Agung, Buleleng, Brumbun/Klompang, Teluk Kelor, Lampu Merah, Tanjung Gelap, and Tegal Bunder.
b. Topography
According to Bali Map on 1: 250,000 scale, indicates that some areas such as Teluk Kelor, Teluk Brumbun, Lampu Merah, Tegal Bunder are located on mountainous areas
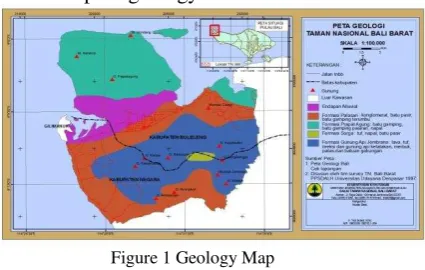
Geologically speaking, the following figure shows the park geology features.
Figure 1 Geology Map Source: Taman Nasional Bali Barat
Based on the Geological map of Bali island underscaled 1: 250,000 as sourced from Indonesia Directorat of Geology, indicates various rock formations of calcareous sand, marl and alluvium scattered in different sites within the park border.
2. Environmental Conditions
The essence of the environment includes three basic factors, namely biotic, abiotic and social or culture. These three basic factors interact and influence each other to form a system of complex life. Human beings as one part of biotic factors have a more important component of ecosystem which influences the human life. He based his study following the findings of Schmidt and Ferguson who in turn divided tropical climate into eight types consisting of each own characteristics as shown in the following table.
Table 1 Type of Climate based on Q (Quotient) Value
Q VALUE ZONE TYPE OF CLIMATE
According to the table above, describing the rainfall classification according to Schmidt and Ferguson, shows that the bigger the Q value the drier the land will become and vice versa, that is, when the Q value gets smaller the soil will be much wetter.
Schmidt and Ferguson divides climate type of one area of its monthly dry area with its average wet area within a decade. In order to determine the type of climate, they used the following formulation:
Q = � � − ℎ �
� � − ℎ � ×
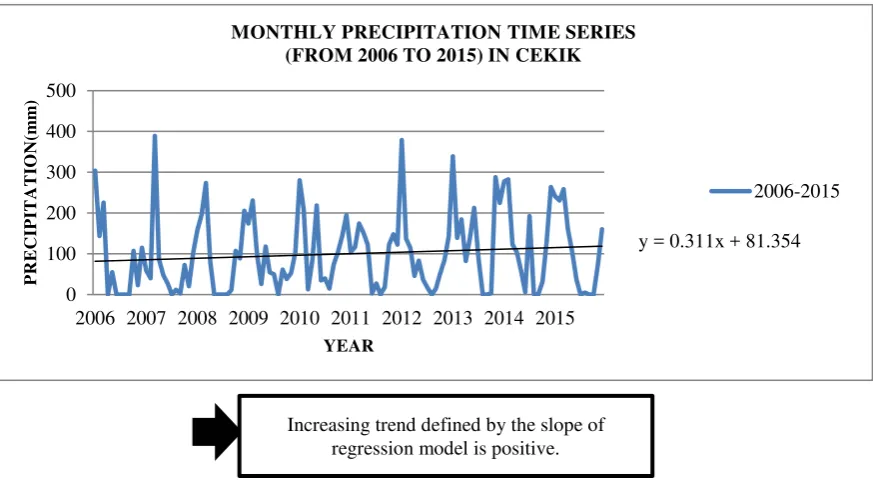
Note that this study focuses primarily upon the last 10 years of rainfall data taken from BMKG based in Negara, Bali. That is, starting from the year 2006 until the recent data of last year. The average amount of rainfall per month used in this research can be seen in the following figure.
Figure 2 Monthly Precipitation Time Series (From 206-2015)
Based on the figure above, it can be concluded that the average monthly rainfall varies. The highest 195,11 mm in 2014, and followed by 168,76 in 2015, while the lowest is 51,5 in 1997, and having an average monthly moisture of 3,5. However, this can be explained that during these years, water availability in the research area flows much providing enough water optimilisation for the soil. The following table clarifies it below.
Table 2 Monthly Average of Rainfall during 1996 – 2015
It is undeniably obtained from the data as shown by the table above that Cekik area possesses an average yearly rainfall during the last 20 years accumulating 1282,76 mm/year.
So, the average number of wet month (W) is:
Q = � � × 100
Q = ,
, × 100
Q = 73,68
Based upon the Q value calculation, the rainfall amount is averaging 73,68%. Thus, this research area is found within climate type D having a Q value of 60% to 100% (Shmidt and Ferguson, 1951). For
No Average Total
1 Rainfall average per year 1282,76 2 Average maximal rainfall 365 3 Average minimum rainfall 51,5
4 Average wet season 9,5
5 Average moist season 3,5
6 Average dry season 7
y = 0.311x + 81.354
0 100 200 300 400 500
2006 2007 2008 2009 2010 2011 2012 2013 2014 2015
PRECI
PITATI
O
N(m
m
)
YEAR
MONTHLY PRECIPITATION TIME SERIES (FROM 2006 TO 2015) IN CEKIK
2006-2015
further explanation, Mohr used his method emphasizing that,
a. if the amount of rainfall within one month is more than 100 mm, that month is viewed as wet one. b. if the amount of rainfall obtained in
one month is less than 60 mm, then is is a dry month
c. if the amount of rainfall within a month is between 60 mm and 100 mm, it is named a moist month.
3. Soil Humidity (%)
The average yearly soil humidity value (%), as measured in the research area, during the last 10 years, that is, from 2006 until 2015, vary from the lowest in 2013 to the highest 86% in 2000 but its yearly average is found between 78,25% in 1996 to 89,23% in 2010 as indicated in the following graph.
Figure 3 Average Monthly Relative Humidity
According to the graph above, it can be concluded that, the average yearly soil humidity in the research area Increasing trend defined by the slope of regression model is
positive as far as time series from 2006 to 2005 is concerned but with a slight decreasing trend.
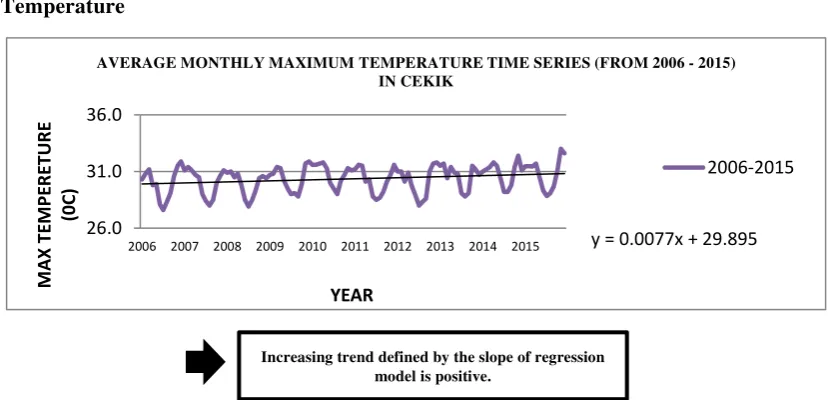
4. Temperature
Figure 4 Average Monthly Maximum Temperature Time Series (From 2006-2015)
y = 0.0009x + 83.186
74 76 78 80 82 84 86 88 90
2006 2007 2008 2009 2010 2011 2012 2013 2014 2015
RE
L
AT
IVE
H
UM
IDIT
Y
(%)
YEAR
AVERAGE MONTHLY RELATIVE HUMIDITY TIME SERIES (FROM 2006 TO 2015) IN CEKIK
2006-2015 Linear (β006-…
y = 0.0077x + 29.895 26.0
31.0 36.0
2006 2007 2008 2009 2010 2011 2012 2013 2014 2015
M
A
X
TE
M
PE
R
E
TU
R
E
(0C)
YEAR
AVERAGE MONTHLY MAXIMUM TEMPERATURE TIME SERIES (FROM 2006 - 2015) IN CEKIK
2006-2015
b. Biotic Components
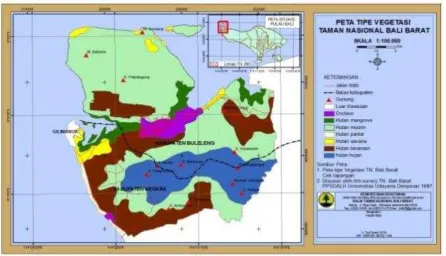
1. Vegetation
The vegetation components and structure in the research area is composed of several
types of forest ecosystem which include, rainforest areas, savanna, mangrove, and dry deciduous ones.
Figure 5 Vegetation Map of West Bali National Park
According to the map above, it shows that there are various vegetation types described in the research site. In general, plants species composition in this area cannot be separated from the ecosystems in the region. Broadly speaking ecosystem natural resources are divided into two major groups, namely:
The zonal type, which is influenced mainly by the climate having an ecosystem that depends on the intensity of rainfall divided into humid tropical ecosystems (tropical rain forest), tropical season (monsoon forest) and savanna with various altitude (elevation) that can be divided into:
In the elevation of 2-1000 m belonging to the type of Lowland Tropical Rain Forest;
In the elevation of 1000 - 2400 m included in the Tropical Rain Forest type Mountains;
In the elevation of 2400 - 4150 m belong to the type of Rainforest. While in the monsoon forest will be divided into:
At elevations below 1000 m belongs to the type of season Lowland Forests;
At elevations above 1000 m including the Forest mountains.
The types of grass are usually of the genera Panicum, Pennisetum, Andropogon and Imperata. While at tree level consists of very rare trees that serve as shelter for wildlife, especially herbivorous ones. The existing trees in the savanna generally dominated by Acacia leucophloea, locally known as pilang, Zyzypus rotundifolia, Phylantus Emblica and Azadiractha indica. Forest types in TNBB by type zonal (most predominantly influenced by climate), among others:
However, many forests grown in areas with rain-type D through H are characterized by a long dry season. Monsoon forest consists of trees with an open canopy. Most of which consist of the types of trees that shed their leaves. Monsoon forest TNBB at tree level is dominated by Vitex pubescens, Strynos lucida, and Symplocos javanica.
In the group a zonal ecosystem, in TNBB can be distinguished among other things:
Mangrove forest, located in the coastal areas are always or regularly inundated by sea water (coastal tidal areas).
c. Socio-Cultural Components
1. Cultural Parameters and Community Perception
Culture has a very important role in the conservation of biodiversity in the undertakings of the West Bali National Park. Bali Myna is one bird species that has recently been put on high demand especially by bird traders, local bird keepers, and bird
exported abroad including America and Singapore. This endemic Bali Myna, formerly called Bali Starling despite its appearance and all its features do not really look Starling but rather than belonging to Myna, is locally considered as part of the traditional animal breeding in Java area in the past where currently its fame has risen among bird keepers and bird lovers enticing more and more people to breed them, not only for fun but also in a lucrative way.
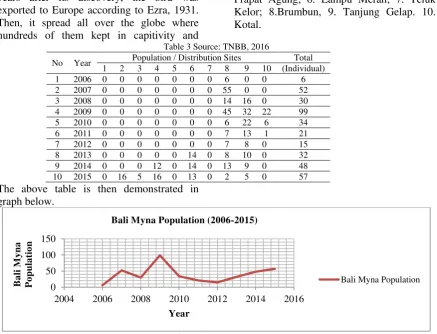
B. Bali Myna 1. Population
Bali Myna has always been considered and enlisted among the most critically endangered species by the red list of UICN and their population keep fluctuating as shown the following table.
Tabel Data of Bali Myna Population According to the Release Record from 2006-2015
Sites: 1. Banyuwedang; 2. Teluk Terima; 3. Tegal Bunder/Sumber Klampok; 4. Cekik; 5. Prapat Agung; 6. Lampu Merah; 7. Teluk Kelor; 8.Brumbun, 9. Tanjung Gelap. 10. Kotal.
Table 3 Source: TNBB, 2016
No Year Population / Distribution Sites Total 1 2 3 4 5 6 7 8 9 10 (Individual)
Figure 6 Source: TNBB
0 50 100 150
2004 2006 2008 2010 2012 2014 2016
Based on the results of the encounter individuals due to local governmental efforts
to add more population in the wild as they tended toward a severe extinction.
3. Result
We found out that there is a fluctuation of bird population between 2006 and 2015, which is affected by temperature, rainfall and humdity as shown in the following table.
Table 4 Population of Bali Myna during 2006 - 2015 period Year Population R. Humidity (%) Temperature (°) Rainfall
(mm)
Based upon the table above, it is evident that the lowest population was registered in 2006 due to a very long dry season known as El Nino and with the highest one in 2009 due to increase of release to the wild. It can be concluded that there is a slight increase of temperature of 0,4°C, while rainfall experienced sharp fluctuations between those
time series with the lowest recorded in 2007 as a result to the long dry season of the previous year in spite of stable humidity rate hovering 80%.
Climate variables with correlation impacts between them is analysed in the following figures.
a. Rainfall Upon Population
The figure above explains the Bali Myna suitability with rainfall with its confort joint points recorded in 2009 when the bird tend to increase in number reaching the level between 900 mm to 1500 mm which proves
its vulnerability beyond this figure and as well when rainfall drops below 100 mm while the trend shows an increase defined by the slope of regression model as positive.
b. Temperature Upon Population
Figure 8 Temperature Versus Population
According to the figure figure above, there is a slight increase of temperature of 0,4°C when it cuts the population line as its confort zone between 29°C to 30°C recorded in 2008
and 2015. Also, the trend shows an increase defined by the slope of regression model as positive which determines the maximum temperature of suitability for Bali Myna.
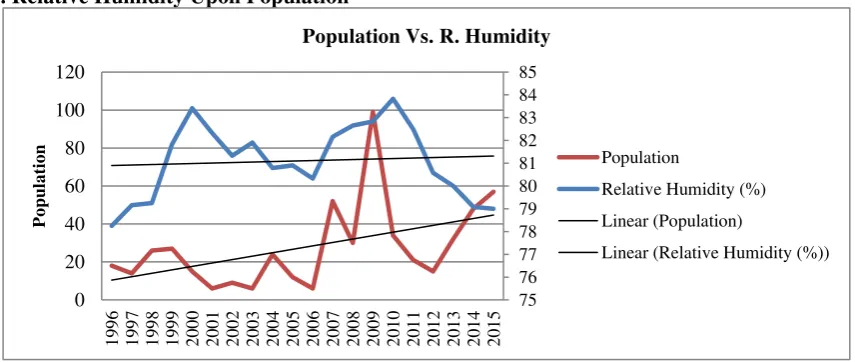
d. Relative Humidity Upon Population
Figure 9 Population Vs. R. Humidity
As far as humidity is concerned as the population of Bali Myna reached its highest number in 2009, its humidity suitability is between 79% to 82%. Also, the trend shows an increase defined by the slope of regression model as positive which determines the
maximum average humidity of suitability for Bali Myna.
Descriptive Statistics
Mean
Std. Deviation N Population 27.5500 2.57496 10 Humidity 81.1070 1.62315 10 Temperature 30.4230 .50626 10 Rainfall 1161.0350 263.58238 10
y = 1.0667x - 2105.1
2004 2006 2008 2010 2012 2014 2016
Correlations
Population Relative Humidity Temperature Rainfall
Population Pearson Correlation 1 .086 -.067 .146
Sig. (2-tailed) .719 .777 .538
N 10 10 10 10
Humidity Pearson Correlation .086 1 -.574** -.185
Sig. (2-tailed) .719 .008 .435
N 10 10 10 10
Temperature Pearson Correlation -.067 -.574** 1 .014
Sig. (2-tailed) .777 .008 .952
N 20 20 20 20
Rainfall Pearson Correlation .146 -.185 .014 1
Sig. (2-tailed) .538 .435 .952
N 10 10 10 10
**. Correlation is significant at the 0.01 level (2-tailed).
Despite the deterioration of habitat, bird abundance showed significant (P = 0.01) trend, with an average of 50.0 (Std. Deviation = 2.58) birds in 2009 and 2015, and species richness showed only a decrease of 4.35% per year (P = 0.08) during those time series.
4. Discussion
With respect to our research, we found that there are dramatic decline trends in the overall number of Bali Myna affecting changes in species richness. Besides, our analyses aimed at a more detailed explanation of relationships between species richness and environmental variables scale (Heikkinen, Luoto, Virkkala, & Rainio 2004).
In this part, it clearly demonstrates how climate change fully impacts habitat of birds since observed ecological changes have shown that biological systems quickly respond in a visible way to climatic changes (McCarty, 2001; Peñuelas & Filella, 2001). Opinions of various biologists with regard to climate change interactions on phenology, distribution of plants and animals, and their physiology differ (Hughes, 2000) though. In fact, ecological effects on bird due to climate change has been successfully proven to be true (Sillet et al., 2000; Both & Visser, 2001; Moss et al., 2001) as its breeding capabilities of each individual bird has been observed within local bird populations and at the continental scale (Sanz, 2002).
Conclusion
Climate change has always been recognized
widespread local extinctions. In this study, we undertook a research trying to analyse the available evidence for the causes of near extinction of Bali Myna from climate change. Our study shows a relationship between limited bird decline to high. Besides, a diverse set of climate variables are implicated, including effects of precipitation, temperature and humidity on the Bali Myna population. We value a sound understanding showing the causes of extinction from climate change that need to be considered as an urgent priority for future research. For example, it is hard to truly imagine effective strategies for species conservation that ignore these proximate causes, and the success of biodiversity conservation is likely to improve. Thus, a further deep study was be carried out to better quantify the effects of more comprehensive variables of climate change and influence ranges of each environmental factor on tropical birds like Bali Myna in West Bali National Park.
References
Araujo & Rahbek 2006. Ecology. How does climate change affect biodiversity? Arthur B. Robinson, Noah E. Robinson, and
Willie Soon, 2007, Environmental Effects of Increased Atmospheric Carbon Dioxide.
Beaumont, L.J., Hughes, L. & Pitman, A.J. 2008. Why is the choice of future climate scenarios for species distribution modelling important? Ecol. Lett.11: 1135–1146.
extinction drivers under global change. Trends Ecol. Evol.23: 453–460. Axel Bronstert, 2003. Floods and Climate
Change: Interactions and Impacts. Carter, Robert M. (2008). "Knock, Knock:
Where is the Evidence for Dangerous Human-Caused Global Warming?" Chris Towsey, MSc(Syd) BSc (Hons) Dip Ed
Fausimm, β010, ‘The Evidence Against Human Causation in Global Warming’.
Colwell, R.K., Brehm, G., Cardelus, C.L., Gilman, A.C. & Longino, J.T. 2008. Global warming, elevational range shifts, and lowland biotic attrition in the wet tropics. Science322: 258–261. Ellycia Harrould-Kolieb, Matthew
Huelsenbeck and Virginia Selz, 2010. Ocean acidification the untold stories. Eric V. Hull. 2014. Ocean Acidification:
Legal and Policy Responses to address climate changes’s evil twin.
Fatchan, HA. 2011. Metode Penelitian Kualitatif. Jenggala Pustaka Utama, Surabaya. Ellycia Harrould-Kolieb, Matthew Huelsenbeck and Virginia Selz, 2010. Ocean acidification the untold stories.
Geraldine Fauville, Jason Hodin, Sam Dupont, Pam Miller, Julie Haws, Michael Thorndyke and David Epel, 2013. Impact of ocean acidification on marine ecosystems: Educational challenges and innovations.
Heikkinen, R.K., Luoto, M., Virkkala, R., Pearson, R.G. & Körber, J.H. 2007. Biotic interactions improve prediction of boreal bird distributions at macro-scales. Global Ecol. Biogeogr. 16: 754–763.
Hughes, L. 2000. Biological consequences of global warming: is the signal already apparent? Trends in Ecology and Evolution, 15: 56-61.
Heller and Zavaleta, 2009. Biodiversity management in the face of climate Projected impacts of climate change on
a continent-wide protected area network. Ecol. Lett.12: 1–12.
IPCC, 2012, 1. Managing the Risks of Extreme Events and Disasters to Advance Climate Change Adaptation. A Special Report of Working Groups I and II of the Intergovernmental Panel on Climate Change.Stott, P.A. et al. 2013.
Janet K. Swim, Susan Clayton, and George S. Howard, 2011, Human Behavioral Contributions to Climate Change. Joseph Santhi Pechsiri, Amir Sattari, Paulina
Garza Martinez1, Liu Xuan3, 2010, A Review of the Climate-Change-Impacts’ Rates of Change in the Arctic.
Law No. 32, 2009 focuses on the protection and management of the environment Law No. 21 of 2014 on Geothermal –
Leech, D., Barimore, C. & Crick, H. (2007) Volunteer boom. BTO News 273: 18– 19.
Mardikanto, T. 2009. Sistem Penyuluhan Pertanian. Sebelas Maret University Press. Surakarta. 2012. Metode Penelitian dan Evaluasi Pemberdayaan Masyarakat untuk Akademisi, Praktisi, dan Peminat Pemberdayaan Masyarakat. Program Studi Penyuluhan
Pembangunan/Pemberdayaan
Masyarakat Pascasarjana UNS. Surakarta.
Peraturan Pemerintah No. 28, 2011, Pengelolaan Kawasan Suaka alam dan Kawasan Pelestarian Alam.
Michael J. Ring, Daniela Lindner, Emily F. Cross, Michael E. Schlesinger, 2012, Causes of the Global Warming Observed since the 19th Century. Plate, E. J. 2002. Flood risk and flood
management. Journal of Hydrology, 267, 2-11.
PP No. 108 Tahun 2015. Pengelolaan Kawasan Suaka Alam
country and currently grounded Main1.html.
Riwidikdo, Handoko. 2009. Statistik Kesehatan. Yogyakarta: Harapan Press.
Sanz M, Franscesco D, John D, Fernandez F. European workshop in periodontal health and cardiovascular disease-scientific evidience on the association between periodontal and cardivascular disease : a review of the literature. European Heart J. Suppl 2010: 12 (suppl B): B3-B12.
Schmidt, F.H. and Ferguson, J.H.A. (1951). Rainfall Types Based on Wet and Dry Period Ratios for Indonesia and Western New Guinea. Verh. Djawatan Mety. Dan Geofisik, Jakarta 42
Sekercioglu, C.H., Schneider, S.H., Fay, J.P. & Loarie, S.R. 2008. Climate change, elevational range shifts, and bird extinctions. Conserv. Biol. 22: 140– 150.
Sodhi, N.S., Sekercioglu, C.H., Barlow, J. & Robinson, S.K. 2011. Conservation of Tropical Birds. Oxford: Wiley Blackwell.
Thomas F. Stocker, Dahe Qin, Gian-Kasper Plattner, Melinda M.B. Tignor, Simon K. Allen, Judith Boschung, Alexander Nauels, Yu Xia, Vincent Bex, and Pauline M. Midgley, 2013. Climate Change: The Physical Science Basis Working Group I Contribution to the Fifth Assessment Report of the Intergovernmental Panel on Climate Change.
Thomas G. Huntington, 2006. Evidence for intensification of the global water cycle: Review and synthesis.
Pertanyaan: Muh Lutfi:
Data mengenai jalak Bali yang Anda sebutkan tinggal 6 ekor. Darimana Anda mendapatkan data tersebut? Sedangkan saat saya kesana Jalak Bali di tangkarkan dan diperjualbelikan secara resmi.