Full Terms & Conditions of access and use can be found at
http://www.tandfonline.com/action/journalInformation?journalCode=vjeb20
Download by: [Universitas Maritim Raja Ali Haji] Date: 11 January 2016, At: 19:08
Journal of Education for Business
ISSN: 0883-2323 (Print) 1940-3356 (Online) Journal homepage: http://www.tandfonline.com/loi/vjeb20
Assessing the Disconnect Between Grade
Expectation and Achievement in a Business
Statistics Course
Mark L. Berenson, Renu Ramnarayanan & Alan Oppenheim
To cite this article: Mark L. Berenson, Renu Ramnarayanan & Alan Oppenheim (2015)
Assessing the Disconnect Between Grade Expectation and Achievement in a Business Statistics Course, Journal of Education for Business, 90:2, 72-80, DOI: 10.1080/08832323.2014.973828 To link to this article: http://dx.doi.org/10.1080/08832323.2014.973828
Published online: 21 Nov 2014.
Submit your article to this journal
Article views: 46
View related articles
Assessing the Disconnect Between Grade
Expectation and Achievement in a Business
Statistics Course
Mark L. Berenson
Montclair State University, Montclair, New Jersey, USA
Renu Ramnarayanan
Seton Hall University, South Orange, New Jersey, USA
Alan Oppenheim
Montclair State University, Montclair, New Jersey, USA
In an institutional review board–approved study aimed at evaluating differences in learning between a large-sized introductory business statistics course section using courseware assisted examinations compared with small-sized sections using traditional paper-and-pencil examinations, there appeared to be a severe disconnect between the final grades students expected to receive and the grades they actually earned. Given that the core-required business statistics course has, for many years, had a reputation among students as being anxiety producing, this disconnect was quite surprising. Using student responses to a survey administered early in the semester, demographic information was available that enabled assessment of this disconnect.
Keywords: academic performance, grades, statistics, student expectations, student satisfaction
More than a century has elapsed since the science fiction writer, journalist, and political commentator H. G. Wells (1903) was attributed to have remarked that understanding statistics would one day be as necessary for efficient citi-zenship as the ability to read and write (Wilks, 1951). Unfortunately, however, the study of statistics in business schools over the past six decades has failed to generate widespread enthusiasm for the discipline and this has pre-cluded the prediction’s realization. Far too frequently, undergraduates interested in other business disciplines approach their core-required statistics course with anxiety and trepidation (Zeidner, 1991), never sensing its value, never appreciating how it can make them better consumers and users of data and information. And it is not uncommon
to hear undergraduates refer to the course as business “sadistics.”
Considering this, should we anticipate a significant dis-parity between students’ expected versus actually achieved course grades in a core-required introductory statistics course? And if so, should we anticipate that such disparity would be the result of students’ overestimation of the grades they would earn in this course rather than underestimation?
Impetus for Present Study
In an institutional research board (IRB)–approved study aimed at assessing differences in learning when offering a large-sized introductory business statistics course section using courseware-assisted examinations compared with small-sized sections using traditional paper-and-pencil examinations, there appeared to be a severe disconnect between the final grades students expected to receive and
Correspondence should be addressed to Renu Ramnarayanan, Seton Hall University, 400 South Orange Avenue, South Orange, NJ 07079, USA. E-mail: [email protected]
ISSN: 0883-2323 print / 1940-3356 online DOI: 10.1080/08832323.2014.973828
the grades they actually earned. This disconnect was quite surprising, given that the core-required business statistics course has, for many years, had a reputation among stu-dents as being anxiety producing.
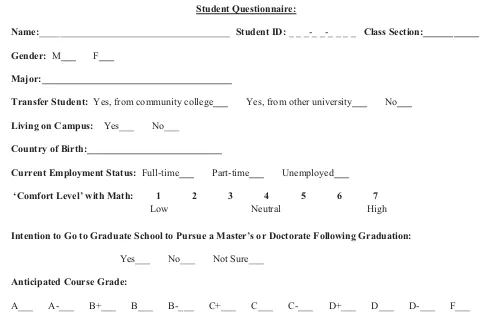
Questions to be addressed here are whether the observed disconnect between expected versus actual course grades is significant and, if so, what might be the determinants of this disconnect? Student responses to a survey administered early in the semester as part of the aforementioned study provided demographic information that enabled such inves-tigation. Figure 1 contains the extracted questions from the survey that pertain to this present study.
Understanding the Students’ Survey Responses
It was observed from responses to the final survey question in Figure 1 that all students reported that they expected their performance to be at a high level (i.e., that they would earn at least a grade of B in their core-required business sta-tistics course).
Unfortunately, it cannot be determined whether the students’ responses to such a question on course grade expectation are truly honest. Perhaps they exemplify what Bandudra (1997) defined as self-efficacy: a belief in an
individual’s own capabilities to produce the desired outcomes.
Several other reasons, however, are also possible. Per-haps some students, part of the present “me generation,” lie to themselves by providing exaggerated grade expectations while other students, aware that their instructor will be reading their nonanonymous responses, perhaps lie to please the teacher (i.e., the halo effect) or perhaps intend to work more diligently (i.e., the Hawthorne effect), motivated by responding to the questionnaire (i.e., expectancy theory). And perhaps still other students may consciously exagger-ate their expectations because they perceive that in the busi-ness world one must show confidence to be successful.
Such supposition on why students may respond to the grade question as they do must be the subject of future research by colleague practitioners in various fields of psy-chology. What is more germane here, however, is assessing the magnitude of the observed disconnect and, if signifi-cant, exploring the potential ramifications that this may have.
Potential Impact of a Grade Disconnect
If initial grade expectations (Vroom, 1964) are not realized through actual course performance, cognitive dissonance
Student Questionnaire:
Name:______________________________________ Student ID:_ _ _-_ _-_ _ _ _ Class Section:___________
Gender: M___ F___
Major:______________________________________
Transfer Student: Yes, from community college___ Yes, from other university___ No___
Living on Campus: Yes___ No___
Country of Birth:___________________________
Current Employment Status: Full-time___ Part-time___ Unemployed___
‘Comfort Level’ with Math: 1 2 3 4 5 6 7
Low Neutral High
Intention to Go to Graduate School to Pursue a Master’s or Doctorate Following Graduation:
Yes___ No___ Not Sure___
Anticipated Course Grade:
A___ A-___ B+___ B___ B-___ C+___ C___ C-___ D+___ D___ D-___ F___
FIGURE 1. Questions extracted from survey used for developing a student profile.
DISCONNECT BETWEEN GRADE EXPECTATION AND ACHIEVEMENT 73
(Festinger, 1957; Festinger & Carlsmith, 1959) would likely set in, and students may try to search for reasons to rationalize this disconnect in order to reduce their disso-nance. Toward that end, with respect to their business sta-tistics course in particular, they may attribute their poor performance to inadequate instruction, or they may charac-terize the course as useless or a necessary evil. By word of mouth, course negativity could be passed down to the next class of enrollees, creating an overall anxiety and fear of taking this core-required course and perpetuating its poor image and bad reputation.
A question that naturally arises is whether there are greater levels of disconnect and potentially more disso-nance to overcome among some unpopular core-required courses such as business statistics than others. An assess-ment of whether the level of disconnect between expected and actual grade differs significantly among different types of core-required courses must become the subject of needed future research because if the disconnect correlates with course enjoyment and satisfaction it can impact on student evaluations of faculty and the latter are widely used in reap-pointment, tenure, promotion, salary adjustment, and sab-batical decisions.
LITERATURE REVIEW
A review of the literature on grade expectation surprisingly indicates that the results observed in this study are not sur-prising but rather a confirmation of findings obtained in sev-eral other research endeavors across various disciplines— there is an apparent disconnect between students’ expected versus actual grades. A study by Landrum (1999) speculated that grading practices and grade inflation in secondary schools might be cause for an expectation among college students that attendance and effort should be sufficient to earn a good grade and several studies have shown that stu-dents overpredict their grades at the beginning of the semes-ter or quarsemes-ter, and that they also overestimate their abilities and the amount of time and effort they can devote to a class (Andrews, Swanson, & Kugler, 2007; Cann, 2005; Gaultney & Cann, 2001; Khachikian & Guillaume, 2002, 2011; Kha-chikian, Guillaume, & Pham, 2011; Perlman & McCann, 2007; Prohaska, 1994; Wendorf, 2002). Moreover, McCann, Immel, Kadah-Ammeter, and Priniski (2013) recently found that university students expected to receive high grades in lower level (i.e., core-required) courses. And a study con-ducted nearly 40 years ago indicated that the majority of students overestimated their initial course grade by an aver-age of one letter grade and that men predicted higher grades for themselves than did women (Cole & King, 1977). This latter finding perhaps goes somewhat counter to the argu-ment that today’s generation of students displays more self-interest and narcissism, has higher expectations, and feels more entitled (Twenge, 2009).
DEVELOPING THE PRESENT STUDY
The aforementioned studies on grade disconnect were pri-marily exploratory and descriptive; the present study takes a confirmatory approach by employing appropriate inferen-tial methodology to investigate both the magnitude of this disconnect and its potential determinants.
Objectives of Present Study
The objectives of the present study then were threefold:
To determine whether there is evidence of an overall real difference between expected and actual grades of students taking the core-required introductory busi-ness statistics course,
To determine whether there is evidence of a real dif-ference between expected and actual grades between the two major groupings from the initial IRB-approved study—students in large class sections with courseware assisted examinations versus students in small class sections with traditional paper-and-pencil examinations, and
To explore possible differences in grade expectancy versus reality based on student responses to a survey (see Figure 1) containing a variety of demographic variables
METHOD
Study Sample
The initial group of subjects in the original IRB-approved study consisted of students in four specific sections of the required undergraduate business statistics course. Only stu-dents who provided written consent to participate in that study, finished the course with an earned grade of A–F, and completed an in-class survey early in the semester were part of the set of analyses for this study. This resulted in 128 participants.
Participants
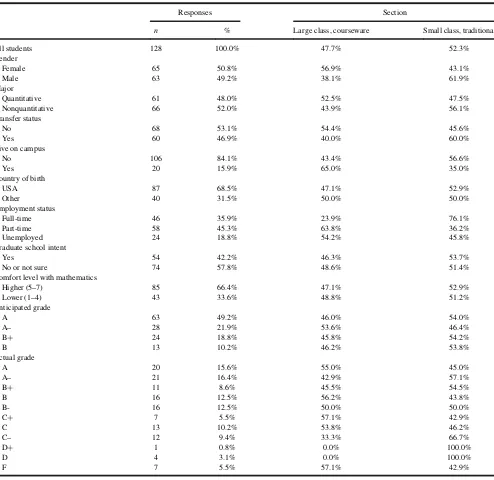
The most typical student characteristics indicated a U.S.-born (68.5%) woman (50.8%), majoring in a nonquan-titative subject (52.0%), who started college at this univer-sity (53.1%) but lived off campus (84.1%), and was working part-time (45.3%). The typical student was com-fortable with mathematics (66.4%), was not sure or not planning on attending graduate school (57.8%), and expected an A-level grade (71.1%) in the course. Table 1 is a supertable (Tufte, 1983) displaying this profile between the two major groupings from the initial study—students in large class sections with courseware assisted examinations versus students in small class sections with traditional
paper-and-pencil examinations. Also included in Table 1 is the distribution of actual course grades.
This overall profile, reflecting the modal response for each of the eight characteristics, may not be the same as the most typical joint response to all eight questions. Given that the sample contained only 128 study participants and the joint responses to all eight questions form a multidimen-sional table of 1,920 cells (i.e., seven questions categorized into two possible responses, one question on employment status with three possible responses, and the anticipated
grade question with five possible grade level responses ignoring pluses and minuses), the sparseness of such data preclude any reasonable descriptive drill down.
RESULTS: COMPARING ANTICIPATED VERSUS ACTUAL COURSE GRADES
Table 2 is a cross-tabulation of grades that students expected, or were striving for, as reported in their survey
TABLE 1
Characteristics of 128 Students in Two Types of Course Sections Along With the Distribution of Actual Course Grades
Responses Section
n % Large class, courseware Small class, traditional All students 128 100.0% 47.7% 52.3% Gender
Female 65 50.8% 56.9% 43.1%
Male 63 49.2% 38.1% 61.9%
Major
Quantitative 61 48.0% 52.5% 47.5%
Nonquantitative 66 52.0% 43.9% 56.1% Transfer status
No 68 53.1% 54.4% 45.6%
Yes 60 46.9% 40.0% 60.0%
Live on campus
No 106 84.1% 43.4% 56.6%
Yes 20 15.9% 65.0% 35.0%
Country of birth
USA 87 68.5% 47.1% 52.9%
Other 40 31.5% 50.0% 50.0%
Employment status
Full-time 46 35.9% 23.9% 76.1%
Part-time 58 45.3% 63.8% 36.2%
Unemployed 24 18.8% 54.2% 45.8%
Graduate school intent
Yes 54 42.2% 46.3% 53.7%
No or not sure 74 57.8% 48.6% 51.4% Comfort level with mathematics
Higher (5–7) 85 66.4% 47.1% 52.9%
Lower (1–4) 43 33.6% 48.8% 51.2%
Anticipated grade
A 63 49.2% 46.0% 54.0%
A– 28 21.9% 53.6% 46.4%
BC 24 18.8% 45.8% 54.2%
B 13 10.2% 46.2% 53.8%
Actual grade
A 20 15.6% 55.0% 45.0%
A– 21 16.4% 42.9% 57.1%
BC 11 8.6% 45.5% 54.5%
B 16 12.5% 56.2% 43.8%
B- 16 12.5% 50.0% 50.0%
CC 7 5.5% 57.1% 42.9%
C 13 10.2% 53.8% 46.2%
C– 12 9.4% 33.3% 66.7%
DC 1 0.8% 0.0% 100.0%
D 4 3.1% 0.0% 100.0%
F 7 5.5% 57.1% 42.9%
Note:One student was undecided with respect to major, two students did not respond about living on campus, and one student did not respond about coun-try of origin.
DISCONNECT BETWEEN GRADE EXPECTATION AND ACHIEVEMENT 75
questionnaire matched against the actual grades received. It is interesting, if not ironic, to note that 71.1% of the stu-dents anticipated a grade level of A or A- but no stustu-dents expected a grade lower than B in this core-required busi-ness school course known to be anxiety producing. In actu-ality, 32.0% A-level grades were given, 33.6% B-level grades were given, 25.1% C-level grades were given, 3.9% D-level grades were given, and 5.5% F grades were given. Only 24 students of 128 (18.8%) correctly predicted their grades. Overwhelmingly, students thought they would get better grades than they actually did—perhaps resulting in them leaving the course with much disappointment. Only 12 students out of 128 (i.e., 9.4%) received a higher grade than anticipated while 92 students out of 128 (i.e., 71.9%) received a lower grade than anticipated. That is, for each student who received a higher grade than expected, 7.67 times as many students received a lower grade than expected.
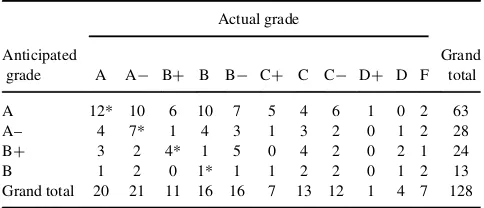
For purposes of symmetry in the category groupings needed for further comparative analysis, the columns of Table 2 are collapsed to match the anticipated grade rows and the 4£4 square matrix based on the grades A, A¡, BC, and B or below are presented in Table 3.
Using these four groupings, the Bowker test for symme-try of response (Bowker, 1948) showed a severe disconnect between perception and reality (B!x2a;c.c¡1/=2;aD 0:05 andcD4;BD61:90>x20:05;6D12:592; p D .000). A description of the Bowker test is provided in the Appendix (Koppel & Berenson, 2007).
Using a McNemar-type a posteriori comparison procedure (Stuart, 1955), there were obvious significant disconnects with respect to expected and actual grade at each grade level displayed in the cross-classifications shown in Tables 4–6. At each grade level, students significantly overestimated the grades they actually earned. These results are highlighted in Table 7. Stuart’s a posteriori comparison procedure is described in the Appendix.
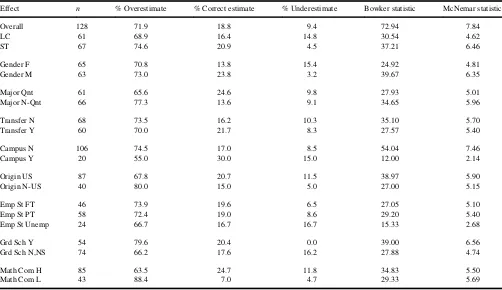
Based on Tables 2 and 3, Table 8 displays a summary of cross-classifications of anticipated versus actual grades for the overall study, for the two key groupings of students (large class, courseware-assisted exams; small class, tradi-tional paper-and-pencil exams), and for the breakout group-ings of eight demographic characteristics shown in Table 1. The Bowker and McNemar test statistics (see the Appendix for a description of the McNemar test) are provided for each of the 20 cross-classifications.
TABLE 2
Cross-Classification of Anticipated and Actual Student Grades
Actual grade
Note: *indicates students that correctly predicted their grades.
TABLE 4
Cross-Classification of A Versus Not A Grades, Anticipated and Actual
Actual grade
Anticipated grade A Not A Grand total %
A 12 51 63 49.2
Not A 8 57 65 50.8 Grand total 20 108 128
% 15.6 84.4 100.0
TABLE 5
Cross-Classification of A or A- Versus BCor Below Grades, Anticipated and Actual
Actual grade
Anticipated grade A or A– Not A or A– Grand total % A or A– 33 58 91 71.1 Not A or A– 8 29 37 28.9 Grand total 41 87 128
% 32.0 68.0 100.0
TABLE 3
Cross-Classification Table Used for Bowker Test of Symmetry
Actual grade
Anticipated grade A A– BC B Grand total A 12* 10 6 35 63
A– 4 7* 1 16 28
BC 3 2 4* 15 24
B 1 2 0 10* 13
Grand total 20 21 11 76 128
Note: *indicates students that correctly predicted their grades.
TABLE 6
Cross-Classification of BCor Better Versus B or Below Grades, Anticipated and Actual
Actual grade
Anticipated grade A, A–, BC <BC Grand total % A, A–, BC 49 66 115 89.8
<BC 3 10 13 10.2
Grand total 52 76 128
% 40.6 59.4 100.0
Note that for each breakout grouping, McNemar’s test statistic is simply based on a comparison of all overesti-mated responses to all underestioveresti-mated responses obtained from Table 2. Bowker’s test statistic, however, is more sophisticated in that it is based on how much overestima-tion or how much underestimaoverestima-tion there is. For the various breakout groupings, Bowker’s test statistic is developed from data extracted from Table 3.
For every breakout grouping, the McNemar test indi-cates a significant overestimation of actual course perfor-mance when compared to underestimation of course performance while the Bowker test concurs in 19 of the 20 situations, failing to find a real effect at the .05 level of sig-nificance only in the smallest data set (i.e., 20 student observations) owing to the sparseness of responses.
Given that it has been determined that students taking an introductory business statistics course significantly overes-timated how well they will perform—regardless of the key student groupings or the breakout groupings of gender, major, transfer status, campus residence, country of birth, employment status, graduate school intention, and stated comfort level with mathematics—two additional questions needed to be addressed:
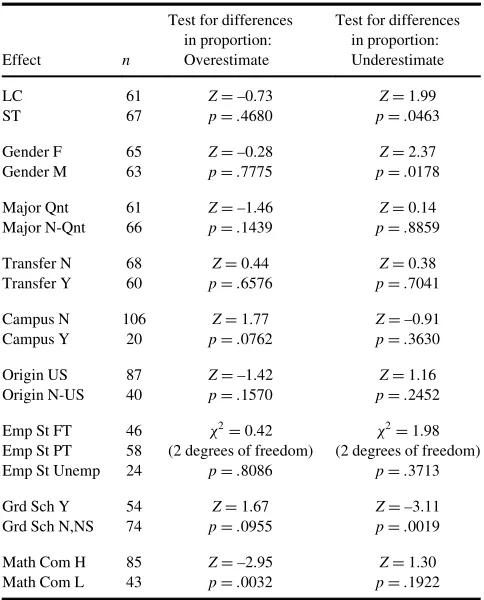
Is there evidence of a significant difference in the pro-portions of overestimation between the categorical breakout groupings of each of the aforementioned characteristics?
Is there evidence of a significant difference in the pro-portions of underestimation between the categorical
TABLE 8
A Summary of Cross-Classifications of Anticipated vs. Actual Grades for the Overall Study, for the Two Key Groupings of Students, and for Eight Demographic Characteristics
Effect n % Overestimate % Correct estimate % Underestimate Bowker statistic McNemar statistic Overall 128 71.9 18.8 9.4 72.94 7.84
LC 61 68.9 16.4 14.8 30.54 4.62
ST 67 74.6 20.9 4.5 37.21 6.46
Gender F 65 70.8 13.8 15.4 24.92 4.81 Gender M 63 73.0 23.8 3.2 39.67 6.35 Major Qnt 61 65.6 24.6 9.8 27.93 5.01 Major N-Qnt 66 77.3 13.6 9.1 34.65 5.96 Transfer N 68 73.5 16.2 10.3 35.10 5.70 Transfer Y 60 70.0 21.7 8.3 27.57 5.40 Campus N 106 74.5 17.0 8.5 54.04 7.46 Campus Y 20 55.0 30.0 15.0 12.00 2.14 Origin US 87 67.8 20.7 11.5 38.97 5.90 Origin N-US 40 80.0 15.0 5.0 27.00 5.15 Emp St FT 46 73.9 19.6 6.5 27.05 5.10 Emp St PT 58 72.4 19.0 8.6 29.20 5.40 Emp St Unemp 24 66.7 16.7 16.7 15.33 2.68 Grd Sch Y 54 79.6 20.4 0.0 39.00 6.56 Grd Sch N,NS 74 66.2 17.6 16.2 27.88 4.74 Math Com H 85 63.5 24.7 11.8 34.83 5.50 Math Com L 43 88.4 7.0 4.7 29.33 5.69
Note:First, using anaD.05 level of significance, the critical value of the Bowker test statistic withcD6 degrees of freedom is 12.592. Only one of the 20
Bowker tests (students living on campus) failed to display evidence of a real grade disconnect at theaD0.05 level of significance. The sample size was only
20 students. Second, using anaD.05 level of significance, the critical value of the McNemar test statistic is§1.96. Each of the 20 McNemar tests displayed
evidence of a real grade disconnect at theaD.05 level of significance.
TABLE 7
Results of A Posteriori Pairwise Comparisons Between Anticipated and Actual Grades at Various Grade Levels Displayed in Tables 4–6
Grade comparison: Anticipated versus actual jp^:i¡p^i:j Critical range Decision rule
A: Not A 0.336 0.146 Significant comparison A or A–: BCor Below 0.391 0.149 Significant comparison BCor Better: B or Below 0.492 0.135 Significant comparison DISCONNECT BETWEEN GRADE EXPECTATION AND ACHIEVEMENT 77
breakout groupings of each of the aforementioned characteristics?
Using either theZtest for differences in two independent proportions or the chi-square test for differences inc inde-pendent proportions (see the Appendix for descriptions), the results are displayed in Table 9 for comparisons between the two key groupings of students in the initial study as well as between the breakout groupings of the vari-ous demographic characteristics.
Although both key student groupings from the initial study significantly overestimated course performance when compared to underestimating course performance, there was no evidence of any real difference in the proportions of overestimation between the two groupings. Moreover, among the eight demographic characteristics, the only sig-nificant difference observed in overestimation was between students who had initially indicated a low comfort level with mathematics versus those who had initially indicated a high comfort level with mathematics. That is, students with admittedly weaker levels of self-confidence in mathematics tended to significantly overestimate their course perfor-mance more than did students who felt stronger about their self-confidence in mathematics.
Furthermore, although both groupings significantly over-estimated their performance, it is interesting to note that, for the two key groupings of students in the initial study, stu-dents in the large class section using courseware-assisted examinations significantly underestimated how well they would perform in the course when compared to students in small class sections using traditional paper-and-pencil examinations.
In addition, among the eight demographic characteris-tics, only two significant differences were observed in com-paring proportions of underestimation. First, there was a gender effect noted. Although male and female groups sig-nificantly overestimated their performance, when compar-ing the proportions of underestimation between the two gender groupings it was found that female students signifi-cantly underestimated how well they would perform in the course when compared to the male students. Second, although both groups significantly overestimated their per-formance, when comparing the proportion of underestima-tion between students not planning or unsure of attending graduate school versus students intending to pursue gradu-ate studies, it was found that the former group significantly underestimated how well they would perform in the course when compared to peers who intended to pursue graduate studies.
DISCUSSION AND CONCLUSIONS
For decades it has been known that the basic core-required undergraduate course in statistics has suffered a bad reputa-tion and yet in this study a severe disconnect was observed between students’ expected and actual grades—overall, for each student who received a higher grade than expected, 7.67 times as many students received a lower grade than expected.
Many students may start the course perceiving them-selves as competent and holding the hope of getting a high grade but when that does not happen, they may experience cognitive dissonance, which they will try to reduce (Fes-tinger, 1957; Festinger & Carlsmith, 1959). Perhaps in an attempt to reduce this dissonance, students may seek to find an external attribution for the cause of their poor perfor-mance such as blaming the quality of instruction and/or diminishing the usefulness and relevance of the subject material, thus perpetuating a cycle of dislike for the valu-able discipline of statistics.
FUTURE RESEARCH AND ITS IMPLICATIONS
A natural question to ask is whether such severity of dis-connect as observed herein would apply to other core-required courses. If a course effect exists, an index number could be developed for each course based on the chi-square
TABLE 9
A Summary of Results Comparing Both Differences in Proportion of Grade Overestimation and in Proportion of Grade Underestimation
for Two Key Groupings of Students and Between Categories of Eight Demographic Characteristics Emp St PT 58 (2 degrees of freedom) (2 degrees of freedom) Emp St Unemp 24 pD.8086 pD.3713 Grd Sch Y 54 ZD1.67 ZD–3.11 Grd Sch N,NS 74 pD.0955 pD.0019 Math Com H 85 ZD–2.95 ZD1.30 Math Com L 43 pD.0032 pD.1922
statistic obtained from the Bowker test, the Z statistic obtained from the McNemar test, or from the ratio of lower grades than expected to higher grades than expected. With appropriate controls for course sample sizes, this index number could rank-order the magnitude of disconnect across all core-required courses. Perhaps the less severe the grade disconnect, the more satisfied students will be with a particular course. This is a subject for further research.
If it is true that severity of grade disconnect among core-required courses is correlated with course enjoyment and satisfaction, one could surmise that the ratings provided in student course and faculty evaluations performed near the end of a semester may be seriously affected. A student who expected a particular grade very early in the semester or quarter should have a more realistic assessment of his or her likely final grade immediately before the final exam (i.e., the time period in which the course and faculty evalua-tions are obtained). Because university administrators use student-faculty evaluations as part of the process for reap-pointment, tenure, promotion, salary adjustment, and sab-batical leave, if students’ present grade expectations deviate substantially from their initial expectations it could be surmised that the ratings of the instructor and the ratings of the course might suffer, putting instructors who teach such core-required courses at a disadvantage when com-pared to colleagues teaching more popular core-required courses.
If, in fact, some core-required courses are deemed by students to be more enjoyable and satisfying while others are disliked, a per-course index number can be used to adjust the student ratings, providing administrators making the aforementioned personnel decisions with more useful information.
ACKNOWLEDGMENTS
The authors wish to thank Geet Shah and Pooja Waghresha, two graduate assistants who also completed the CITI Col-laborative Institutional Training Initiative and, acting as a “third party,” assisted in the data collection, entry, and file maintenance phases of this Institutional Review Board approved protocol (IRB Number 001257). The authors also wish to thank Julie R. Dalley, Assistant Director, Research Academy for University Learning at Montclair State University, for insights pertaining to grade expectations.
FUNDING
The development of the study resulting in this paper was supported in part through the Khubani/Telebrands Faculty Research Fellowship awarded to Mark Berenson in the School of Business at Montclair State University.
RFERENCES
Andrews, K., Swanson, J., & Kugler, P. (2007). Grade expectations. Jour-nal of Economics and Economic Education Research,8, 3–18. Bandura, A. (1997).Self-efficacy: The exercise of control. New York, NY:
W. H. Freeman.
Bowker, A. H. (1948). A test for symmetry in contingency tables.Journal of the American Statistical Association,43, 572–574.
Cann, A. (2005). Predicting course grades: accurate for others but biased for self.Teaching of Psychology,32, 242–244.
Cherry, B., Ordonez, L. D., & Gilliland, S. W. (2003). Grade expectations: the effects of expectations on fairness and satisfaction perceptions. Jour-nal of Behavioral Decision Making,16, 375–395.
Cole, D., & King, K. (1977). Grade expectations as a function of sex, aca-demic discipline, and sex of instructor.Psychology of Women Quarterly,
1, 380–385.
Festinger, L. (1957).A theory of cognitive dissonance. Evanston, IL: Row & Peterson.
Festinger, L., & Carlsmith, J. M. (1959). Cognitive consequence of forced compliance.Journal of Abnormal and Social Psychology,58, 203–210. Gaultney, J .F., & Cann, A. (2001). Grade expectations.Teaching of
Psy-chology,28, 84–87.
Khachikian, C. S., & Guillaume, D. W. (2002, June).Attitudes versus per-formance in the engineering classroom. Paper presented at the American Society for Engineering Education Annual Conference, Montreal, Canada.
Khachikian, C. S., & Guillaume, D. W. (2011). The effect of time-on-task on student grades and grade expectations.Assessment & Evaluation in Higher Education,36, 251–261.
Khachikian, C. S., Guillaume, D. W., & Pham, T. K. (2011). Changes in student effort and grade expectation in the course of a term.European Journal of Engineering Education,36, 595–605.
Koppel, N., & Berenson, M. L. (2007). Bowker procedure. In N. J. Salkind (Ed.),Encyclopedia of measurement and statistics, volume I(pp. 107– 111). Thousand Oaks, CA: Sage.
Landrum, R. E. (1999). Student expectations of grade inflation.Journal of Research and Development in Education,32, 124–128.
Marascuilo, L. A., & McSweeney, M. (1977).Nonparametric and distribu-tion-free methods for the social sciences. Monterey, CA: Brooks-Cole. McCann, L. I., Immel, K. R., Kadah-Ammeter, T. L., & Priniski, S. J.
(2013). Student grade expectations at technical college, 2-, and 4-year institutions.Teaching of Psychology,40, 228–232.
Perlman, B., & McCann, L. I. (2007, January). Students’ desired grades and behaviors to earn such grades. Poster presented at the Annual Meeting of the National Institute on the Teaching of Psy-chology, St. Petersburg, FL.
Prohaska, V. (1994). “I know I’ll get an A”: Confident overestimation of final course grades.Teaching of Psychology,21, 141–143.
Stuart, A. (1955). A test of homogeneity of the marginal distributions in a two-way classification.Biometrika,42, 412–416.
Tufte, E. R. (1983).The visual display of quantitative information. Chesh-ire, CT: Graphics Press.
Twenge, J. M. (2009). Generational changes and their impact in the class-room: Teaching Generation Me.Medical Education,43, 398–405. Vroom, V. H. (1964).Work and motivation. San Francisco, CA:
Jossey-Bass.
Wells, H. G. (1903).Mankind in the making. New York, NY: Charles Scribner’s Sons.
Wendorf, C. A. (2002). Grade point average and changes in (great) grade expectations.Teaching of Psychology,29, 136–138.
Wilks, S. S. (1951). Presidential address to the American Statistical Asso-ciation,Journal of the American Statistical Association,46, 1–18. Zeidner, M. (1991). Statistics and mathematics anxiety in social science
students: Some interesting parallels.British Journal of Educational Psy-chology,61, 319–328.
DISCONNECT BETWEEN GRADE EXPECTATION AND ACHIEVEMENT 79
APPENDIX: STATISTICAL TEST PROCEDURES USED
Bowker Test and Decision Rule
Given ac-by-ccross-classification table (where the number of rowsrequals the number of columnsc) containing the tallies from a sample ofn0 individuals. Letxij represent a tally of initial responsesi and follow-up responsesj(such as anticipated gradeiand actual grade j). The null hypothe-sis of symmetry to be tested is conditioned on those nDP
8i6¼jxijindividuals whose responses change and the probability of a switch from responseito responsejis equal to the probability of a switch from responsejto responsei, and this probability is 0.5. Therefore, interest is in compari-sons of tallies (and marginal totals) below the main diago-nal of thec-by-ccontingency table with the corresponding tallies (and marginal totals) above the main diagonal. The n0 – n individuals with tallies along the main diagonal
whose responses do not change (i.e., correctly anticipating the actual grade) are discarded. The null hypothesis of sym-metry in the responses among c categories of a c-by-c
cross-classification is rejected if the Bowker test statistic
BDPr
critical value from the chi-square distribution with c.c¡1Þ=2 degrees of freedom at a chosen level of signifi-cancea.
Stuart A Posteriori Comparisons and Decision Rule
For a family of c a posteriori comparisons, using an experiment-wise error rate a, declare that a significant difference exists in the column classification i and the corresponding row classification i if the absolute difference in the two sample proportions exceeds its critical range, that is, jp^:i¡p^i:j> ffiffiffiffiffiffiffiffiffiffiffiffiffiffiffiffiffiffiffiffiffix2
1¡a;ðc¡1Þ i0is the complement ofi, the combined responses from all
c– 1 other classifications, andn0is the actual sample size
in the study (not the n individuals whose responses were evaluated in the Bowker test).
McNemar Test and Decision Rule
Given a 2-by-2 cross-classification table containing the tal-lies from a sample ofn0individuals. Letxijrepresent a tally of initial responses i and follow-up responses j (such as anticipated gradeiand actual gradej). The null hypothesis of symmetry (or equality of paired population proportions) to be tested is conditioned on thosenDP
8i6¼jxij individu-als whose responses change and the probability of a switch from response i to response j is equal to the probability of a switch from response j to response i, and this probability is 0.5. Therefore, interest is in the comparison of the tallyx21(and marginal totalx1.) below
the main diagonal of the 2-by-2 contingency table with the corresponding tallyx12 (and marginal totalx1.) above the
main diagonal. Then0–nindividuals with tallies along the
main diagonal whose responses do not change (i.e., cor-rectly anticipating the actual grade) are discarded. The null hypothesis is rejected if the McNemar test statistic MD .x12¡x21/
ffiffiffiffiffiffiffiffiffiffiffiffiffiffiffi .x12Cx21/
p >Z1¡a=2or ifM<Za=2;whereZ1¡a=2and
Za=2are the respective upper tail and lower tail critical val-ues from the standardized normal distribution at a chosen level of significance,a(Marascuilo & McSweeney, 1977).
Test for Equality of Proportions: Two Independent Populations and Decision Rule
This test procedure is found in all introductory business sta-tistics textbooks. Reject the null hypothesis of equal propor-tions in two independent populapropor-tions if the test statistic ZSTAT>Z1¡a=2 or ifZSTAT<Za=2;where Z1¡a=2 andZa=2 are the respective upper tail and lower tail critical values from the standardized normal distribution at a chosen level of significancea.
Test for Equality of Proportions:cIndependent
Populations and Decision Rule
This test procedure is found in almost all introductory busi-ness statistics textbooks. Reject the null hypothesis of equal proportions incindependent populations if the test statistic x2STAT>x21¡a;.c¡1/; the upper tail critical value from the chi-square distribution with.c¡1/degrees of freedom at a chosen level of significancea.