ISSN: 1693-6930
accredited by DGHE (DIKTI), Decree No: 51/Dikti/Kep/2010 547
Coffee Bean Grade Determination Based on Image
Parameter
Faridah*1, Gea O. F. Parikesit2, Ferdiansjah3
Department of Physic Engineering, Faculty of Engineering, Universitas Gadjah Mada Jalan Grafika 2 Yogyakarta, Indonesia
e-mail: [email protected], [email protected], [email protected]
Abstrak
Standar mutu komoditas biji kopi di Indonesia menggunakan sistem nilai cacat yang diatur dalam Standar Nasional Indonesia (SNI) biji kopi, No:01-2907-1999. Pada sistem nilai cacat dikenal kopi dengan mutu I sampai VI tergantung dari banyaknya cacat yang terdapat pada sampel kopi. Keakuratan metode ini sangat didasarkan pada ketrampilan dan pengalaman penguji. Tujuan dari penelitian ini adalah mengembangkan sistem untuk menentukan mutu biji kopi sesuai dengan SNI No:01-2907-1999. Sebuah sensor visual, yang terdiri dari sebuah kamera yang terhubung dengan komputer, digunakan untuk menangkap citra sampel biji kopi yang diletakkan pada kotak hitam dengan kuat penerangan yang merata, yaitu 414,5 ± 2,9 lux. Komputer akan melakukan ekstraksi data parameter citra sampel biji kopi dalam bentuk tekstur (energi, entropi, kontras, homogenitas) dan warna (R mean, G mean, dan B mean) dan menentukan mutu biji kopi berdasarkan parameter citra dengan menerapkan algoritma jaringan syaraf tiruan. Hasil pengujian akurasi sistem untuk pengenalan mutu (grade) biji kopi sebesar 100, 80, 60, 40, 100, 40, dan 100% berturut-turut untuk masing-masing mutu kopi I, II, III, IVA, IVB, V, dan VI.
Kata kunci: jaringan syaraf tiruan, mutu biji kopi, sensor visual, warna, tekstur
Abstract
Quality standard for coffee as an agriculture commodity in Indonesia uses defect system which is regulated in Standar Nasional Indonesia (SNI) for coffee bean, No: 01-2907-1999. In the Defect System standard, coffee bean is classified into six grades, from grade I to grade VI depending on the number of defect found in the coffee bean. Accuracy of this method heavily depends on the experience and the expertise of the human operators. The objective of the research is to develop a system to determine the coffee bean grading based on SNI No: 01-2907-1999. A visual sensor, a webcam connected to a computer, was used for image acquisition of coffee bean image samples, which were placed under uniform illumination of 414.5+2.9 lux. The computer performs feature extraction from parameters of coffee bean image samples in the term of texture (energy, entropy, contrast, homogeneity) and color (R mean, G mean, and B mean) and determines the grade of coffee bean based on the image parameters by implementing neural network algorithm. The accuracy of system testing for the coffee beans of grade I, II, III, IVA, IVB, V, and VI have the value of 100, 80, 60, 40, 100, 40, and 100%, respectively.
Keywords: artificial neural network, coffee bean grading, color, texture, visual sensor
1. Introduction
Coffee plantation is one of the main agriculture activities on which many tropical and subtropical countries rely on to earn foreign exchange. Coffee is the second most important product in international commerce on the basis of volume traded, and it is estimated to the first on the basis of value [1], [2]. The price of coffee bean depends on its quality, which has direct correlation with the taste of its final product.
implementing SNI has the purpose to make quality assurance in coffee bean industry more in line with quality standard in many countries where the product will be exported [3]. In the Defect System standard, coffee bean is classified into six grades, from grade I to grade VI depending on the number of defect found in the coffee bean. Accuracy of this method heavily depends on the experience and the expertise of the human operators.
Computer vision is the science that develops the theoretical and algorithmic basis by which useful information can be automatically extracted and analyzed from an observed image using computation made by computers [4]. The application of the computer vision to carry out task for quality inspection, sorting, and automatic processes in agricultural industry is increasing due to advantages such as economy, accuracy, and objectivity in term of their ability to provide numerical data with features such as size, shape, color, and texture [5]. However, these features are not represented by a unique mathematical function for many agricultural products. The natural variability of these products makes the task of identification and classification extremely challenging and computationally intensive because of the need to have a large number of classification features [6], [7]. The implementation of artificial neural network as automation decision algorithm in computer vision has evident advantage in classification process. The development of computer vision in classification of agriculture products by using artificial neural network could be found in several researches [8]-[12].
Although research on computer vision has progressed well in recent years, the usage of computer vision in the automation process for coffee bean quality determination is still on the development. Soedibyo [12] has developed the automatic coffee sorting system based on image procesing and artificial neural network. Images of the green coffee are analyzed to get six quality parameters which match the green coffee quality criteria namely length, area, perimeter, defect area, and index of green color. Carillo [13] has studied the possibility of classifying coffee beans by using their features such as color, shape, and size. These features provide information about the physical alteration in green coffee beans by developing a computer program to sort coffee beans according to their type. In the case, color images are analyzed in RGB space. The locations were then used for an algorithm for identifying and setting contour ellipse, an algorithm Mahalanobis distance classifier, an algorithm called Flood of Growth, for segmentation of those defective beans. In Soedibyo and Carillo research, coffee bean quality was characterized by the characteristic of individual coffee bean.
This research is aimed to develop a computer vision system that could be used to determine coffee bean quality based on a population of coffee beans instead of single coffee been sample. The coffee bean classification standard is provided by SNI No. 01-2907-1999. This method is developed due to the irregularities on surface made by color, shape, and size of coffee bean sample which is related to its defect number, the reflection of light affects the appearance of color and texture on the coffee bean sample surface. As the result, the quality of coffee bean could be characterized by the color and texture parameters of the whole population. Back-propagation neural network algoritm will be implemented to enhance the recognation rate for automatic coffee bean grade determination. In the end of the research, it is expected that a kind of quantitative detector could be produced to determine the grade of coffee bean that could produce quick and accurate result.
2. Research Method
Block diagram of the system under consideration could be shown on Figure 1. Coffee bean sample is placed in black box with uniform illumination. Image from coffee bean sample is then captured using digital camera and the data will be processed by software to produce information about quality or coffee bean grade. The result of the detection from sample will be displayed on monitor.
2.1. Data Acquisition and Image Preprocessing
Light Source 2
Coffee Bean Sample Digital Camera
Computer - image preprocessing - feature extraction
- coffee bean grade interpretation
Monitor
Light Source 1
Figure 1. Block Diagram of Detection System
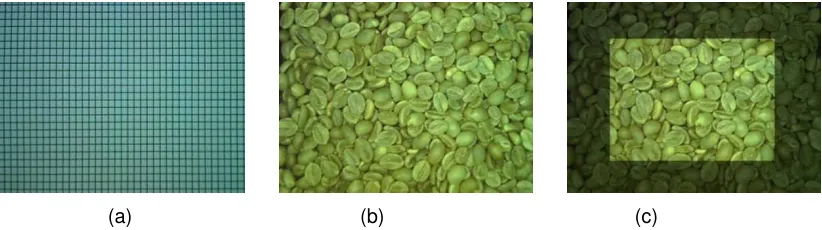
Figure 2. The example of image from robusta coffee bean for each grade.
(a) (b) (c)
Figure 3. Optical distortion that produces divergence effect on image (a) and edge color shows a shifting (b). Centralized feature extraction will reduce optical distortion effect (c).
2.2. Feature Extraction
According to Siswoputranto [15], the main aspects to determine the coffee bean quality are: (1) size; (2) shape; (3) color; (4) defect; and (5) other materials. Those five aspects were quality criteria and could be described to quality parameter that represented by image parameters. Feature extraction is performed to get image parameters of coffee bean image samples in the term of color and texture. Color is one of the fundamental element of image. In image processing technique, colors and their interrelation could be shown as color model. One of color model that is frequently used in image processing is RGB (Red Green Blue) model. Color image that is commonly used is 24-bit color image that is known as true color. Image in this format is RBG image with specific intensity composition for each component. By combining intensity variation in each color component, various color composition could be made. The color
Grade I Grade II Grade III
features to be sorted in this system is mean of each color component intensity of pixels in each coffee bean sample image and then it is called by Rmean, Gmean, and Bmean.
On the other hand, texture is an intrinsic characteristic of image that has correlation to its roughness, granulation, and regularity of pixel structure. Textural aspect of an image could be used as segmentation, classification, and image interpretation. Haralick [16] has proposed a number of useful texture features such as energy, entropy, contrast, and homogenity. Calculation of texture properties then would be performed by using information that could be expressed in the term of co-occurrence matrix as follows [16,17]:
1. Entropy
Energy is a feature to measure the concentration of intensity pair in co-occurrence matrix.
=
∑ ∑
ଵ ଶ ଶ ଵ,
ଶ(2)
3. Contrast
Contrast is used to measure the difference in the strength between intensity in image.
= ଵ− ଶ
Homogenity is an inverse of contrast, which measure the homogen feature of the intensity variation within the image.
From the equations aforementioned, notation denotes the probability. It has value from zero to one, which shows the value of the element within co-occurrence matrix, while ଵ and ଶ show the intensity couple from the neighboring intensity. This neighboring couple in co-occurrence matrix acts as row number and column number, respectively.
Furthermore, statistical test is performed using ANOVA to find whether the mean value for each image parameter has differences from one to the others.
2.3. Coffee Bean Grade Interpretation
Software to determine quality grade for coffee bean is developed based on basic algorithm on Back Propagation in artificial neural network [18,19]. Modeling for artificial neural network is done using Matlab to find the relation between the value of image parameter of coffee bean and its grade quality.
After the system has been built, it will be tested to find its accuracy in determining coffee bean quality grade. The accuracy level could be found by comparing the result from this system to the real value that could be determined from Defect System.
3. Results and Analysis
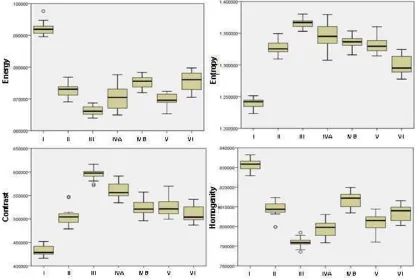
3.1. Parameter Value from Sample Image
grade II until VI. Meanwhile, mean value for color parameter which consists of Rmean, Gmean, and Bmean different significantly except for mean value of Rmean for grade II and III.
Figure 4. Texture parameter values.
3.2. Hardware for image acquisition
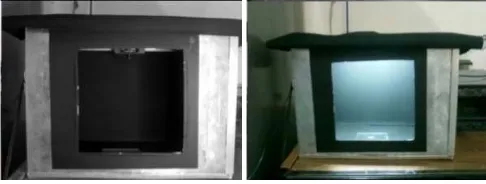
Hardware development for image acquisition can be seen on Figure 6. Position for light source and digital camera could be shown on Figure 7. In this position, light source will produce illumination as much as 414.5+2.9 lux. Digital camera is laid down 5 cm parallel under light source in order to produce clear image, and is intended to solely capture the image from the object (without capturing the background). This is meant to make the next step for image processing becomes easier. Furthermore, inside walls of hardware box are made from black material to avoid reflection from walls to the camera.
Figure 6. Hardware development for image acquisition.
(a) (b)
Figure 7. Position for light source(a) and digital camera (b).
3.3. Software
The software interface for coffee bean grade determination system can be shown on Figure 8. This software consists of three features i.e. data acquisition for coffee bean image, data processing, and quality grade identification for coffee bean.
Figure 8. The software interface for coffee bean grade determination system.
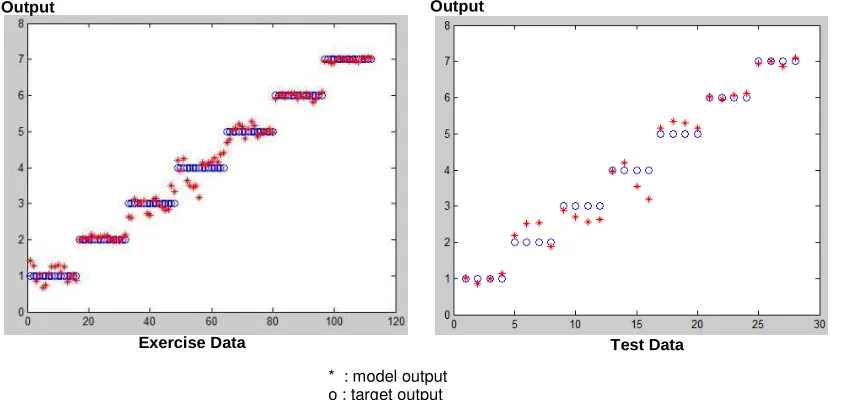
Model for artificial neural network has exercise data and test data for image parameter value from coffee bean grade I, II, III, IVA, IVB, V, and VI and the target outputs are 1,2,3,4,7, 5, and 6 respectively. Their learning rate is 0.3 and network architecture has 7 input neurons, 9 hidden neurons, and 1 output neuron. Identification rate of model to exercise data and test data could be shown on Figure 9. The results show that large output deviation occurs on identification process for grade III, IVA, and V.
Output
Exercise Data
Output
Test Data
* : model output o : target output
Figure 9. Identification rate of ANN model to exercise data and test data. The target outputs are 1,2,3,4,7, 5, and 6 for grade I, II, III, IVA, IVB, V, and VI respectively.
Moreover, testing results show that the equipment for coffee bean determination has accuracy at about 100%, 80%, 60%, 40%, 100%, 40%, and 100% for grade I, II, III, IVA, IVB, V, and VI, respectively. Small accuracy occurs on grade determination for grade III, IVA, and V. These results are in accordance with artificial neural network modeling that is used in software. In fact, this model has large deviation on output for test data for grade III, IVA, and V, and as the result, the software has difficulties to determine quality grade on those situation.
4. Conclusion
The instrument to determine coffee bean quality grade has been developed. This instrument uses SNI No:01-2907-1999 as standard and uses visual sensor to determine quality of coffee bean based on image parameter such as energy, entropy, contrast, homogenity, Rmean, Gmean, and Bmean. All of these parameters are obtained from the images taken by digital camera.
Hardware testing shows that illumination at area where the sample is laid down is uniform at about 414.5+2.9 lux. Statistical test by ANOVA method for image parameter in each grade shows that for confident level of 95%, mean value for texture parameters that consists of energy, entropy, contrast, and homogenity crossing at the same point for quality grade II until VI. Meanwhile, mean value for color parameter which consists of Rmean, Gmean, and Bmean different significantly except for mean value of Rmean for grade II and III. The accuracy of system testing for the coffee beans of grade I, II, III, IVA, IVB, V, and VI have the value of 100%, 80%, 60%, 40%, 100%, 40%, and 100%, respectively.
The future research in this field shall emphasize on the development of image pre-processing in order to get image features that have character that truly represent the characters of the objects under consideration such as using color character on each point within the image.
Acknowledgements
This research is funded by DIKS, Faculty of Engineering, Gadjah Mada University.Special thanks to Putik Dhiraramanti, ST. and Stephanus Suryanto, ST. for technical support.
Reference
[2] International Coffee Organization. Trade Statistics of Total Production of Exporting Countries. www. ico.org. July 2011.
[3] Mulato S. Pengolahan Produk Primer dan Sekunder Kopi (Primer and Secunder Coffee Product Processing). Jember: Pusat Penelitian Kopi dan Kakao Indonesia. 2006.
[4] Su TL, Kung FC, Kuo YL. Application of Back-Propagation Neural Network Fuzzy Clustering in Textile Texture Automatic Recognition System. Proceedings of The 2008 International Conference on Wavelet Analysis and Patern Recognition. Hongkong. 2008.
[5] Chen YR, Chao K, and Kim MS. Machine Vision Technology for Agricultural Applications. Computers and Electronics in Agriculture. 2002; 36(2-3): 173-191.
[6] Visen NS, Paliwal J, Jayas DS, White NDG. Specialist Neural Networks for Cereal Grain Classification. Biosystems Engineering, 2002; 82(2): 151–159.
[7] Markou M, Singh SS. Color Texture Analysis of Natural Scene using Neural Networks. Proceedings of The International IEEE/INNS Joint Conference on Neural Networks (IJCNN’02). Hawaii. 2002. [8] Chen X, Xun Y, Li W, Zhang J. Combining Discriminant Analysis and Neural Networks for Corn
Variety Identification. Computers and Electronics in Agriculture. 2010; 71(1): 48-53.
[9] Granitto PM, Navone HD, Verdes PF, Ceccatto HA, Weed Seeds Identification by Machine Vision.
Computers and Electronics in Agriculture. 2002; 33(2): 91-103.
[10] Kondo N, Ahmad U, Mitsuji M, Murase H. Machine Vision Based Quality Evaluation of Iyokan Orange Fruit using Neural Network. Computers and Electronics in Agriculture. 2002; 29(1-2): 135-147. [11] Urena R, Rodriquez F, Berenquel M. A Machine Vision System for Seeds Quality Evaluation Using
Fuzzy Logic. Computers and Electronics in Agriculture. 2001; 32(1): 1-20.
[12] Soedibyo DW, Seminar KB, Ahmad U, Subrata IDM. The Development of Automatic Coffee Sorting System Based on Image Processing and Artificial Neural Network. Asian Federation for Information Technology in Agriculture 2010 International Conference. Bogor. 2010.
[13] Carillo E, Penaloza AA. Artificial Vision to assure Coffee-Excelso Beans Quality. Proceedings of EATIS Conference. Prague. 2009.
[14] SNI 01-2907-1999. Biji Kopi (Coffee Bean). Badan Standarisasi Nasional. 1999. [15] Siswoputranto. Kopi International dan Indonesia. Jakarta: Kanisius. 1993.
[16] Haralick RM, Shanmugan K, Dinstein I. Textural Features for Image Classification. IEEE Trans, Systems, Man and Cybernetics, SCM-3. 1973; 6: 610-621.
[17] Fadhil A. An Automatic Identification System of Human Skin Irritation. TELKOMNIKA Indonesian Journal of Electrical Engineering. 2010; 8(3): 255-264.
[18] Mehrotra K, Mohan CK, Ranka S. Elements of Artificial Neural Networks. Cambridge: MIT Press. 1996.