Full Terms & Conditions of access and use can be found at
http://www.tandfonline.com/action/journalInformation?journalCode=vjeb20
Download by: [Universitas Maritim Raja Ali Haji] Date: 11 January 2016, At: 22:19
Journal of Education for Business
ISSN: 0883-2323 (Print) 1940-3356 (Online) Journal homepage: http://www.tandfonline.com/loi/vjeb20
A Statistical Framework for Assessment Using the
ETS Major Field Test in Business
Daniel Murray Settlage & Latisha Ann Settlage
To cite this article: Daniel Murray Settlage & Latisha Ann Settlage (2011) A Statistical
Framework for Assessment Using the ETS Major Field Test in Business, Journal of Education for Business, 86:5, 274-278, DOI: 10.1080/08832323.2010.516777
To link to this article: http://dx.doi.org/10.1080/08832323.2010.516777
Published online: 21 Jun 2011.
Submit your article to this journal
Article views: 143
View related articles
ISSN: 0883-2323 print / 1940-3356 online DOI: 10.1080/08832323.2010.516777
A Statistical Framework for Assessment Using the
ETS Major Field Test in Business
Daniel Murray Settlage and Latisha Ann Settlage
University of Arkansas at Fort Smith, Fort Smith, Arkansas, USA
The Major Field Test in Business (MFT-B) is a widely used end-of-program assessment tool; however, several challenges arise when using the test in this capacity. Changing student demo-graphics and the lack of a statistical framework are two of the most vexing issues confronting educators when using the MFT-B for programmatic assessment. The authors extended the literature by developing an analytical framework that controls for student demographics and provides statistically valid evidence of outcomes assessment. Application of the model to a sample data set revealed that the model fit well (R2=.517) and provides a valid framework
for the exploration of outcomes assessment.
Keywords: assessment, business, ETS major field test, MFT, standardized test, student demo-graphic
The search for reliable and consistent assessment of learn-ing techniques is an ongolearn-ing pursuit. Recent calls from government officials, accrediting agencies, and university administrations have heightened the importance of obtaining measures of performance that are easily interpreted and com-parable across institutions. As the focus on student achieve-ment results increases, numerous institutions struggle to develop, implement, and analyze an assurance of learning plan that provides valid and usable information to all stake-holders. Many internally developed assessment procedures provide evidence of student learning outcomes that satisfy internal stakeholder demands, but are less than satisfactory to external stakeholders such as government officials and community members. In response to these increasing de-mands, many business schools use the Educational Testing Service’s (ETS) Major Field Test in Business (MFT-B) as a component of their assessment measures. The ETS has in-dicated that over 700 colleges and institutions use MFTs as an end-of-program outcomes assessment tools (2009). The MFT-B is a particularly attractive assessment tool because it is comprehensive, easy to implement, and allows perfor-mance comparisons through time, across institutions, and against a national norm. In addition, the MFT-B provides
re-Correspondence should be addressed to Daniel Murray Settlage, Univer-sity of Arkansas at Fort Smith, College of Business, Business & Industrial Institute 212, 5210 Grand Avenue, P.O. Box 3649, Fort Smith, AR 72913, USA. E-mail: [email protected]
sults that are easy to understand and disseminate to external stakeholders.
The MFT-B exam is a 120-question multiple-choice exam covering areas typically included as core topics in a business program. Many institutions choose to give the MFT-B to their senior business majors (frequently as a component of a capstone course) as part of a broader set of assessment mea-sures. Despite the widespread use of the MFT-B, its use is not without criticism. Parmenter (2007) pointed out a num-ber of concerns with the test, including student apathy con-cerning performance, problematic facilitation of continuous improvement, and long delays between learning and testing. Particularly vexing are the problems associated with using the MFT-B in the process of continuous improvement.
There is anecdotal evidence of the cohort effect, whereby test results from a particular semester are influenced by the idiosyncratic mix of students taking the exam. Unless an in-stitution has a very large population of students taking the exam every year, the variable mix of student characteris-tics each semester can mask the effect of any programmatic changes on learning outcomes, thus complicating the effort to use MFT-B results for continuous improvement purposes. Thus, the variability of MFT-B scores based on student char-acteristics can significantly hinder the use of the MFT-B as an assessment tool.
There is a significant body of literature devoted to ex-ploring student performance on the MFT-B using a variety of data and methods. Most studies attempt to shed light on MFT-B scores using student level characteristics. Bean and
STATISTICAL ASSESSMENT USING THE MFT-B 275
Bernardi (2002) regressed MFT-B scores on gender, SAT ver-bal scores, and SAT mathematics scores. They found male gender and SAT verbal scores were positively related to MFT-B scores (R2=.299). Allen and Bycio (1997) conducted a correlation analysis of MFT-B scores and various student-related characteristics. They did not find a significant rela-tionship between gender and test score, but they did find major, SAT score, and GPA to be related to test scores. In ad-dition, MFT-B scores were found to be significantly higher when they comprised a portion of a grade in a capstone course. In a follow-up, Bycio and Allen (2007) reexamined some of the original hypotheses of their 1997 study, with the benefit of new data. The results were largely similar to the results of their original study. Bycio and Allen noted that interpretation of the MFT-B score hinges on several factors, including SAT score and student motivation. Terry, Mills, and Sollosy (2008) corroborated the notion that student mo-tivation is a significant factor in student performance on the MFT-B.
Mirchandani, Lynch, and Hamilton (2001), Black and Duhon (2003), and Bagamery, Lasik, and Nixon (2005) found significant relationships between MFT scores and student-level variables. In particular, SAT and ACT scores and GPA frequently appear to be significantly and positively related to MFT-B test scores. In addition, the previously mentioned three studies found a significant and positive relationship be-tween male gender and test score. However, the finding of a performance differential based on gender is not universal, as Allen and Bycio (1997) and Bycio and Allen (2007) found no evidence of a gender gap.
Wilson (2008) proposed a method by which to analyze the results of the MFT-B to make programmatic changes. He developed a protocol to analyze the MFT-B test results and make program-level decisions based on the results. The procedure involved constructing an MFT analysis table that can be used to identify strengths and weakness by major and knowledge area. This process of using assessment data for continuous improvement, frequently referred to as closing of the loop, is a necessary part of any assessment program.
The purpose of this study was to build on and extend the existing literature by developing a framework to utilize the MFT-B scores as an assessment tool. This framework is computationally simple, requires minimal data, and en-ables schools to conduct statistical tests regarding the assess-ment of learning objectives. By correlating various student characteristics to test performance, student performance on the MFT-B can be split into intrinsic (student-driven) and program-driven factors. Once the student-driven changes are eliminated, the remaining variation in scores can be attributed to programmatic changes. This model can be used to detect the effect of programmatic changes in the face of an ever-changing student composition. In the remainder of this ar-ticle, the data used in the model are first discussed. Then, the model is developed and applied to a sample of data to
illustrate its capability. Finally, we discuss the implications and conclusions of the analysis.
METHOD
The data for this study were from a midsized regional insti-tution located in the midsouth. The instiinsti-tution required every graduating senior business major to take the MFT-B in a se-nior capstone course, and the exam score earned counts as a relatively modest proportion of their overall grade in the class. The data sample ranged from January 2006 to Decem-ber 2008. Independent variables for each student included age at time of test, test version (old or new), declared ma-jor, gender, comprehensive ACT score, grade in strategic management (the senior capstone course), overall GPA, and business GPA. The initial data set consisted of 350 observa-tions. After excluding all observations with missing values for one or more of the independent variables, 229 remained for use in the study.
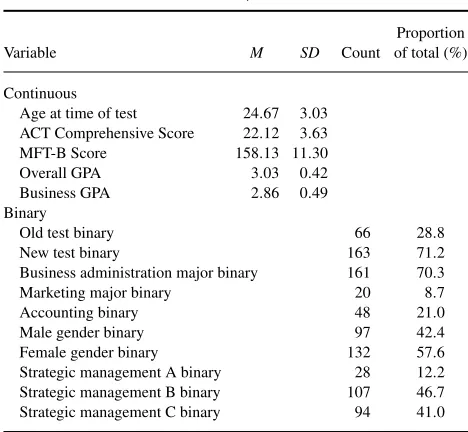
Table 1 shows the descriptive statistics associated with the sample data. The average ACT score of students in the sample was 22.12, whereas the average MFT-B score was 158.13. The business GPA of the students taking the exam was 2.86, whereas the overall GPA was slightly higher, at 3.03. It is worth noting that the sampled institution allowed grade forgiveness: Students may retake a course, and only the grade most recently earned counts toward the cumulative GPA. In addition, the institution’s business students were required to (a) earn a grade of C or better in all business core and major courses and (b) maintain a minimum 2.25 GPA (4-point scale) for graduation.
TABLE 1
Descriptive Statistics of Selected Variables (N= 229) ACT Comprehensive Score 22.12 3.63 MFT-B Score 158.13 11.30
Business administration major binary 161 70.3
Marketing major binary 20 8.7
Accounting binary 48 21.0
Male gender binary 97 42.4
Female gender binary 132 57.6
Strategic management A binary 28 12.2 Strategic management B binary 107 46.7 Strategic management C binary 94 41.0
The ETS updates its MFT-B examination every three years, so the data in this sample spanned an updating cy-cle. Approximately 29% of the observations in this sample were from the exam prior to the August 2006 update, whereas the remaining 71% were post-August 2006. With respect to major, about 70% of the students in the sample were business administration, roughly 9% were marketing majors, and the remaining 21% were accounting majors. The marketing ma-jor at this institution came into existence in the 2006–2007 academic year, and thus the percentage of marketing majors was relatively low over the time period studied. About 42% of the students in the sample were men. The last three binary variables (strategic management A, B, and C) corresponded to the three grades possible for students enrolling in the busi-ness capstone course. These three grade categories sum to 100% because any student earning below a C must retake the class and earn C or better to graduate. About 12% of the sampled students earned an A in the course, 47% earned a B, and the remaining 41% earned a C.
RESULTS
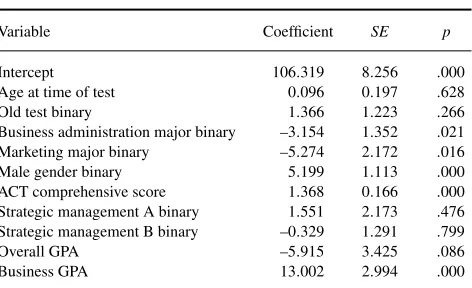
Results of the initial regression are shown in Table 2. Overall, the initial model explained 52.5% of the variation in student test scores. In the interest of parsimony, any independent variable not significant at the 5% level was eliminated and the model was re-estimated. Variables not significant at the 5% level included student age, test version, grade in strategic management, and overall GPA. The insignificance of the age variable lends credence to the notion that performance on the exam is insensitive to student age. The lack of significance of the strategic management grades suggests the exam is general in nature and performance on the exam is independent of performance in the strategic management capstone course. Furthermore, it appears the new and old examinations yield similar results with respect to student performance. Finally, overall GPA is likely insignificant due to the fact that overall GPA and business GPA are highly collinear. The correlation coefficient between overall GPA and business GPA was .91. Thus, the GPA effect was captured by the business GPA, as it was a stronger measure of potential performance on the MFT-B.
The revised model results are given in Table 3. The R2 for the revised model remained high, at .509, supporting the notion that the omitted variables did not contain any explanatory power. All remaining coefficients in the final model are significant at the 5% or better level.
Over the sample period in which the data were collected, the institution offered its business students choice of three majors: accounting, business administration, or marketing. The negative signs on the business administration and mar-keting binary variables suggest that students in these majors tend to perform at a lower level on the exam than do ac-counting majors. This may be partially explained by the fact
TABLE 2
Business administration major binary –3.154 1.352 .021 Marketing major binary –5.274 2.172 .016 Male gender binary 5.199 1.113 .000 ACT comprehensive score 1.368 0.166 .000 Strategic management A binary 1.551 2.173 .476 Strategic management B binary –0.329 1.291 .799
Overall GPA –5.915 3.425 .086
Business GPA 13.002 2.994 .000
Note. R2=.525.
that accounting majors tend to take more coursework in their academic careers to prepare for taking the CPA exam. In addition, many accounting majors choose to double major in another business field to get the requisite hours to sit for the CPA exam. Any accounting major who is also a double major is represented as an accounting major in this study.
The magnitude (5.783) and significance of the gender binary indicates men significantly outperformed women on the MFT-B. This could be due to a sample selection prob-lem. Only 42% of the students taking the exam were men. Perhaps men inclined to perform poorly on the exam choose to avail themselves of other employment or academic alterna-tives, whereas the women do not. If men view the available opportunities outside of college to be more attractive than do women, they are more likely to choose a career path not requiring college preparation in greater proportion than do women. The men self-selecting into the nondegree career paths are likely those who would do poorly in an academic setting, and thus more low-performing men drop out relative to low-performing women, biasing the results. Regardless of the reason, the finding of a performance gap between men and women is consistent with a number of previous studies.
The positive sign and significance of the ACT score shows positive performance on the ACT was correlated with posi-tive performance on the MFT-B. This result is not surprising, given the standardized nature of both exams. The positive
TABLE 3
Revised OLS Regression Results
Variable Coefficient SE p
Intercept 103.924 4.101 .000
Business administration major binary –3.304 1.322 .013 Marketing major binary –5.911 2.135 .006 Male gender binary 5.783 1.085 .000 ACT comprehensive score 1.312 0.164 .000
Business GPA 8.948 1.213 .000
Note. R2=.509.
STATISTICAL ASSESSMENT USING THE MFT-B 277
and large coefficient on business GPA suggests that students who do well in their business studies are inclined to excel on the MFT-B as well. This result is a reassuring conformation of the validity of the content of business curriculum. The previous results are largely consistent with the majority of the cited literature, but some studies (e.g. Allen & Bycio, 1997; Bycio & Allen, 2007) did not corroborate the gender findings.
DISCUSSION
Application to Assessment
Overall, the model explained approximately 51% of the vari-ation in MFT-B scores. The remaining varivari-ation not explained by the model was due to either randomness or other factors not captured by the model. The model can be used for pro-grammatic assessment in a variety of ways. One of the most useful approaches is to use the model to test for the cohort effect. This can be done by inserting binary variables into the model to represent the cohort in question. Thus, if it was a concern that a particular category or group of students was performing above or below expectations, this could be controlled for.
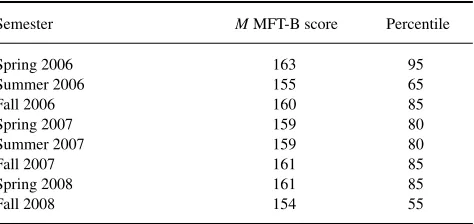
Table 4 shows MFT-B results for the study institution, by semester. A cursory examination of the table shows that the performance of students in the December 2008 cohort dropped relative to the previous semesters. Is this drop due to the particular mix of students taking the exam that semester, or is it a real structural change in the MFT-B scores of the institution? By inserting a binary variable to account for the scores of all students who took the exam in December of 2008, it is possible to test to determine if those scores are statistically significantly different from other scores observed for the institution over time.
Table 5 illustrates the regression results that include a binary variable for the 35 students who took the exam in December of 2008. As the table shows, the coefficient on the binary variable is not significant at the 5% level. Thus, we fail to reject the null hypothesis that the binary coefficient on the December 2008 cohort is equal to zero. Therefore,
TABLE 4
Institutional MFT-B Results, by Semester
Semester MMFT-B score Percentile
Spring 2006 163 95
Revised OLS Regression Results With December 2008 Cohort Binary
Variable Coefficient SE p
Intercept 104.984 4.117 .000
December 2008 cohort binary –2.795 1.489 .062 Business administration major binary –3.251 1.315 .014 Marketing major binary –5.397 2.141 .012 Male gender binary 5.554 1.086 .000 ACT comprehensive score 1.309 0.164 .000
Business GPA 8.755 1.211 .000
Note. R2=.517.
we cannot conclude that the students who took the test on December 2008 were different from students who took the exam in other semesters.
The method of tracking performance by cohort can also be used to examine the effect of programmatic changes on MFT-B scores. For example, at the study institution, a revamped curriculum that included substantial changes to course of-ferings was instituted in the 2007–2008 academic year. The present data set did not contain any students who gradu-ated under this new curriculum. As time progresses, students earning their degrees under the new change can be tracked and the effect of the change can be examined in a manner similar to that of a cohort. Results supporting the conclusion of a structural break provide statistically valid evidence of real change. In addition, by adding binary slope shifters, the impact of the change on the variation in the slope parame-ters lends insight into the nature of the change. Perhaps the change is one that helps women more than men, or market-ing majors more than the general population of students as a whole. If sufficient data are present, a more sophisticated method to test for a structural change, such as a Chow test, may be conducted.
It is important to note that the technique outlined previ-ously incorporates all information available to the researcher. Thus, a significant coefficient on a cohort binary indicates the variable is significant after controlling for all of the indepen-dent variables related to stuindepen-dent demographics included in the model. Thus, a finding of significant results regarding programmatic changes is strong evidence that the changes made a substantive difference in test scores.
CONCLUSIONS
In response to the increased focus on student learning out-comes and accountability to external stakeholders, educa-tional institutions are turning to standardized examinations such as the MFT-B as part of an overall assurance of learning package. As growing emphasis is placed on the MFT-B, new techniques must be developed to assist in analyzing and in-terpreting the results. This article outlines a method that can
be used to analyze the standardized MFT-B results for use in programmatic assessment. Typically, MFT-B results are dif-ficult to use in assessment due to the generality of test scores and variability of test scores based on student characteristics. The previous technique controls for student characteristics, thus allowing the effect of program-level changes to be more easily assessed. This method relies on a comprehensive set of data typically readily available at any institution. The re-gression results are idiosyncratic to individual institutions, and thus each institution has differing coefficient values and differing significant variables. The flexibility of the method allows for the inclusion of almost any variable suspected of impacting test scores. In addition, the previous method can be applied to testing scores in other disciplines and areas.
There are several limitations of using the MFT-B for as-sessment. Because the exam is typically given at the end of a student’s program, there may be a significant delay between the time learning occurs and the time testing occurs, for some topics covered on the exam. Perhaps more troublesome is the fact that the MFT-B is a lagging indicator of change. There is a large lag between the time a programmatic change is instituted and the time students who complete revised pro-grams take their MFT-B exams. This lag makes it difficult to utilize the MFT-B for rapid assessment feedback. In ad-dition, because the MFT-B spans multiple categories, and student level performance in the functional areas (e.g., ac-counting, economics, finance) is reported in aggregate (and not on a student-by-student basis), assessment results utiliz-ing the previous technique can be viewed as applyutiliz-ing to the entire curriculum. Thus, it is best to use the previous method as it applies to MFT-B scores to track large changes affecting the entire curriculum, rather than changes affecting only one particular functional area of business.
An interesting extension of this research may be to reach beyond a single institution and examine how students at dif-ferent institutions compare. Using multi-institutional data, each institution could be treated as its own cohort. It is im-portant to note the results of this study cast no light on the validity of the MFT-B as an assessment tool. For the method
to be effective, the MFT-B must be testing over the same material an individual program emphasizes. If the test is not covering material deemed important as defined by the mis-sion and vimis-sion of the program, then another testing method should be used. A straightforward extension of the previous technique would be to apply the methodology in assessing the results of departmental or individual class examinations.
REFERENCES
Allen, J. S., & Bycio, P. (1997). An evaluation of the Educational Testing Service Major Field Achievement Test in business.Journal of Accounting Education,15, 503–514.
Bagamery, B. B., Lasik, J. J., & Nixon, D. R. (2005). Determinants of success on the ETS business major field exam for students in an undergraduate multisite regional university business program.Journal of Education for Business,81(1), 55–63.
Bean, D. F., & Bernardi, R. A. (2002). Performance on the Major Field Test in business: The explanatory power of SAT scores and gender.Journal of Private Enterprise,17/18(2/1), 172–178.
Black, H. T., & Duhon, D. L. (2003). Evaluating and improving student achievement in business programs: The effective use of standardized tests.Journal of Education for Business,79(2), 157–162.
Bycio, P., & Allen, J. S. (2007). Factors associated with performance on the Educational Testing Service (ETS) Major Field Achievement Test in Business (MFAT-B).Journal of Education for Business,82(4), 196–201.
Educational Testing Service. (2009).Schools administering the Major Field Test. Retrieved from http://www.ets.org/portal/site/ets/menuitem. 1488512ecfd5b8849a77b13bc3921509/?vgnextoid=fb2baf5e44df4010V gnVCM10000022f95190RCRD&vgnextchannel=758232523a186110Vg nVCM10000022f95190RCRD
Mirchandani, D., Lynch, R., & Hamilton, D. (2001). Using the ETS Major Field Test in Business: Implications for assessment.Journal of Education for Business,77(1), 51–56.
Parmenter, D. A. (2007). Drawbacks to the utilization of the ETS Major Field Test in Business for outcomes assessment and accreditation.Proceedings of the Academy of Educational Leadership,12(2), 45–55.
Terry, N. B., Mills, L., & Sollosy, M. (2008). Student grade motivation as a determinant of performance on the Business Major Field ETS exam. Journal of College Teaching and Learning,5(7), 27–32.
Wilson, P. H. (2008). A protocol for analyzing the Major Field Test results. Journal of Business and Behavioral Science,19(2), 33–45.