TERRAIN CHARACTERIZATION AND
SOIL EROSION RISK ASSESSMENT FOR WATERSHED PRIORITIZATION USING REMOTE SENSING AND GIS
A case study of Nawagaon Maskara Rao Watershed, Saharanpur, India
Beny Harjadi
Forestry Research Center Solo Pabelan Surakarta E-mail:[email protected]
ABSTRACT
Soil erosion is crucial problem in India where more than 70% of land in degraded. This study is to establish conservation priorities of the sub watersheds across the entire terrain, and suggest suitable conservation measures. Soil conservation practices are not only from erosion data both qualitative SES (Soil Erosion Status) model and quantitative MMF (Morgan, Morgan and Finney) model erosion, but we have to consider LCC (Land Capability Classification) and LULC (Land Use Land Cover). Study demonstrated the use of RS (Remote Sensing) and GIS (Geographic Information System) in soil erosion risk assessment by deriving soil and vegetation parameters in the erosion models. Sub-watersheds were prioritized based on average soil loss and the area falls under various erosion risk classes for conservation planning. The annual rate of soil loss based on MMF model was classified into five soil erosion risk classes for soil conservation measures. From 11 sub watersheds, for the first priority of the watershed is catchment with the small area and the steep slope. Recommendation for steep areas (classes VI, VII, and VIII) land use allocation should be made to maintain forest functions.
Keywords: degradation, erosion model, analysis digital, priority of sub watershed
INTRODUCTION
Terrain characterization signifies the sum of all physical features and conditions at or near the earth surface (Pandey and Shedha, 1981). Understanding the terrain characteristics and processes and their use-fulness to various users is the terrain pur-pose of terrain analysis (Kirkby, 1976). Important terrain characteristics for study-ing soil erosion are slope gradient, length, aspect and shape (Taiwan, 2001).
earth-quake, and glacial-lake-outburst flooding should be recognized as well (Narayana, Sastry and Patnaik, 1997). For landslide can be predicted by statistical relationship between past landslides and the spatial data set of the factors : slope angle, slope aspect, transversal slope profile, lithology, superficial deposits, geomorphology, and land use (Zezere et al., 2004).
Accelerated soil erosion has adverse economic and environmental impact (LAI, 1998; and Bathale and Sharma, 2001). Economic effects are through loss of farm income due to on-site and off-site reduc-tion in income, and other losses with ad-verse impact on crop/animal production (Bali, 1983). The on site of soil erosion reduced land and soil quality and produc-tivity viz.: temporary decline in land/soil quality, transient pollution of surface wa-ter by sediment-borne chemicals (Wishmeier and Smith, 1978; and Spanner, Strahler, and Estes, 1982). The off soil erosion exerted impacts such as : perma-nent decline in land/soil quality due gully-ing, alteration in soil-water regime and water table, and additional water manage-ment (Singh, 2003). Degraded lands or soil erosion such as: Gullied/ravenous (eroded) land, Undulating uplands with or without scrub, Water logged and marshy land, Land affected by salinity/alkalinity (coastal), Shifting cultivation area, De-graded notified forest land, DeDe-graded pas-tures/grazing land, Sandy areas (desert/ coastal), Mining/industrial wetland, Bar-ren rocky/stony waste/sheet-rock area, Steep sloping areas, and Snow covered/ glacial areas (Shanware, Karale, and Singh, 1985). The magnitude of disaster associ-ated with soil loss (landslide) has increased and the major concern of engineering ge-ologist and geotechnical engineers (Ahmad
et al., 2006)
India is reverie country is drained by major rivers and their tributaries (Shrimali, Aggrawal, and Samra, 2001). Watershed is natural hydrologic entity governed by the terrain topography from where run off is drained to a point. Watershed Prioritization is a pre-requisite to operational any major scheme, as it allows the planners and policy makers to adopt a selective approach con-sidering the vastness of the catchments area, severity of the problem, constraint of funds and man power, demands of the local and political system (Chakraborti, 1993). Watershed management, in its broadest sense, implies prudent use of soil and water, hence, programmed are required to protect the environment to sustain the productivity levels of soils by reducing land degradation (Chaudary, Manchanda and Singh, 1992).
The optimum use of available soil and water resources based on their inherent limi-tations is one of the most important pre-req-uisites for systematic planned development of any watershed (Das, Narula, Laurin, 1992). Survey of watershed provides rel-evant information on land use, hydro-geo-morphology, soil types, rock types etc (Ravishankar et al., 1994). Their extent, po-tential and limitations, which help planners to take decisions regarding sustained land use Shanware, Karale, and Singh, 1985). Recently, the planning and development of land and water resources on a watershed ba-sis in different terrain an agro climatic regions has been assumed and also to preserve the environment and to maintain ecological bal-ance (Shrestha, Honda and Murai, 1997).
develop-ment (Kumar et al., 1998; and Singh et al., 2002). A number of parametric models have been developed to predict soil ero-sion and with a few exceptions, these model are based on soil, land use land cover, land-form, climatic and topographic information (Singh, 1994). Integrating satellite imagery with GIS is useful for study in land use change and another parameters (Halim et al., 2006). The higher resolution of the im-ages is large of the data size (Al-Bastaki, 2006). For increasing accuracy data Bonyad (2005) use classified of land cover with PCA (Principal Component Analysis) until 80.63%.
Objectives of the study were: (i) to characterize terrain: morphometric terrain parameters, soil hydrological characteris-tics, to prepare land use/land cover map using LISS IV digital satellite data, (ii) to analyze the sub watersheds as baseline in-formation for conservation planning based on: Morphometric Indices (MI), Qualitative method of Soil Erosion Status (SES), Quantitative method of Morgan, Morgan and Finney (MMF) model. Aim of this study is to establish conservation pri-orities of the sub watersheds across the entire terrain, and suggest suitable conser-vation measures.
MATERIALS AND METHODOLOGY
Location
Saharanpur district attained the sta-tus as Saharanpur division in 1997 of Uttar Pradesh. As regards its physical features, the north and the north east of the district is surrounded by Shivalik hills and sepa-rates it from the Dehradun district in the recently created state of Uttranchal. The river Yamuna forms its boundary in the west, which separates it from Karnal and
Yamunanagar districts of Haryana. In the East lies the district of Haridwar that was the part of district Saharanpur before 1989 and in the south lies the district Muzafarnagar.
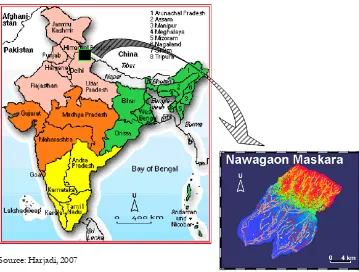
The study area is called Nawagaon and Maskara Rao watershed boundary, and is located in the district of Saharanpur, Uttar Pradesh and District in Northern In-dia. The geographical coordinate of the study area from latitude 30o 09’ 00" N to 30o 21’ 00" N and longitude between 77o 34’ 00" N to 77o 51’ 00" N covering an area of 205.94 sq km (20594.49 ha). The study area is delineated by the SOI toposheet Nos. 53 F/11, 53 F/12, 53 F/ 15 and 53 F/16 at scales 1: 50,000. The location of study area is presented in Fig-ure 1.
Saharanpur forms the most northerly position of the Doab land, which stretches between the holy rivers of the Ganges and the Yamuna, the Shivalik hills rise above it on the northern frontier. The portion of Doab in which Saharanpur is situated was probably one of the first region of upper India occupied by the Aryans colonizers as they spread eastward from the Punjab.
hills are to be seen in a modified form the prevailing characteristics of the Bhabar and Tarai region.
The main characteristics of the dis-trict can be divided into four geomorphol-ogy parts.
(1) Shivalik hill tract (2) The Bhabar land (3) Bangar land
(4) Khadar land (Yamuna, Hindon)
Climate
The study area belong to sub tropical semiarid of India’s central and northern belt. It is also influenced by humid tropi-cal monsoon, which has hot summer and mild winter. The average annual rainfall
from 1988 until 2004 is about 1170 mm and average rainydays is about 72 days, most of which is received during the months of July to September due to South-west monsoon with maximum temperature of 29.4 oC and minimum 15.1 oC.
Material
Data used in the study are : SRTM, digital satellite data LISS IV with resolution 5.8 m and path/row 202/203 acquired on January 28, 2005, hard copy of satellite imageries (FCCs) of the area, and SRTM (Shuttle Radar Thematic Mapper) Digital Elevation Model (DEM). Ancillary data : survey of India topographic map (SOI) No. topo-sheets 53F/11, 53F/12, 53F/15 and 53 F/16 scale 1:50.000 in conjunction with above mentioned units in the study area and Source: Harjadi, 2007
Source: Result of Analysis
Figure 2. Methodology of Analyze Prioritization of Sub Watershed soil characteristics data and soil survey
re-port from Agriculture and Soils Divison, IIRS Dehra Dun. Meteorological data is collected from Muzzafarabad meteorologi-cal station, that is monthly average rainfall data and number of rainy days of last 16 years (1988 – 2004).
The outline of the watershed, contour map, river drainage map and base map were prepared from the above mentioned toposheet (Bhadra, Bhavanaraya and Panda, 1998). For Land use and soil map were pre-pared from digital satellite data LISS IV. Field instruments : Disc infiltrometer, Soil cone sampler for bulk density.
Methodology
Methodology of study comprise: (a) prefield interpretation : interpretation of satellite data for physiographic soil units and to prepare drainage network map of the study area, (b). field work: training sets selection for land use/land cover, to observe of infiltration rate, soil sample collection for bulk density and soil tex-ture from the physiographic units, to ob-serve and characterize erosion features, (c) post field work: to analyse soil samples for sand, silt, and clay and for bulk density of each physiographic unit, and spatial data analysis for soil assess-ment (Figure 2).
Rainfall Data
Satellite Data
Topographical Map
SRTM DEM
Land Use Map
Soil Map
Aspect Drainage
Map
Slope
Morgan, Morgan, &
Finney (MMF M d l)
Soil Erosion Status (SES) Morphometric
Indices (MI)
Priority of Sub Watershed
Land Capability Classification
(LCC)
RECOMMENDATION SOIL CONSERVATION PRACTICES
Field Data Collection
Morgan, Morgan. & Finney (MMF)
The annual rate of soil loss based on MMF model was classified into five soil erosion risk classes for soil conservation measures. I was found that very low risk of erosion (0 - 5 t/h/yr), low risk of sion (5 - 10 t/h/yr), moderate risk of ero-sion (10 - 25 t/h/yr), high risk of eroero-sion (25 - 50 t/ha/yr), very high risk of erosion (>50 t/h/yr). The estimate of the calcula-tion with SES useful for long-term plan-ning and the wide area, because of not needing the field data that many only with the analysis from RS and GIS with used five paremeters that is aspect, slope gradi-ent, drainage density, soil, and land use land cover. The flat area or nearly steep most erosions that happened in the low erosion area (LEA), in the hills area most erosions in a high erosion area (HEA).
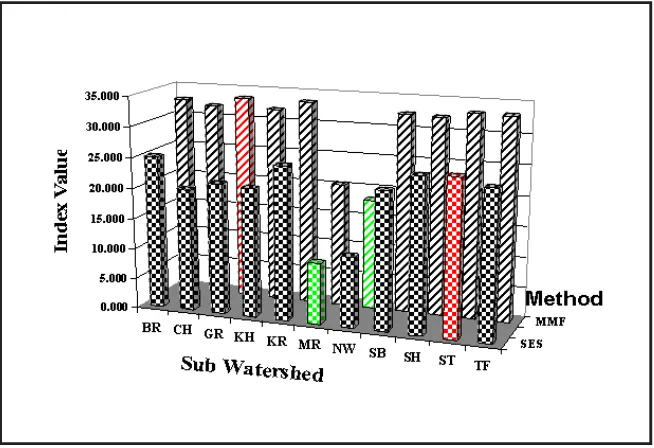
Sub-watersheds were prioritized based on average soil loss and the area falls under various erosion risk classes for con-servation planning. The watershed devided into 1l sub watershed for soil conservation planning, that is : Barkala Rao (BR:397.7 ha), Chamarla Rao (CH:481.9 ha), Galr Rao (GR:998.9 ha), Kharonwala Rao (KH:843.9), Kahan Rao (KR:l159.0 ha), Maskara Rao (MR:5317.5 ha), Nawagaon Rao (NW:7651.9 ha), Sarbar Rao (SB:1059.8 ha), Shakumbari Rao (SH:1296.3 ha), Sahansra Thakur (ST=1035.9 ha), and Track Fallows (TF:351.7 ha).
The lower or flater area LCC fell for the class II and III, on the steep area LCC fell for the class VI, VII, and VIII. Where the class less than IV was allocated for ag-riculture, for example wheat, sugar cane, orchard, whereas the class more than VI was allocated the permanent crop like in the forest. For recommendation of soil conservation, here are 9 types that is: CT: Contour Trenching, CB: Contour Bunding,
P: Plantation, GB: Grass Bunding, GCD: Gabbion Check Dam, GD: Grade Stabi-lizer, SCT: Staggered Contour Trenches, PTG: Plantation of Trenches & Grasses.
RESULTS AND DISCUSSION
The two calculations of the erosion by means of qualitative SES and quantita-tive MMF produced similar priorities, that is with the first priority fell to the sub wa-tershed with the small area and steep slope. The larger subwatershed such as NW and MR were accorded least priority (Figure 3).
Comparative calculation of these two methods also could be seen in the graph below (Figure 4). The two graphs had the same trend that is to the large sub water-shed like NW and Mr in the last priority, to the small sub watershed in the upper area of Shiwalik Hills fell for the first priority, especially for the steep and narrow areas.
It was found that I 1.07 percent area lies in very low risk of erosion (0 - 5 t/h/ yr), 5.75 per cent under low risk of ero-sion (5 - 10 t/h/yr), 33.41 percent under moderate risk of erosion (10 - 25 t/h/yr), 26.0 percent under high risk of erosion (25 - 50 t/h/yr), 2.92 percent under very high risk of erosion (>50 t/h/yr). Nawagaon (NW) and Maskara Rao (MR) nearly steep most erosions that happened in the low erosion area (LEA), BR, SH, ST, and KR high erosion area (HEA). The estimate of the calculation with SES useful for long-term planning and the area. Field data of SES that many only with the analysis from RS and GIS with used five parameters that is aspect, slope gradient, drainage density, soil, and land use land cover.
Source: Result of Analysis
Figure 3. Important Value, Establish by MMF Method and SES
Source: Result of Analysis
[image:7.595.133.460.470.694.2]have caused accelerated erosion, natural phenomena inducing erosion such as ex-ceptional rains, earthquake, and glacial-lake-outburst flooding (Narayana, Sastry and Patnaik, 1997). For calculation of the erosion qualitative erosion (SES) and quantitative erosion (MMF) the last prioritization of sub watershed is similar. For suggestion soil conservation practices is not only from erosion data both qualita-tive and quantitaqualita-tive erosion, but we have to considering LCC (Land Capability Clas-sification) and depend to land use and land cover.
Degraded lands/soil erosion : Gul-lied/ravenous (eroded) land, Undulating uplands with or without scrub, Water logged and marshy land, Land affected by salinity/alkalinity (coastal), Shifting culti-vation area, Degraded notified forest land, Degraded pastures/grazing land, Sandy areas (desert/coastal), Mining/industrial wetland, Barren rocky/stony waste/sheet-rock area, Steep sloping areas, and Snow covered/ glacial areas (Shanware, Karale, and Singh, 1985). Integrating satellite im-agery with GIS is useful for study in land use change and another parameters (Halim, H.A. et al, 2006). For this study used IRS (India Remote Sensing) hig resolution with soft ware ILWIS and GIS with soft ware ARC-GIS and ARC-INFO, for decided prioritization of sub watershed and sug-gested for soil conservation practices.
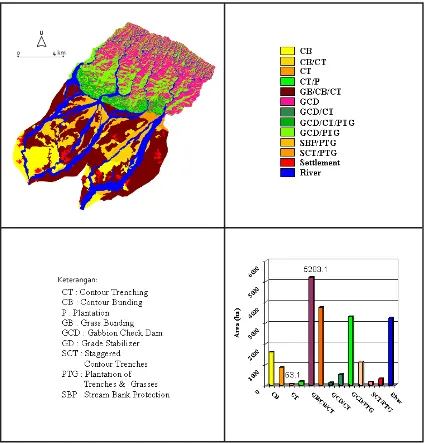
By considering LCC and the kind of land use / land cover the following types of soil conservation practices can be ap-plied, namely (Table 1): CT: Contour Trenching, CB: Contour Bunding, P: Plan-tation, GB: Grass Bunding, GCD: Gabbion Check Dam, GD: Grade Stabilizer, SCT: Staggered Contour Trenches, PTG: Plan-tation of Trenches & Grasses. For LCC (Land Capability Class) more than VI, in
terms of suggested conservation practices, for steeper soils (LCC types VI, VII, VIII, ST, RV) it is adviseable to use combina-tion of GCD and PTG. Whereas for less steep soils GB and additionally CB and CT, whereas for the LCC class was less than VI most used GB with the combination CB and CT (Figure 5).
CONCLUSIONS
The first priority of the watershed is a catchment with the narrow area and the steep slope. The last priority has decided in the watershed with larger area and flat. The estimate of the calculation with SES useful for long-term planning and the wide area, because of not needing the field data that many only with the analysis from RS and GIS with used five parameter that is aspect, slope gradient, drainage density, soil, and land use land cover. For short-term planning was needed by the calculation in more detail with the accurate data and com-plete from the field, as well as made use of the calculation quantitatively could be done with the method of MMF model
Source: Result of Analysis
Figure 5. Soil Conservation Based on LCC Map and Land Use Map
GD: Grade Stabilizer, SCT: Staggered Contour Trenches, PTG: Plantation of Trenches & Grasses. Priority land use in-terventions were elaborated namely GB/ CB/CT, GCD/PTG.. In the future, for watershed management, we have to con-sider social economics conditions such as : population density, well-fare community, and education.
ACKNOWLEDGEMENTS
95
T
injauan Geografis “Litoralisasi” ... (T
riyono)
Table 1. Area in Hectare and Soil Conservation in Various LCC and Land Use
Te
rrain Characterization ... (Beny Harjadi)
LAND USE/ LAND COVER
II III IV VI VII VIII ST RV
Wheat (High Vig.) WHV CB GB/CB/CT GB/CB/CT GB/CB/CT CB/CT
474.4 493.4 0.1 3.3 2.4
Wheat (Low vigour) WLV CB/CT GB/CB/CT GB/CB/CT GB/CB/CT CB/CT
0.6 2,647.0 80.4 10.2 28.5
Orchard OC CB CB/CT GB/CB/CT GB/CB/CT CT
1,118.2 831.9 151.6 0.8 2.8
Dense Forest DF CT GCD/CT GCD GCD GCD GCD
60.3 137.4 2,578.1 842.7 311.0 15.7
Open Forest OF CT/P GCD/CT/PTG GCD/PTG GCD/PTG GCD/PTG SBP/PTG GCD/CT/PTG
191.4 505.9 1,733.6 696.4 225.0 0.1 11.1
Dense Scrub DS SCT/PTG GCD/CT/PTG GCD/PTG GCD/PTG GCD/PTG GCD/CT/PTG
166.8 0.2 1.2 0.6 0.1 3.0
Barren/Scrub BS SCT/PTG GCD/CT/PTG GCD/PTG GCD/PTG GCD/PTG GCD/CT/PTG
1.4 4.2 354.6 189.3 109.4 4.1
Current Fallow CF CB/CT GB/CB/CT GB/CB/CT GB/CB/CT GB/CB/CT
0.1 1,335.3 436.7 0.6 43.7
Settlement ST ST ST ST ST
0.2 0.9 325.7 0.4
River bed RB SBP/PTG SBP/PTG SBP/PTG
551.6 0.04 558.3
Dr. Suresh Kumar, Scientist SE, Agricul-ture and Soils Divison, Indian Institute of Remote sensing, Dehra Dun.
I express my heartfelt my special thanks to all the scientiests and staff IIRS from their invaluable teaching of my
P.G.Diploma, exceptionally to head and all teacher from Agriculture and Soils Divi-sion, Dr.S.K.Saha, Dr.N.R.P.Patel, and Dr.A.Velmurugan. I would like to express my sincere appreciation to my collegues Thein Swe (Myanmar), Tuul Batbaldan (Mongolia), Madame Kalpana, and Rahul.
REFERENCES
Ahmad, F., Yahaya, A.S., Farooqi, A., 2006. Characterization and Geotechnical Properties of Penang Residual Soils with Emphasis on Landslides. American Journal of Environmental Sciences 2 (4) : 121-128.
Al-Bastaki, Y.A.L., 2006. GIS Image Compression and Restoration : A Neural Network Approach. Info Tech Journal 5 (1) : 88-93.
Bali, Y.P., 1983. Problems in Watershed Management in Various River Valley Projects (RVP’s). Proc. Nat. Symp. On Remote Sensing in Development of Water Resources, SAC, Ahmedabad, 10-14 pp.
Bhadra S.K., M. Bhavanarayana, and B.C. Panda, 1998. A Numerical Techniques for Delineating Soil Mapping Units Using Multi Spectral Remote Sensing Data. India Remote Sensing. J., 26(4). 149-160 P.
Biswas, S., S. Sudhakar, V.R. Desai. 1999. Prioritization of Sub-watersheds Based on Morphometric Analysis of Drainage Basin. A Remote sensing and GIS approach. J. of Ind. Soc. of Rem. Sens., 27 (3) : 155-166.
Bothale R.V and J.R. Sharma, 2001. Erosion Response Model For Watershed Prioritization in Bajaj Sagar Sub Catchments. Regional Remote Sensing Service Centre, Jodhpur. New Delhi, India.
Bonyad, A., 2005. Multitemporal Satellite Image Database Classification for Land Cover Inventory Mapping. Journal of Applied Sciences 5 (5) 834-837, 2005
Chakraborti, 1993. Watershed Prioritization. The State-of-the art. NNRMS Bulletin, ISRO, Bangalore, India.
Das, S.N., K.K. Narula, and R. Laurin, 1992. Run Off Potential Indices of Watershed in Tilaiya Catchment, Bihar (India) Through Use of Remote Sensing and Implementation of GIS. J. Indian Soc. Rem. Sens. 20 :207-221.
Halim, A., Jumaat, H.A., Juhari, M.A., Sahibin, A.R., Hamid, H.A. Omar, R.B. et al. 2006. Detection of Usefullness of Integrating Remotely Sensed Data (Landsat TM) with GIS. Info Tech Journal 5 (4) 668-672, 2006.
Harjadi, Beny. 2007. Aplikasi Penginderaan Jauh dan SIG untuk Penetapan Tingkat Kemampuan Penggunaan Lahan (KPL) (Studi Kasus di DAS Nawagoan Maskara,
Saharanpur-India). Forum Geografi Vol. 21, No. 1, Juli 2007.
Kirkby, M.J., 1976. Hydrological Slope Models, The Influence of Climate. In Derbyshire, E. (ED.), Geomorphology and climate. Wiley, p.247-267.
Kumar S., V.S.Arya, C.Subrahmanyam, J.Prasad, L.M.Pande, 1998. A Remote Sensing Approach in Appraisal of Soils for Sustainable Land Use Plan, A case study in semi arid region. Agropedology J, 1998 8(2); 101-106.
LAI, R. 1998. Soil erosion impact on agronomic productivity and environment quality. Critical Review, Plant Science, 17 : 319-464.
Morgan, R.P.C.., D.D.V. Morgan and H.J. Finney, 1984. A Predictive Model for The Assessment of Soil Erosion Risk. J. Agric. Engng. Res., 30, 245-253.
Narayana, V.V.D., G.Sastry, U.S. Patnaik, 1997. Watershed Management. Central Soil and Water Conservation Research and Training Institute, Dehra Dun. Div. Indian Council of Agriculture Research Krishi Anusandhan Bhavan, Delhi.
Palnayandi, M. and V. Nagaratinam. 1997. Land Use and Land Cover Mapping and Charge Detection Using Space Borne Data. Indian society of Remote Sensing Journal vol. 25(1). 27-33 p.
Pandey, L.M. and M.D. Shedha, 1981. Land Suitability and Site Selection for Afforestation of Suitable Species Using Aerial Photographs. A Case study of Ranikhet area of Kumaun region, Lower Himalayas. Proc. Workshop on “Modern Techniques of Site Identification for Afforestation and Pasture Development”, Dehra Dun.
Ravishankar, H.M., Srivastava, S.K. Saha, P. Kumar, and J. Prasad, 1994. Watershed Prioritisation Through The Universal Soil Loss Equation Using Digital Satellite Data and an Integrated Approach. Asian-Pasific, Rem. Sens. J. 6 :101-108.
Shanware, P.G., R.L. Karale and C.J. Singh, 1985. Studies on Landuse Pattern and Land
Degradation Using Landsat Imagery. Proc. 6th asian Conference on Rem. Sens. Hyderabad,
92-99 pp.
a Case Study of Tinau Watershed, Nepal. Space Technology Application and Research Program Asian Institute of Technology.
Shrimali, S.S., S.P. Aggarawal, and J.S. Samra. 2001. Prioritization Erosion Prone areas in Hills Using Remote Sensing and GIS. A Case Study of the Sukhna lake catchment, Northern India. International J. of Applied Earth Observation and Geoinformation, 3(1) :54-60.
Singh, R.K., S.P. Aggarwal, U. Turdukulov and V.H. Prasad, 2002. Prioritization of Bata river basin using remote sensing and GIS techniques, Ind. J. Soil Cons., 30 (3) ; 200-205.
Singh, R. K.. 2003. Soil Conservation Prioritization Based on Erosion Soil Loss and Morphometric Analysis Using Remote Sensing and GIS. Agriculture and Soil Devision, IIRS, Dept.of space, Govt. of India. Dehradun. Uttranchal.
Singh, S. 1994. Remote Sensing in The Evaluation of Morpho-hydrological Characteristics of The Drainage Basin of Jojri Catchment. J. of Arid Zone, 33(4) : 273-278.
Spanner, M.A. A.H. Strahler, J.E. Estes, 1982. Soil Loss Prediction in a GIS Format. Proc 16th
Intern. Symp. Rem. Sens. Environment, Argentina, 89-103 pp.
Taiwan Roc, 2001. Soil Conservation Practices for Slopelands. Cooperative agency for this topic; Dept. Soil and Water Conservation, National Pingtung University of Science and Technology, Pingtung, Taiwan.
Wishmeier, W.D. and D.D. Smith, 1978. Predicting Rainfall Erosion Losses. A guide to conservation planning. USDA, Agriculture Handbook, No. 537.