FINAL REPORT
VULNERABILITY AND ADAPTATION
ASSESSMENT TO CLIMATE CHANGE IN
BANDAR LAMPUNG CITY
ii EXECUTIVE SUMMARY
In the future, a changing climate brought about by global warming is estimated to create new patterns of risk, and higher risks generally. Sea level rise due to melting glaciers and polar ice and thermal expansion will contribute to the increase of coastal flooding. Bandar Lampung as a coastal city will be impacted seriously by climate change and sea level rise. At present, some of coastal areas are already affected by sea level rise. Floods and drought also occur quite often. Government of Bandar Lampung City has implemented various program and also developed medium and long-term strategies to manage hazards. Plan for improving infrastructure for climate hazard control such as drainage system and dike has been prepared. However, under changing climate with the increasing frequency and intensity of extreme climate events the current design may not be very effective for managing future climate hazards. Therefore it is also very important to consider climate change in designing climate hazard control system.
ISET under the Asian Cities Climate Change Resilience Network (ACCCRN) with the support from the Rockefeller Foundation, coordinate a study on vulnerability and adaptation assessment to climate change conducted by MercyCorps, URDI and CCROM SEAP-IPB at Bandar Lampung. The study aims (i) to assess current and future climate variability in Bandar Lampung, (ii) to assess vulnerability and adaptive capacity as well as current and future climate risk at Kelurahan level, (iii) to identify direct and indirect impact of climate hazards now and in the future at
Kelurahan level, (iv) to identify the most vulnerable areas and social groups, and dimensions of vulnerability, including adaptive capacity of community to climate change impact, (v) to identify institutional and governance issues that may affect the resilience of the city to current and future climate risk, and (vi) to develop initial recommendations for Bandar Lampung for increasing resilience of the city to current and future climate risk.
BANDAR LAMPUNG CITY PROFILE AND CLIMATE
Bandar Lampung is the capital of Lampung Province. Bandar Lampung is geographically located at 5o20 '- 5o30' latitude and 105o 28'-105o37' longitude. Bandar Lampung has an area of 19,722 hectares consisting of 13 sub-districts (kecamatan) and 98 village (Kelurahan ). The city is traversed by two great rivers namely Way Kuala and Kuripan, and 23 small rivers. All of these rivers form a watershed located in the area of Bandar Lampung and most of it lead up to Lampung Bay. Several artificial drainage networks connect river system in this region. The function of this drainage network is to reduce surface runoff as a result of excessive rainwater. Drainage network systems that have been installed in Bandar Lampung include Teluk Betung, Tanjung Karang, Panjang and Kandis.
Citizens of Bandar Lampung fulfil their needs of clean water through regional water company (PDAM) and by retrieving shallow/deep ground water from dug wells. At present, the PDAM is only able to serve 32% of the total citizens. The depth of dug wells is approximately 30 to 50 meters from the soil surface.
iii will not directly hit the beach area. However, in some coastal areas, there has been abrasion caused by waves. In some locations, coastal areas are densely populated area. To meet the demand for housing, citizens build homes in the reclamation area thus causing accretion. Many of the settlers do not have legal evidence of land ownership. This condition will be one of serious problem in realizing the Bandar Lampung Government's plan to create Water Front City region.
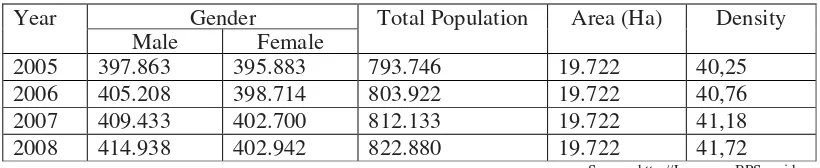
The number of population in Bandar Lampung in 2008 was 822,880 people with population density of about 42 people per ha. The population does not spread evenly. Kecamatan with high population density are in Central Tanjung Karang and South Teluk Betung. Based on age group, the largest proportion of the population of Bandar Lampung belongs to age group of 20-24 with population of 95, 597 people, followed by age group of 15-19 with population of 95, 537 people. The productive age (15-55 year olds) in Bandar Lampung reaches the number of 546,920 or 64.75 % of the total population.
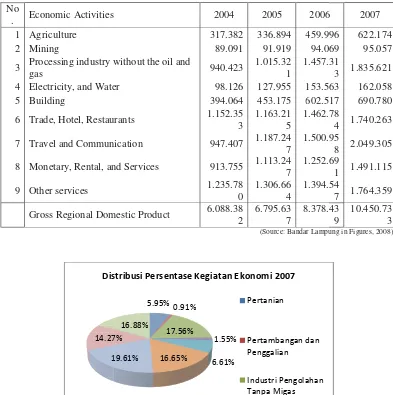
Sources of income of the communities vary. Trade is the residents’ primary livelihoods. Most of Bandar Lampung’s Gross Regional Domestic Product (GRDP) comes from transportation and communications (19.6%), processing industry (17.6 %), services (16,9%) and trade, hotels, restaurants (16,6%). Agriculture contributes only 5% to GRDP.
Based on analysis to long historical climate data, it was found that there was a change in trend and variability of climate variables such as temperature and rainfall. The most tangible evidence can be seen from the increasing trend of mean surface temperature over the last 100 years in the city. The change in seasonal rainfall was also found, i.e. a shift in the monsoon onset and a change in the frequency of extreme rainfall. Based on 14 global climate models (GCMs), it was indicated that wet season rainfall of Bandar Lampung City (DJF) in the future might slightly increase, particularly in area located in coastal region. In contrast, the dry season (JJA) rainfall might decrease. However, the analysis of future climate may need to be refined using climate models with high resolution such as RCM. The use of global model such as GCM will not be able to capture the local effect. Further analysis on extreme weather under changing climate should also be done. Many studies have shown that global warming will bring more extreme events.
IMPACT OF EXTREME CLIMATE EVENTS
Bandar Lampung City is very prone to natural disaster. Types of natural disaster that hit Bandar Lampung city include flood, land slide, high tide causing Robs, tsunami, earthquake and drought. Abrasion, erosion and sedimentation also occur in coastal areas. To evaluate socio-economic impact of climate related disasters, survey and interview was conducted at six Kelurahans, i.e. three for non-coastal Kelurahan
iv From the study, it was revealed that the occurrence of climate disasters (flood and drought) indirectly has the potential to change the order of the community’s social values. This can be seen from residents’ mutual cooperation or kinship in handling problems that occur in the community, work relationships, production transactions patterns and other social values. Social relationships between people at the time of the disaster are still going well. It can be seen from the activities to help each other when disaster strikes. In terms of working relationships, the impact of the disaster caused a declining of patron-client relationship that formerly was part of the social life of coastal communities. The disasters can also lead to increasing incidence of crimes such as theft.
Economic impact of the climate disasters can be evaluated from their impact on main job, and prices of some commodities. The disasters reduce work productivity especially if the main jobs of the society are vulnerable to disasters, such as the agricultural, fisheries etc. The impact of flooding in coastal areas is reducing working people in the fisheries sector, while in coastal areas; flood tides resulted in a decline in farmer incomes. Based on the sectors of the economy, the impact of floods caused loss to the infrastructure sector, housing and fisheries sectors. Meanwhile, drought caused losses in agriculture, fisheries and drinking water. The disaster also caused an increase in prices of some agricultural products like rice, crops and livestock, but this occurs only in the area surrounding the disaster.
Based on the sectors of the economy, flood disasters give the greatest impact on health sector, drinking water sector, housing, fisheries, and public works (the destruction of drainage facilities and other infrastructures). While the most affected sector by drought are drinking water, health, and agriculture. The problem of drinking water shortage increases during long dry season or during flood disaster. Impact of disasters on health is the increase in number of people infected by diseases, particularly malaria, and cough/flu/colds.
Because of the recurrence potential of extreme climate events that can cause disasters in the future; dense public housing condition with relatively indecent environment; and the government’s plans to build water front city in coastal areas, residents in coastal areas are willing to move as long as they’re given facilities and decent houses and the relocation area is not far from the sea, so they can still do their current job (fishermen). Meanwhile some resident in non coastal areas feel reluctant because they are concerned about the availability of jobs. However, if the disaster is severe and forces them to relocate, they expect the government to provide housing and new jobs.
The impact of the disaster resulted in a change in behaviour as a form of adaptation. Adaptation performed by residents during floods are diverse, ranging from staying at home, relocating to un-flooded areas, making embankments, deepening water channels, raising the floor level, adding food and fuel supplies. Drought adaptation in the forms of buying water for daily needs, reducing water consumption, pumping water from the nearest source, relocating to non-flooded areas, holding a ritual to ask for rain.
v income is done in two ways, first by income diversity, which is a combination of livelihoods, on farm and off farm owned by a person. Usually Off farm activities are side jobs besides main jobs. The second is by empowering members of the family, such as wives and children who have grown up.
To better prepare for managing disaster risk, communities expect that early warning system on disasters is in place. However, most of the residents confessed that they have never got any information about the climate or early warning from the government, EWS (Early Warning System), or other related institutions and there is no disaster handling institutions in their area.
This illustrates the lack of government response to the disaster in the community. Most of the residents obtain information on climate forecasts traditionally from traditional leaders and the community leaders. Residents also receive forecast information through the medium of television. Based on some types of disaster-related information, the information on disaster warning is more useful than other information.
CLIMATE RISK LEVEL OF ‘KELURAHAN’
Level of risk of a system to a disaster or extreme climate event (ECE) will depend on capacity of the system to cope with the events (called coping capacity index) and likelihood of the ECE to occur. This study evaluated the level of climate risk at
Kelurahan (village) level. The coping capacity index is developed based on vulnerability and adaptive capacity index of the Kelurahan. The vulnerability and capacity index of Kelurahan is measured using a number of socio-economic and biophysical indicators. Kelurahan in which many of its household/ building located in river bank, source of drinking water mostly not from PDAM (piping system), high density population, many poor people and big portion of Kelurahan area near the river and coastal with less green open area will be more vulnerable (high vulnerability index) than Kelurahan with less household/building in the river bank, low population density, get better services from PDAM, less poor people, and small portion of Kelurahan area near the river and coastal with more green open area (low vulnerability index). The consequences (damage, economic loss etc) caused by events will be severe in Kelurahan having high vulnerability index. However, the consequence cased by the events in the high vulnerable Kelurahan would be less if it has high adaptive capacity. Kelurahan with high adaptive capacity index is
Kelurahan where many of its households are well educated, main income source of
communities not sensitive to climate hazards (e.g. trading is much less sensitive than agriculture) and has better health facility and road infrastructure. In this study, we normalized all the scores of the indicators in order to have index of vulnerability and capacity range from 0 to 1.
To classify the Kelurahan based on their coping capacity index, the vulnerability (VI) and capacity index (CI) of each Kelurahan were subtracted by 0.5. As the normalized VI and CI values range from 0 to 1, by subtracting the index values with 0.5, the VI and CI will range from -0.5 to +0.5. The relative position of Kelurahan
vi certain hazards, the impact would be more severe compare to Kelurahans Situated in Quadrant 1. To assess the change of VI and CI in the future, we only consider the change of population density (based on government projection), non-green opened area, and education (based on spatial planning or RTRW) since other data is not available. Factors used for normalizing the score of these corresponding indicators in 2025 and 2050 were the same as those of the baseline year 2005.
Figure1. Classification of the villages based on their coping capacity index (quadrants 1 to 5) and number of Kelurahan that are situated in each Quadrant at
Current Condition (2005)
The analysis suggested that at present about 14.2% of Kelurahans have high coping capacity index (Kelurahans with high vulnerability and low capacity index or high coping capacity index), 5.1% in Quadrant 36.7% in Quadrant 22.4% in Quadrant 2 and 21.4 % in Quadrant 1 (Kelurahan with low vulnerability and high capacity index). Kelurahan at Quadrant 5 include Bumi Waras, Garuntang, Gunung Terang, Kangkung, Kedaton, Kota Karang, Panjang Selatan, Perwata, Sepang Jaya, Srengsem, Tanjung Senang, Teluk Betung, Way Kandis, Waydadi. In 2025 and 2050, 6-7 Kelurahans in Quadrant 5 will move to Quadrant 4 and 3 indicating that there is an improvement of its coping capacity index. However, coping capacity index of some Kelurahans in Quadrant 3 may change to Quadrant 4 in the future (Figure 2). This suggests that coping capacity of these Kelurahans would decrease in the future (Figure 3).
High Vulnerability Index
Low Vulnerability Index
High Capacity Index Low Capacity
Index
5
1 2
4
3
+0.25 +0.50
-0.50 -0.25
-0.50 -0.25 +0.25 +0.50
14 kelurahans 5 kelurahans
36 kelurahans
vii
Figure 2. Number of Kelurahans according to the coping capacity index (quadrant 1-5) at present and in the future (2025 and 2050)
Figure 3. Coping Capacity of kelurahan at Bandar Lampung
To define level of risk of the Kelurahan to the impact of climate change was defined as a function of the probability of unexpected (extreme) climate event to occur and the consequence of the events if it occurs. As describe previously, we can expect that Kelurahans with high vulnerability but low capacity indices (at quadrant 5) will be impacted more severe by the extreme events than those with low vulnerability and high capacity indices (quadrant 1). Thus we can define that the climate risk will be very high in Kelurahan at Quadrant 5 if probability of the extreme climate events to occur in these Kelurahan is high. Climate risk will be very low in Kelurahan at Quadrant 1 and the probability of the extreme climate events to occur in these
viii To allow multiple climate hazards being accommodated in the climate risk assessment, we developed composite climate hazard index (CCHI). The types of climate hazards include flood, drought, landslides, and sea level rise. We classified the climate hazard index (index values ranges from 0 to 4.5) into three categories, i.e. less than 2.0, between 2.0 and 3.5 and more than 3.5. Kelurahan with CCHI of 4.5 means that all area of this Kelurahan is exposed to flood and drought, and land slide every year and it is completely inundated when robs occur. Kelurahan with CCHI of zero means that none of the hazards occur in the Kelurahan. We used the rainfall outputs from 14 general circulation models (GCM)1 run under high emission scenarios (SRESA2) and low emission scenarios (SRESB1)2.
The study suggested that in 2005, the CCHI in most areas of Bandar Lampung was mostly less than 1.0. In the future, A2 scenario, areas of index> 2 has decreased in 2025, but increased slightly in 2050. Kelurahan with high CCHI both at present and in the future is Kelurahan Gunung Mas, Teluk Betung Utara Sub-district.
Furthermore, we classified the level of climate risk of the Kelurahans based on their coping capacity index and CCHI (Table 1). The climate risk maps of the Bandar Lampung by Kelurahan were produced by overlaying the coping capacity index map and CCHI under current and future climate as shown in Figure 2.
Table 1. Matrix of Climate Risk according the coping capacity index and composite
climate hazard index
Coping Capacity Index
(Quadrant)
Composite Climate Hazard Index (CCHI)
More than 3.5 Between 2.0 and 3.5 Less than 2.0
5 Very High (VH) High (H) Medium to High (M-H)
4 High (H)
Medium to High
(M-H) Medium (M)
3 Medium to High (M-H) Medium (M) Medium to Low (M-L)
2 Medium (M) Medium to Low (M-L) Low (L)
1 Medium to Low (M-L) Low (L) Very Low (VL)
The result of analysis suggested that there are no Kelurahan with Very High (VH) Climate Risk Category at present (baseline conditions). The highest category is only Medium to High (M-H). There are about 14 Kelurahans (14.2%) with M-H risk category. These include Kota Karang and Perwata (Teluk Betung Barat Sub-district), Kelurahan Gunung Terang (Tanjung Karang Barat Sub-district), Kelurahan
Tanjung Senang and Way Kandis (Tanjung Senang Sub-district), Kelurahan
Waydadi (Sukarame Sub-district), Kelurahan Sepang Jaya and Kedaton (Kedaton Sub-district), Kelurahan Kangkung, Bumi Waras, kankung and Teluk Betung (Teluk Betung Selatan Sub-district) and Kelurahan Panjang Selatan and Srangsem (Panjang Sub-district). The remaining are 5 Kelurahans (5.1%) as M (Medium) risk,
1 General Circulation Model is a numerical representation of the climate system based on the physical, chemical and biological
properties of its components, their interactions and feedback processes, and accounting for all or some of its known properties.
2 Concentration of GHG in the atmosphere in 2025, 2050 and 2100 under the SRESA2 would be about 440, 535, 825 ppm
ix
36 Kelurahans (36.7%) as L-M (Low to Medium) risk, 22 Kelurahans (22.4%) as L
(Low) risk and 21 (21.4%) Kelurahans as VL (Very Low) risk. In the future (2025 and 2050), more Kelurahans will be exposed to higher climate risk, particularly under scenario SRESB1 (Figure 4). There would be two Kelurahans would move from M-H to High climate risk category, namely kelurahan Gunung Mas at kecamatan teluk Betung Utara dan kelurahan Garuntang at kecamatan Teluk betung selatan. While many of Kelurahans with L-M risk category would move to Medium risk category (Figure 5).
x
Figure 5. Classification of Kelurahan based on their level of their exposure to climate risk (A)& (D) Climate risk baseline, (B) Climate risk A2 2025, (C) Climate
risk A2 2050, (E) Climate risk B1 2025, (F) Climate risk B1 2050
A
F E
D
xi The above analysis demonstrated that how change in socio-economic and biophysical conditions will change coping capacity of the Kelurahans. Adaptation programs should be prioritized in Kelurahan with high vulnerability index and low capacity index and being exposed or potentially exposed to high climate hazard index. To reduce the level of risk of Kelurahan to the impact of climate change, the infrastructure and community development programs should be directed to improve socio-economic and biophysical indicators shaping the vulnerability and adaptive capacity of the Kelurahans.
GOVERNANCE AND INSTITUTIONAL SYSTEM
Governance and institutions are two determinant factors affecting the resilience of the city to climate change. Good governance and strong institutions will lead to climate change resilience city. There are three important aspects needs to be assessed to assess the resilience of the city to climate change. The first is how the stakeholders play their role in managing climate risk. The second is what are current initiatives and programs (short and long term) to cope with climate risks and how effective they are. Third is what is the capacity of local government and institutions to integrate climate change into short and long term development planing.
From the analysis it was revealed that the management of climate change in City of Bandar Lampung involve stakeholder both from internal and external of the city. Each stakeholder has their own roles and contribution to adapt and strengthen community to climate change. This partnership is a pre-condition to create community that has capacity to adapt to climate change. Overall, local government of Bandar Lampung plays the major roles in climate change both for financial support and implementing program. While the role of provincial government claims not too significant, but it has more roles in coordinating programs and policy from some cities. However, coordination among stakeholders and sectors should be strengthened in order to gain maximum benefits of the program to environment and community.
There are a number of programs and plans prepared by the government to address natural hazards in the city. Current initiatives done by local government as response to disaster management was formulating program and action plan in reducing hazard risk through an intensive study in 2008. Beside the action plan, Bandar Lampung city government has established a Local Disaster Management Board in November 2009 although the board is not yet effective on program implementation.
On the other hand, the city spatial planning of Bandar Lampung might not consider climate change issues. Improper spatial plan (RTRW) will expose the city to higher climate risk in the future. Some problems that potentially cause the difficulty to implement climate proof spatial planning include inconsistency in the implementation of spatial planning, land use change such as areas along the river and others. However, there are room to provide inputs on climate change issues as RTRW Kota Bandarlampung is now on going revision.
xii across sectors and across regions in order to reduce the ineffectiveness project implementation. It is also pointed out the need to strengthening the City Team as champion to introduce and to integrate climate-changes issue into local planning document.
Current capacity of local government in integrating climate change into long-term development planning is still limited. This can be understood as climate change is a complex issue. Strong scientific works on climate change scenarios and climate change impacts in Bandar Lampung City will be required to assist local government in developing horizon plan of adaptation3 to climate change. Technical assistance and capacity building program for local government officers is required to enable them in developing horizon plan of adaptation.
There are a number of good conditions that positively can contribute the process of developing resilience city to climate change. In the existing laws and policies, it is clearly mentioned that the planning document should consider disaster mitigation and adaptation and climate-change issue. Bandar Lampung City Government will also formulate a new medium term development plan as resulted from the direct election which will be taken in June 2010. This is a good opportunity to integrate the climate change aspect into the document, so that it can be legally-binding. It needs political commitment and comprehensive understanding from the City Team to introduce the issues
ADAPTATION ACTION PLANNING
To have resilience city to climate change, it is importantto understandhow people, community, and sectorsresponse to current climate risk and how the current capacity should be developed to strengthen the capacity in managing future climate risk. Particular pilot projects may also be needed to get lesson learnt how we can effectively manage climate risk and use the lesson learnt to improve the climate change adaptation plan.
Based on study on the Community Based Vulnerability Assessment (CBA) in
Kelurahan Kankung, Pasir Gintung, Kota Karang; and also considering findings from surveys and literatures, we extract a number of lessons that may contribute in developing adaptation strategies. We learned some of the common qualities that seem to be present in the adaptation strategies at community levels:
♦ Quite simply ‘they work’: this is a very practical sense of adaptations that have real bearing and effect on their everyday lives.
♦ They are inexpensive and work with what materials are available:for the urban
poor, resources are scarce. They, for example, scavenged housing materials from a nearby scrap heap, or even community savings groups that collect very minimal amounts. These are what people can afford and that make sense to them.
♦ Accessible in times of need: In order to raise capital to recover from a flood a family may sell their television, motorbike or other fungible assets, rather than go through a bureaucratic process of applications that might imply lengthy
3 Horizon plan of adaptation relates to the lifetime of decision-making associated with a particular
xiii paperwork. Generally in the city people want access to resources quickly and this is a very important characteristic of adaptation strategies that work, they are easily managed and accessed.
♦ They don't rely upon big government projects or interventions: People have developed reliance upon community organization and initiatives that better respond to their needs within their own means. While government intervention is appreciated and instrumental local self-reliance seems to be a key characteristic of adaptation strategies.
♦ Adaptation to severe climate events must work together with other adaptation
strategies: Those most affected people by climate change may not know or care
to plan for it if it doesn’t benefit other aspects of their lives. Safety for its own sake is not a motivating factor, but when other benefits can be derived then the solution becomes workable.
♦ The whole is greater than the sum of the parts:Many of the adaptation strategies
are successful because they harness the collective efforts and strengths of people. People are concerned about each other and when this concern translates in collective action the results can be significant.
♦ Leveraging government support leads to better results: When communities are able to work together with local and city government (and vice versa) adaptation strategies seem to have been successful.
♦ More access to information can lead to better outcomes: Urban poor
communities are usually isolated and so successful adaptation strategies seem to increase access to information.
From the lesson learnt, we can summarize that successful adaptation at community level depends of several factors namely: (i) availability of funding, (ii) capacity levels, (iii) access to information, (iv) collaboration and engagement of local government, (v) migration and growth rates, (vi) public service delivery, and (vii) mobility. Bandar Lampung City is in a good position to move into resilience city as there are already (i) existing cases that exist and workable, (ii) possible social networks of people in similar situations with know how, (iii) local level neighbourhood government, (iv) city and national government programs (e.g.
PNPM), (v) materials and know-how from industries and economic activities, (vi) local leadership, (vii) community cohesion, and (viii) local civil society organizations, (ix) utilising existing resources (such as subsidies, sharing community narratives and networks, low cost financing of incremental housing improvements, Neighbourhood Vulnerability Index, detailed maps for local neighbourhood government use, alternative social safety nets, and broad based coalition to deal with climate change issues).
xiv For these pilot projects, the subject is vulnerable people who affected by climate change impact. The beneficiaries are women, children, elderly and men, both in terms of increased awareness, increase local capacity, influence local policy etc. The activities of pilot project are also designed to meet the following criteria: (i) replicability, (ii) addressing current and future risks, (iii) benefit to local community, (iv) innovation, (v) collaboration, (vi) scalability, and (vii) sustainability strategy. There are some additional criteria that should be conducted by the implementer of pilot project: (i) implementation of pilot project has to be related to the local problems at local administrative or cross border administrative communities on issues of environment, health, education, social, economy in which related to the impact of climate change, and (ii) implementation of pilot project directed for adaptation and response effort activities to the impact of climate change, such as: erosion, flooding, drought, landslide etc.
There are two selected pilot projects of Asian Cities Climate Change Program (ACCCRN) as contributing of development goals and addressing climate change impacts in Bandar Lampung:
(a) Participatory Design of Adaptation of Community Resilience in Kangkung and Kota Karang Sub-district, Bandar Lampung City to Climate Change by Lampung Ikhlas – Local NGO. The objective of the project is “to increase understanding, awareness, and participatory involvement of the community in order to build adaptive capacity to the climate change impacts”. Further, the targets of the project are (i) to build understanding and implement program activities for society in Kangkung and Kota Karang Sub-district to the impacts of climate change (within social, economy, and sustainable living sectors); (ii) to increase community capacity to adapt with climate change, (iii) to increase awareness of community in Kangkung and Kota Karang Sub-district to climate change and (iv) to help to increase community living standards in health sector, household economic resilience, environment management, and adaptation to climate change.
xv PREFACE
Indonesia has more than 17,000 islands, a coastline of more than 80,000 km, and the majority of population living in coastal zones where most of the country’s economic activity takes place. Indonesia is a country prone to natural disasters such as floods, droughts, storms, landslides, volcanic eruptions, and wild fires. In the future, a changing climate brought about by global warming is expected to create new patterns of risk, and higher risks generally. Bandar Lampung is one of the coastal cities that are exposed to such hazards.
At present, some of Kelurahans in Bandar Lampung City are already affected by climate related disasters, such as flood and drought and also robs. In the future, these extreme events may occur more frequent with higher intensity. Most of impacted Kelurahans of Bandar lampung are occupied by households with low income and live in poverty. They are highly vulnerable to the effects of environmental problems. City Government must take this into account seriously in developing its city development plan, while taking immediate actions response to immediate needs of the people in addressing their current problem. Therefore,
Vulnerability and Adaptation Assessment to Climate Change in Bandar Lampung City was implemented and results of this assessment are presented in this report.
This report describe in detail: (i) characteristics of current and future climate of Bandar Lampung, (ii) Impact of climate hazards and vulnerability of community to extreme climate events, and existing adaptive capacities, (iii) Maps of current and future vulnerabilities and capacity as well as climate risk at Kelurahan Level, (iv) Governance and institutional issues that may affect the effectiveness of the implementation of climate change programs, (v) Initial recommendations for increasing resilience of the City to current and future climate risk, and (vi) Recommendation on types of pilot projects for increasing communities’ resilience to the impact of climate change.
The study was supported by many institutions. Institute for Social and Environmental Transition (ISET) is managing the Asian Cities Climate Change Resilience Network (ACCRN) as part of the overall Rockefeller Foundation Climate Change Initiative. MercyCorp assists ISET in implementing the ACCRN program in Bandar Lampung in collaboration with Local Government (City Team), Urban and Regional Development Institute (URDI), Centre for Climate Risk and Opportunity Management in South East Asia and Pacific (CCROM SEAP) Bogor Agriculture University, local institutions, local communities, and local NGOs. Their supports during the implementation of the study are paramount and highly appreciated.
xvi Table of Contents
EXECUTIVE SUMMARY ... ii
PREFACE ... xv
Table of Contents ... xvi
List of Figures... xviii
Chapter 1 INTRODUCTION ... 1
1.1 Background ... 1
1.2 Objectives ... 2
1.3 Outputs ... 2
Chapter 2 BRIEF DESCRIPTION OF BANDAR LAMPUNG CITY PROFILE AND CONDITION OF RESPONDENCE ... 3
2.1 Geographical Location and Context ... 3
2.2 Municipal Administration ... 3
2.3 Resource Base ... 4
2.3.1 Water resources ... 4
2.3.2 Coastal areas ... 5
2.3.3 Land use ... 5
2.4 Pattern of regional development and function of the City ... 7
2.4.1 City Are Sections (BWK) ... 7
2.4.2 Water Absorption Area ... 8
2.4.3 Coastal Areas ... 9
2.4.4 Protected Areas ... 10
2.4.5 Utilization of Area ... 10
2.5 Current Demographic ... 12
2.5.1 Population Density ... 12
2.5.2 Population Structure ... 12
2.6 Core-Periphery Relationships ... 13
2.7 Economy and Livelihood... 13
2.8 Respondent Profiles ... 14
2.8.1 Social Context ... 15
2.8.2 Economic and Livelihoods ... 25
Chapter 3 CLIMATE HISTORY AND FUTURES IN BANDAR LAMPUNG ... 35
3.1 Extreme Climate and Weather Events... 35
3.1.1 The influences of ENSO and IOD on rainfall variability over the Bandar Lampung ... 35
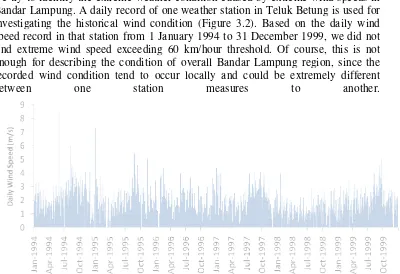
3.1.2 Extreme wind ... 36
3.2 Trends of Historical Climate in Bandar Lampung ... 37
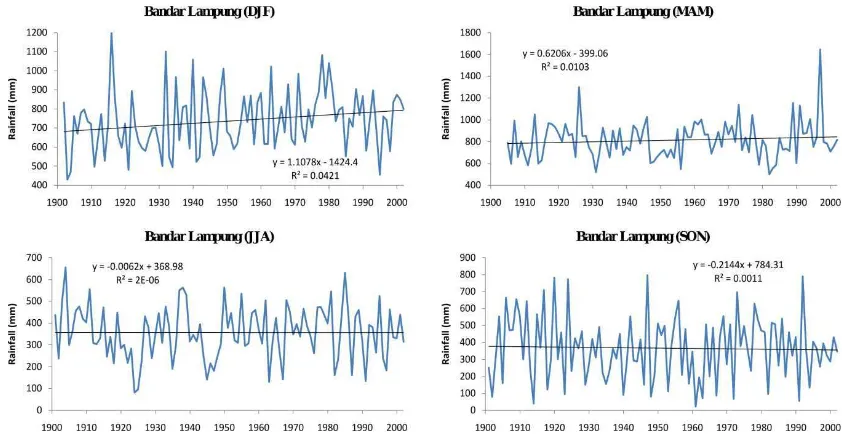
3.2.1 Rainfall ... 37
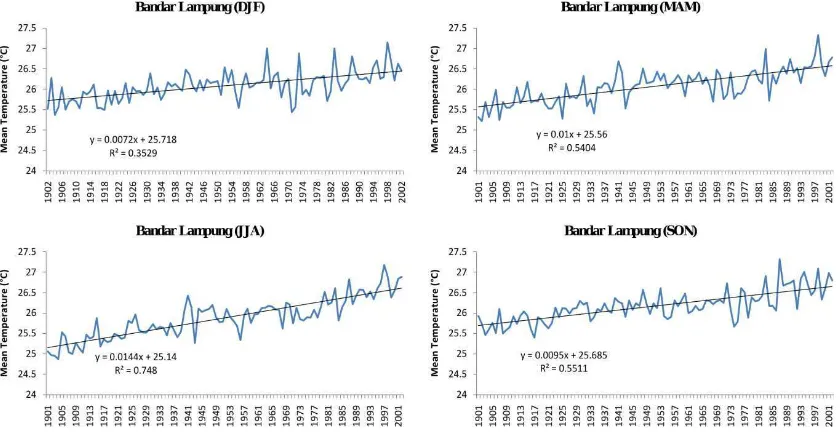
3.2.2 Temperature ... 39
3.3 Climate Change Projections ... 41
Chapter 4 IMPACT OF EXTREME CLIMATE EVENTS ... 45
4.1 Biophysical Impact of Extreme Climate Events ... 45
4.2 General Impact of Extreme Climate Events ... 46
4.3 Socio-Economic Impacts of Extreme Climate ... 48
4.3.1 Social impact ... 48
xvii
4.3.3 Impact on Health ... 56
4.4 Government and Residents’ Response to Disaster Due to Extreme Climate Events ... 58
4.4.1 Residents’ Response to the Presence of Disaster Handling Institutions58 4.4.2 Residents’ Respond To Disaster Information ... 59
4.4.3 Response On Relocation Issue ... 60
4.4.4 Identification of Adaptation Activities That Have Been Conducted by The Residents ... 61
4.4.5 Identification of Residents’ Adaptation ... 62
Chapter 5 VULNERABILITY AND ADAPTIVE CAPACITY MAPPING ... 68
5.1 Methodology for Vulnerability and Adaptive Capacity Mapping ... 68
5.2 Classification of Kelurahan (Villages) Based on Vulnerability and Capacity72 Chapter 6 CLIMATE RISK ANALYSIS ... 76
6.1 Methodology for Climate Risk Mapping ... 76
6.2 Classification of Kelurahan (Villages) Based on Level of Their Exposure to Climate Risk ... 79
Chapter 7 GOVERNENCE AND INSTITUTIONAL SYSTEM ... 83
7.1 Roles of Stakeholders and Existing Programs in Delivery and Management of Key Climate-Affected Sectors ... 83
7.1.1 Role of stakeholder in flood management ... 83
7.1.2 Role of stakeholder in water and sanitation ... 84
7.1.3 Stakeholder analysis ... 85
7.2 Assessment of effectiveness of current initiatives and programs (short and long term) cope with future climate risks ... 88
7.3 Assessment of Local Government Capacity and Institutional to Integrate Climate Change into Development Planning ... 93
CHAPTER 8: ADAPTATION ACTION PLANNING ... 96
8.1.Adaptation Strategies ... 96
8.2.Lessons Learned from the Communities ... 98
8.3.Pilot Project in Bandar Lampung as Adaptation Action Planning ... 100
8.4.Adaptation and Resilience ... 105
8.5.Specific Ideas to Strengthen Adaptive Capacity ... 107
CHAPTER 9. CONCLUSION AND RECOMMENDATION ... 111
References ... 114
xviii
List of Figures
Figure 2.1: The position of Bandar Lampung to Surrounding areas. ... 3
Figure 2.2:Map of Bandar Lampung Administration ... 4
Figure 2.3:Distribution of changes in land use/cover in Bandar Lampung in 1992 and 2006 ... 6
Figure 2.4:Distribution of Economic Activities in Bandar Lampung, 2007 ... 14
Figure 2.5:Distribution of Educational Level Based on Its Classification in Observed Sub-Districts in Bandar Lampung, 2009. ... 17
Figure 2.6:. Distribution of Costal Residents Conducting Mutual Cooperation Activities Minimum Once A Year ... 22
Figure 2.7:.Distribution of Non-Coastal Residents’ Participation Level in Mutual Cooperation Based on Implementation Frequency, 2009 ... 22
Figure 2.8:.Distribution of Residents’ Participation in Mutuial cooperation Activities in Observed Sub-Districts in Bandar Lampung, 2009. ... 23
Figure 2.9:.Distribution of Residents’ Participation in Several Social Activities in Observed Sub-Districts in Bandar Lampung, 2009 ... 24
Figure 2.10:.The Availability of Facilities on Observed Sub-Districts in Bandar Lampung, 2009 ... 25
Figure 2.11:.Distribution of Residents’ Household Income Based on Fixed and Additional Income in Observed Sib-Districts in Bandar Lampung, 2009 ... 30
Figure 3.1:.Series of seasonal rainfall over Bandar Lampung. ... 36
Figure 3.2:..A daily record of one weather station data in Teluk Betung ... 36
Figure 3.3:.Spatial patterns of seasonal rainfall trends over Bandar Lampung. ... 37
Figure 3.4:.Trends of seasonal rainfall in Bandar Lampung city (105.15E-105.34E, 5.51S-5.34S) extracted from CRU TS2.0 dataset. ... 38
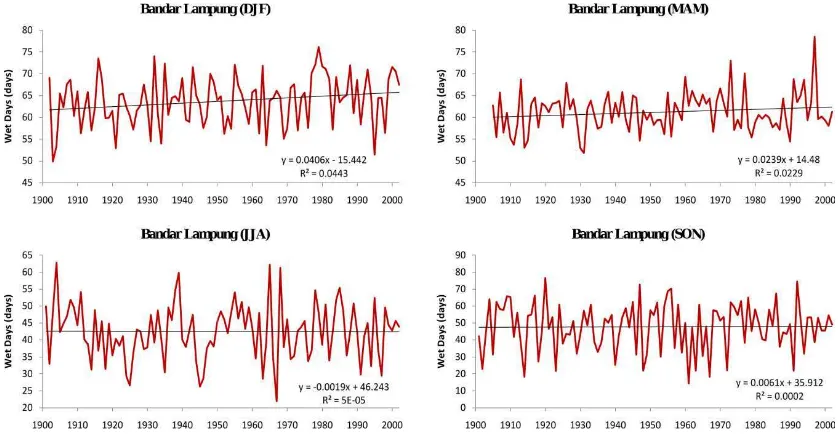
Figure 3.5:.Trends of seasonal wet days frequency in Bandar Lampung city (105.15E-105.34E, 5.51S-5.34S) extracted from CRU TS2.0 dataset. ... 39
Figure 3.6:..Low-frequency component of seasonal rainfall in Bandar Lampung defined by a simple 13-year moving average ... 39
Figure 3.7:..Trends of seasonal mean temperature in Bandar Lampung city (105.15E-105.34E, 5.51S-5.34S) extracted from CRU TS2.0 dataset. ... 40
Figure 3.8:.Trends of seasonal daily maximum temperature in Bandar Lampung city (105.15E-105.34E, 5.51S-5.34S) extracted from CRU TS2.0 dataset. ... 40
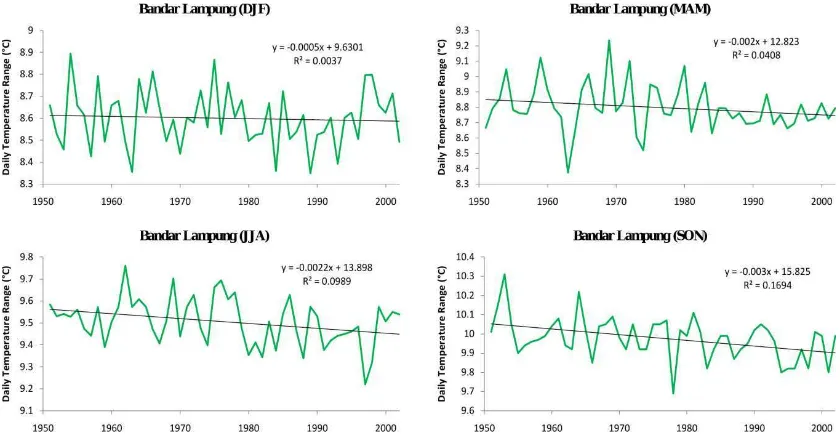
Figure 3.9:.Trends of seasonal daily temperature range in Bandar Lampung city (105.15E-105.34E, 5.51S-5.34S) extracted from CRU TS2.0 dataset.. ... 41
Figure 3.10:.Probability to have rainfall more than Q3 in wet season (DJF) and less than Q3 in dry season (JJA) under two emission scenarios ... 44
xix
Figure 4.2. Impact of Flood and Drought on Main Job in Observed Sub-Districts in
Bandar Lampung, 2009... 52
Figure 4.3.The Amount of Loss From Main Jobs Due To Dlood and Drought in
Observed Sub-Districts in Bandar Lampung, 2009 ... 53
Figure 4.4.Flood Impact On Side Jobs As Fishpond Farmers in Observed
Sub-Districts In Bandar Lampung, 2009 ... 54
Figure 4.5.Amount of Loss Of Side Job As Fishpond Farmers in Observed
Sub-Districts in Bandar Lampung, 2009 ... 54
Figure 4.6. Loss Caused By Floods Based on Sectors in Bandar Lampung Bandar
Lampung, 2009 ... 55
Figure 4.7. Loss Caused By Drought Based On Sector in Bandar Lampung, Tahun
2009 ... 55
Figure 4.8.Price Increase in Some Agricultural Commodities in Observed
Sub-Districts in Bandar Lampung, 2009 ... 56
Figure 4.9.The Amount of Cost Paid By Residents (in IDR) ... 58
Figure 4.10.The Percentage of Medium Used to Provide Forecast Information ... 59
Figure 4.11.Adaptation Occurring in Coastal and Non-coastal Areas During Flood
in Lampung ... 62
Figure 4.12.Residents Adaptation to Drought in Observed Sub-Districts in Bandar
Lampung ... 64
Figure 5.1. Coastal area which is affected by tide + 100 m ... 71
Figure 5.2. Determination of the highest order stream (A) & estimation of the wide
of its water surge (B) ... 72
Figure 5.3.Splitting the villages based in their vulnerability and capacity indices ... 73
Figure 5.4. Vulnerability and capacity indices of Kelurahan ... 73
Figure 5.5. Coping capacity index of Kelurahan of Lampung City ... 74
Figure 6.1.Box plot of monthly rainfall in dry and wet season during hazard and
no-hazards years. ... 79
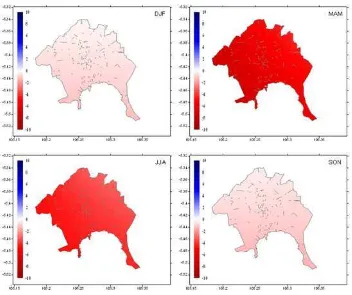
Figure 6.2.. Composite Climate Hazard Index of Bandar Lampung. Note: (A) & (D) Climate Hazard Baseline, (B) Climate Hazard A2 2025, (C) Climate Hazard A2
2050, (E) Climate Hazard B1 2025, (F) Climate Hazard B1 2050. Note: Green
(<0.75), Yellow (1.75 – 1.50), Red (>1/50). (See appendix 1 for detail) ... 80
Figure 6.3. Classification of Kelurahan based on their level of their exposure to climate risk (A)& (D) Climate risk baseline, (B) Climate risk A2 2025, (C) Climate risk A2 2050, (E) Climate risk B1 2025, (F) Climate risk B1 2050 (See appendix 1
for detail) ... 81
Figure 6.4. Number of Kelurahan by climate risk index category ... 82
Figure 7.1:Integrated System of Planning and Budgeting at National and
Regional/Local Levels ... 89
Figure 8.1:LFA Problem Analysis ... 102
xx
List of Tables
Table 2.1:. Name of sub-districts (kecamatan), area and number of villages
(kelurahan) in Bandar Lampung City ... 4
Table 2.2:. Land use/cover classification for 1992 and 2006. ... 6
Table 2.3:. Major Land Use/Cover Conversions from 1992 to 2006 ... 7
Table 2.4:. Functions of City Area Section (BWK) in Bandar Lampung ... 8
Table 2.5:. Structure of Bandar Lampung Citizens (Bandar Lampung Statistic Center Agency, 2009)... 12
Table 2.6:. Gross Regional Domestic Product (GRDP) of Bandar Lampung Based on Field of Industry and Market Price in 2004-2007 ... 14
Table 2.7:. Educational Level Distribution in Observed Sub-districts in Bandar Lampung, 2009 (%) ... 15
Table 2.8: Educational Leval Distribution Based on Livelihoods in Observed Sub-Districts in Bandar Lampung, 2009 (%) ... 16
Table 2.9: Distribution of Family Member Involved in Family Decision-Making in Observed Sub-districts in Bandar Lampung, 2009 (%) ... 18
Table 2.10:. Distribution of Family Member Participation in Joining Trainings in Observed Villages in Bandar Lampung, 2009 (%) ... 19
Table 2.11:Distribution of Family Member Participation in Community Organizations in Observed Sub-Districts in Badar Lampung, 2009 ... 20
Table 2.12:. Residents’ Livelihoods in Observed Sub-Districts in Bandar Lampung, 2009 (%) ... 27
Table 2.13:Distribution of Working Family Member in Observed Sub-Districts in Bandar Lampung, 2009 (%) ... 28
Table 2.14:. Level of Residents’ Household Income in Observed Sub-Districts inj Bandar Lampung, 2009 (%) ... 29
Table 2.15:. Residents’ Expenditure in Observed Sub-Districts in Bandar Lampung, 2009 (%) ... 30
Table 2.16:. The Average Size of Buildings and Land Owned by Residents in Observed Sub-Districts in Bandar Lampung, 2009 ... 31
Table 2.17:. Types of Wall Materials of Residents’ Houses in Observed Sub-Disticts in Bandar Lampung, 2009 (%) ... 32
Table 2.18:. Residents’ Asset Ownership Index of Home Appliances in Observed Sub-Districts in Lampung Tahun 2009 (%) ... 33
Table 2.19:Residents Access to Banks and Insurance in Observed Sub-Districts in Bandar Lampung, 2009 (%) ... 34
Table 2.20:. The Average Expenditure of Households For Installments, Savings, and Insurance in Observed Sub-Districts in Bandar Lampung, 2009 (IDR/ month) ... 34
xxi
Table 3.2Gas Concentrations (ppmv) ... 43
Table 3.3Temperature (oC) and Sea Level Rise (cm), with reference to 1990 ... 43
Table 4.1. Disaster Prone Locations in Kota Bandar Lampung ... 46
Table 4.2.. Description of Impact of Disasters on Social Values in Observed Sub-Districts in Bandar Lampung, 2009 ... 51
Table 4.3. Illnesses Occurring During Flood in Observed Sub-Districts in Bandar Lampung, 2009 ... 57
Table 4.4.. Illnesses Occurring During Drought in Observed Sub-Districts in Bandar Lampung, 2009 ... 57
Table 4.5.. Residents’ Perception On Various Disaster Related Information in Bandar Lampung, 2009 (%) ... 60
Table 4.6. Non-structural government activities in developing disaster handling abilities and residents’ response ... 62
Table 4.7.. Disaster Impact Befalling on Residents of Observed Sub-Districts in Bandar Lampung, 2009 ... 66
Table 4.8.. Summary of Residents Perception in Bandar Lampung Towards the Size of Disaster Impact and Handling Efforts Done ... 67
Table 5.1. Indicators used for defining Vulnerability and Capacity and the corresponding weights ... 68
Table 5.2. Indicator value according to types of main income source of community in the Kelurahan ... 69
Table 6.1.. Matrix of risk as a function of probability of unexpected event to occur and the consequences if the unexpected events occur. ... 76
Table 6.2.. Weight and formula for calculating climate hazards index ... 77
Table 6.3.. Matrix of Climate Risk according the coping capacity index and composite climate hazard index ... 77
Table 6.4.. Flood and drought hazard events in Bandar Lampung City ... 78
Table 7.1. Stakeholders that related to Flood and water-sanitation ... 84
Table 7.2. Stakeholder Roles and Contributions for Climate Change ... 85
Table 7.3.. Problems and alternative strategy in related to development planning and disaster management in Bandar Lampung ... 91
Table 7.4. Programs and activities related to climate for each sector ... 91
Table 7.5.. Budget Related to Climate Change 2008 ... 92
Table 7.6.. Cost Sharing in NUSSP Project (in IDR Billion) ... 93
Table 7.7: Assessment of Local Government and Institutional Capacity to Integrate Climate Change into Development Planning ... 93
1
Chapter 1
INTRODUCTION
1.1
Background
In the future, a changing climate brought about by global warming is estimated to create new patterns of risk, and higher risks generally. Sea level rise due to melting glaciers and polar ice and thermal expansion will contribute to the increase of coastal flooding. Increasing intensity of tropical cyclones observed in recent decades may be tied to increasing sea surface temperatures. By impacting the hydrologic cycle, global warming is expected to alter climatic ranges, shift regional climatic averages, resulting in shifting of climate zones, and lead to a higher frequency and amplitude of weather events. Climate variability and change occurring against a backdrop of increasing global population and globalization of economic processes may be expected to lead to increased competition over resources and new vulnerabilities. With the increase of climate risk, many countries, particularly least developed and developing countries may have difficulties to achieve the Millennium Development Goals related to poverty, hunger and human health.
Indonesia is a country already prone to natural disasters such as floods, droughts, storms, landslides, volcanic eruptions, and wildland fires. Indonesia has experienced more frequent and severe climate-related hazards in recent years. Floods and windstorms accounted for 70% of total disasters and the remaining 30% of the total disasters are accounted for by droughts, landslides, forest fires, heat waves, storm,
robs (flood due to high tides) and others. Within the period of 2003-2005 alone, there were about 1,429 disaster incidences in Indonesia. About 53.3 percent were hydro-meteorological disasters (Bappenas and Bakornas PB, 2006)
Rising sea levels pose a further risk. Approximately 24 small islands in Indonesian are already submerged (Ministry of Marine Affairs and Fisheries, 2007). This vast archipelago is extremely vulnerable to sea level rise with over 17,000 islands, a coastline of more than 80,000 km, and the population majority living in coastal zones where most of the country’s economic activity takes place. Currently, around 42 million people in Indonesia live in areas less than 10 meters above the average sea level (Government of Indonesia, 2007). Most of households living in the coastal area has an income of between the US$2 and US$1-a-day poverty lines (Indonesia Poverty Analysis Program, 2006), far too many Indonesians live in poverty and remain highly vulnerable to the effects of climate change. The high population densities of Indonesia will further increase its sensitivity to climate hazards.
2 not be very effective for managing future climate hazards. Therefore it is also very important to consider climate change in designing climate hazard control system.
1.2
Objectives
This study was aimed
• To asses current and future climate variability in Bandar Lampung city
• To assess vulnerability and adaptive capacity as well as current and future climate risk at Kelurahan (villages) Level
• To identify direct and indirect impact of climate hazards now and in the future at
Kelurahan level.
• To identify the most vulnerable areas and social groups, and dimensions of vulnerability, including adaptive capacity of community to climate change impact
• To identify institutional and governance issues that may affect the resilience of the city to current and future climate risk.
• To develop initial recommendations for Bandar Lampung City for increasing resilience of the city to current and future climate risk
1.3
Outputs
The final outputs of this work will be a report describing
• Characteristics of current and future climate of Bandar Lampung City
• Impact of climate hazards and vulnerability of community to extreme climate events, and existing adaptive capacities
• Maps of current and future vulnerabilities and capacity as well as climate risk at
Kelurahan Level
• Governance and institutional issues that may affect the effectiveness of the implementation of climate change programs
• Initial recommendations for increasing resilience of the City to current and future climate risk.
3
Chapter 2
BRIEF DESCRIPTION OF BANDAR
LAMPUNG CITY PROFILE AND
CONDITION OF RESPONDENCE
2.1
Geographical Location and Context
City of Bandar Lampung is the capital of Lampung Province and is geographically located at 5 o 20 '- 5 o 30' latitude and 105 o 28 '-105 o 37' longitude. The city is located at Lampung Bay and at the southern tip of Sumatra Island and has an area of 19,722 hectares (Figure 2.1). The city is bordered by: 1). Sub-district (Kecamatan) of Natar of South Lampung Regency to the north, 2). Sub-districts of Padang Cermin and Ketibung and Lampung Bay to the south, 3). Sub-districtTanjung Bintang of South Lampung Regency to the east and 4). Sub-districts of Gedung Tataan and Padang Cermin of Pesawaran Regency to the west.
Sumber: Google Earth, 2009 dan Citra Landsat ETM+, 2001
Figure 2.1: The position of Bandar Lampung to Surrounding areas.
2.2
Municipal Administration
4
Table 2.1:. Name of sub-districts (kecamatan), area and number of villages (kelurahan) in Bandar Lampung City
NO Districts Area (ha) Capital Number of Sub
Districts/ Kelurahan
1 Tanjungkarang Pusat 6.58 Palapa 11
2 Tanjungkarang Barat 15.14 Gedong Air 6
3 Tanjungkarang Timur 21.11 Kota Baru 11
4 Teluk Betung Utara 10.38 Kupang Kota 10
5 Teluk Betung Barat 20.99 Bakung 8
6 Teluk Betung Selatan 10.07 Sukaraja 11
7 Panjang 21.16 Panjang Selatan 7
8 Kemiling 27.65 Sumberejo 7
9 Kedaton 10.88 Kampung Baru 8
10 Rajabasa 13.02 Rajabasa 4
11 Tanjung Seneng 11.63 Tanjung Seneng 4
12 Sukarame 16.87 Sukarame 5
13 Sukabumi 10.64 Sukabumi 6
Jumlah 197.22 98
(http://www.bandarlampungkota.go.id)
Figure 2.2:Map of Bandar Lampung Administration (Source: http://www.bandarlampungkota.go.id)
2.3
Resource Base
2.3.1
Water resources
5 and most of it lead up to Lampung Bay. Several artificial drainage networks connect river system in this region. The function of this drainage network is to reduce surface runoff as a result of excessive rainwater. Drainage network systems that have been installed in Bandar Lampung include Teluk Betung, Tanjung Karang, Panjang and Kandis.
Citizens of Bandar Lampung fulfill their needs of water through regional water company (PDAM) and by retrieving shallow/deep ground water from dug wells. At present PDAM is able to meet only 27% of the total citizens of Bandar Lampung, while the remaining 73% still have to use water from dug wells. The depth of dug wells is approximately 30 to 50 meters from the soil surface.
2.3.2
Coastal areas
Bandar Lampung is an important port city for Sumatra region. Port city of Bandar Lampung is located in a bay-shaped beach so high waves caused by strong winds will not directly hit the beach area. However, in some coastal areas, there has been abrasion caused by waves.
In some locations, coastal areas are densely populated area. To meet the demand for housing, citizens build homes in the reclamation area thus causing accretion. This situation can become an obstacle in the zoning of the coastal areas. Under such conditions, the realization of the Bandar lampung Government's plan to create water
front city region should also take into account the costs to overcome the problem of
settlements in coastal areas, although many of the settlers do not have legal evidence of land ownership.
Center of economic activities in the Coastal and Beach areas in Bandar Lampung is focused on the Harbor Area.
2.3.3
Land use
6
Figure 2.3:Distribution of changes in land use/cover in Bandar Lampung in 1992 and 2006
Land function in Bandar Lampung has changed rapidly. In 1992 there were 4 types of land use/cover, but in 2006 it grew to 9 types. In 1992, the highest percentage of land use was dry land agriculture (60%) but in 2006 the number shrank to only 13.4% (Table 2.2).
Table 2.2:. Land use/cover classification for 1992 and 2006.
Land use/ cover type
1992 2006
1992 – 2006 area changed (ha)
Area
(ha) % Area (ha) %
Bush 416.2 2.1 81.8 0.4 -325.9
Plantation 3943.8 20.0 20.4 0.1 -3823.5
Settlement 2674.3 13.6 6899.8 35.0 4118.0
Bare land 0.0 0.0 610.3 3.1 594.8
Grassland 0.0 0.0 175.1 0.9 170.6
Dry land
agriculture 11873.7 60.2 2641.7 13.4 -8996.9 Mixed dry land
agriculture 0.0 0.0 8196.8 41.6 7988.1
Paddy field 0.0 0.0 250.9 1.3 244.5
Mining 0.0 0.0 31.1 0.2 30.3
No data 814.0 4.1 814.0 4.1 0.0
19722 100 19722 100
A more detail land use/cover changes in Bandar Bampung City is given Table 2.3. The table shows, for example, that over 14 years dry land agriculture has changed into 8 different types of land uses.
7
Table 2.3:. Major Land Use/Cover Conversions from 1992 to 2006
No From Class To Class 1992-2006 Area (ha)
Mixed dry land agriculture Paddy field 3. Plantation Settlement
Dry land agriculture Mixed dry land agriculture Paddy field
35.7 99.5 3605.0 90.9 4. Settlement Mixed dry land agriculture
Mining and primarily in the form of settlement. The high settlement area is to meet the high rate of population growth and urbanization (Bandar Lampung Regional Development Planning Agency, 2008).
2.4
Pattern of regional development and function of the City
Bandar Lampung as the capital city of Lampung Province and the center of government, with its high population growth and rapid development, has a very significant effect to the utilization of space and also to the surrounding regions. Zoning of area in Bandar Lampung is therefore become a strategic issue in the City Spatial Planning (RTRW). The current RTRW is RTRW for 2005-2015 (Bandar Lampung Regulation No. 4 /2004). This RTRW provides:
- Guidelines on management of protected and utilized areas - Guidelines on management of city area
- Guidelines on development of production and residential areas - Guidelines on facilities and infrastructures
- Guidelines on development of priority areas
2.4.1
City Are Sections (BWK)
Bandar Lampung is divided into 8 (eight) City Area Sections (BWK) in which each section has main and supporting functions. The reasons for the division are:
• Functions and dominance of activities in different regions of the city;
• The similarity of land use;
• The similarity of population density and building density;
8
• Existing physical and administrative boundaries;
• Limitation in service coverage capacity;
• Space structure.
Table 2.4:. Functions of City Area Section (BWK) in Bandar Lampung
Domain Main Functions Supporting Funcions
BWK A (Gedung BWK B (Sukarame) Large scale residential and
City-scale trade
Small Industries Center, Forest City Development, City Development Reserve and Service Center
BWK C (Panjang) Ocean Harbor Center, Trade, Terminal Products and
Trade / Services and Region Conservation
BWK H (Telukbetung) Government Center,
Wholesale Trade and coastal tourism
General Services, Housing, Small Industry and
Conservation
Source: Bandar Lampung RTRW, 2005-2015 In addition to the City Area Section (BWK) established, there are some special management areas in the zoning of Bandar Lampung, namely:)
2.4.2
Water Absorption Area
Water absorption management plan for Bandar Lampung is divided into 6 (six) zone areas:
a. Zone Area 1 (Recharged Area)
9
b. Zone Area 2 (Buffer Area)
In this zone there is a plan to build small and medium scale water enclaves (rain water reservoirs) and to apply the rules of open to building area ratio of 70%:30%. These zones are scattered in Sub-distict of Tanjungkarang Barat, Tanjungkarang Timur, Panjang, Tanjungkarang Tengah, Telukbetung Utara, and Telukbetung Selatan.
c. Zona Area 3 (Low Absorption Area)
In this area, water conservation is implemented by applying absorption wells in each building and/or by constructing man-made reservoirs of small and medium scales. Areas included in this zone are Sub-districts Kedaton, Sukarame and Tanjungkarang Barat.
d. Zona Area 4 (Medium Absorption Area)
In this area, building density level is significantly high and has reached the saturation point for residential area. Water is conserved by applying absorption wells to accommodate water from the built area. Areas of this zone are Sub-districts Tanjungkarang Tengah, Sukabumi and Tanjungkarang Timur.
e. Zona Area 5 (High Absorption Area)
This zone is dominated by dense residential area. Conservation pattern should apply absorption wells in every house with volume that accommodates all rain water from roofs and yards. Areas included in this zone are Sub-districts Sukabumi and Tanjungkarang Timur.
f. Zona Area 6 (Sea Water Affected Area)
This zone is located along Lampung Bay Beach including Sub-districts South Telukbetung Selatan and Panjang. The main function of this area is as a buffer or ground water absorption area from the threat of seawater intrusions.
2.4.3
Coastal Areas
Bandar Lampung coastal area extends for ± 27 km, which is located in BWK H (Telukbetung) and BWK C (Panjang). Administratively, the coastal area includes West Telukbetung Sub-district (Keteguhan, Kota Karang, Perwata and Sukamaju Villages), Telukbetung Selatan Sub-district (Way Lunik, Garuntang, Ketapang, Pesawahan, Telukbetung, Kangkung, Sukaraja, Bumiwaras and Pecoh Raya Villages) and Panjang Sub-district (Panjang Selatan, Panjang Utara, Pidada, and Srengsem Villages). Coastal area zoning is adopted through the concept of Integrated Coastal Area Management, which is the concept of zoning and revitalization of community-based coastal areas and divides the coastal areas into zones according to existing potential, condition and area structure.
10 In order to further arrange the coastal areas, Bandar Lampung Fisheries and Marine Agency has conducted Advanced Studies of Bandar Lampung Coastal Area Zoning. The study has produced zoning composition plan for buildings and non buildings on the coastal areas of Bandar Lampung that is based on: Zone A Revitalization Area; Zone B Ports, Warehouses and Integrated Industry Area; Zone C Integrated Business Area and Zone D Integrated Tourism Area. Thus the concept of Water Front City in Bandar Lampung has been made and continues to be finalised.
In the planning of Bandar Lampung Coastal Areas, sea transportation system is also one of the major components. Port area located in the southern tip of Bandar Lampung has contributed to the dynamics of shipping traffic in this area. This port is the only Port for Export Activities owned by Bandar Lampung. Increase in export goods through this port definitely could increase the port levy from the harbor. This facility is one of the supporting factors of trade in Bandar Lampung.
The port of Panjang is a natural port relatively protected from the sea waves, and according to its hierarchy it is an International Port as it is open for foreign trade.
2.4.4
Protected Areas
Management of protected areas in Bandar Lampung is divided into 5 (five) zone areas, namely:
a. Water Absorption Zone
This area is an area that provides protection to the areas underneath it. This zone area covers the hills/mountains in West Tanjungkarang, Langkapura, West Telukbetung and buffer areas (Bandar Lampung 17 & 19 Register).
b. Local Protected Zone
This zone is divided into 3 (three) zone areas, namely (i) coastal border, (ii) river border, and (iii) Heritage & Sciences Reserve Park. Areas included in the zone are areas along the Bay of Lampung, all rivers in Bandar Lampung, Ancient Sites in the areas of Kedamaian, Negeri Olok Gading & other places recommended by the Government of Bandar Lampung.
c. Disaster Prone Area
Included in this area is landslide-prone hills and flood-threatened rivers/valleys and areas along the Teluk Lampung Beach.
d. Catchment Area
This area is a catchment area for the Way Rilau Regional Water Company that covers Register 17 area (Gunung Betung).
e. Flood Buffer Area
The flood buffer area covers Register 19 area.
2.4.5
Utilization of Area
11
a. Housing
Large, medium, and small housing development spread throughout the city and has residential land suitability outside protected areas. As for the improvement of housing quality, it includes slum areas, riverbanks, railroad sides, and fishing areas. Those areas are distributed in Tanjungkarang Tengah, Panjang and Telukbetung Selatan Sub-districts.
b. Service/Trade
Trade area development is divided into 5 trade spesifications, namely:
• Regional trade including South Telukbetung area.
• City scale trade including areas along city main roads in South Telukbetung and Central Tanjungkarang Districts.
• BWK scale trade including areas in each BWK center.
• Environmental scale trade including areas in each residential area.
• Street vendors aglomerating with city trade activities and BWK trade
c. Industry
Industrial zone covers Lampung Industrial Zone (KAIL). Industrial zone is in BWK C (Panjang) aglomerating with warehouse and port activities. Small industry Center is in BWK of Panjang, Sukarame, Gedong Meneng, and Langkapura. These unpolluted Home Industry are integrated with residential activities.
d. Government
The center government of the City is in BWK H (Telukbetung) while the center government in every sub-district/village level is in every sub-district/village.
e. Tourism
Beach tourism is in area of Lampung Bay, while city tourism is in city center, city and environmental parks, urban forests, city open green area (RTH) and man-made lakes.
f. Education
Higher education is in BWK A (Gedung Meneng). High schools are in every BWK center, Junior high schools and elementary schools are in the center of residential areas.
g. Social Facility
Facilities of health, religion, sports, and recreation are located in accordance with service hierarchy. Islamic Center is in BWK A (Jl. Soekarno – Hatta)
h. Open Green Area