Prediction of the seismic behavior of an underground railway
station and a tunnel in Napoli (Italy)
S. Fabozzi, V. Licata, S. Autuori, E. Bilotta, G. Russo, F. Silvestri
⇑University of Napoli Federico II, Napoli, Italy
Received 31 December 2016; received in revised form 14 March 2017; accepted 15 March 2017 Available online 9 April 2017
Abstract
The assessment of the seismic safety of underground structures, either tunnels or large station boxes, should not be overlooked espe-cially in densely populated areas, even with low to moderate seismicity.
For underground structures, an important issue is the estimation of the seismic actions acting on the structure; only few experimental evidences are available for multi-level propped walls. For tunnels, it is generally assumed that their seismic behavior in soft ground is governed by the surrounding soil, while the inertial load contribution of the underground structure itself is negligible. In both cases, recent numerical studies proved that advanced dynamic analyses can provide satisfactory interpretation of non-linear soil-structure inter-action during earthquakes.
In this paper, a real case study, represented by a large open multi-propped excavation and a circular segmented tunnel in a densely urbanized area of the city center in Napoli, has been used to investigate some of the mentioned aspects.
Accurate geotechnical characterization and choice of the reference input motions lead to a first estimate of the free-field ground motion, which was subsequently used for pseudo-static decoupled analyses.
For the complexity of both excavation geometry and staged construction, a full dynamic analysis was considered neither affordable nor reliable for the multi-propped station box; thus two conventional pseudo-static analyses, applying either a displacement-based or a force-based approach, were carried out.
In the case of the tunnel, the seismic increments of internal forces in the lining could be calculated through both a simplified pseudo-static analysis and a full dynamic analysis, showing a satisfying agreement.
Overall, the results of the study demonstrated that the seismic increments of internal forces in the diaphragm walls of the station and in the segmented lining of the tunnel were quite significant. The case study encourages improving the reliability of simplified methods based on the more advanced dynamic approaches.
Ó2017 Tongji University and Tongji University Press. Production and hosting by Elsevier B.V. on behalf of Owner. This is an open access article
under the CC BY-NC-ND license (http://creativecommons.org/licenses/by-nc-nd/4.0/).
Keywords: Underground structures; Tunnels; Diaphragm walls; Seismic behavior; Pseudo-static analysis; Dynamic analysis; Soil-Structure interaction
Introduction
The behavior of tunnels or large underground excava-tions in urban areas under seismic acexcava-tions is rather complex
and until two decades ago it was generally not considered as a major design issue. Only recently, experimental and numerical research has made some significant steps towards the comprehension of the mechanisms governing soil-structure interaction for embedded structures under seismic actions.
As far as large underground infrastructures are con-cerned, there are only a few cases where such structures were heavily damaged. It is worth mentioning the
impres-http://dx.doi.org/10.1016/j.undsp.2017.03.005
2467-9674/Ó2017 Tongji University and Tongji University Press. Production and hosting by Elsevier B.V. on behalf of Owner.
This is an open access article under the CC BY-NC-ND license (http://creativecommons.org/licenses/by-nc-nd/4.0/). ⇑ Corresponding author.
E-mail address:[email protected](F. Silvestri).
Peer review under responsibility of Tongji University and Tongji University Press.
www.elsevier.com/locate/undsp
ScienceDirect
sive case of Dakai Station, along the Kobe Rapid Railway line, that collapsed during the Kobe Earthquake (January, 17, 1995). Iida, Hiroto, Yoshida, and Iwafuji (1996) and Yoshida (1999)described the damage suffered by this sta-tion: the large span ceiling collapsed just above the plat-forms, as some supporting columns buckled, bringing down part of road running above it. The analysis of the case study showed that on one hand the relative displace-ment between the bottom and top slabs caused a large hor-izontal shear force on the central column, on the other hand the overburden soil mass also affected the response, adding inertial forces to the structure.
The main problem in the seismic assessment of such underground structures is the estimation of the earth pres-sure acting on the structure during an earthquake, that is influenced by many factors, among which the relative soil-structure flexibility that is often neglected in design.
As a matter of fact, only few experimental evidences are available for flexible retaining structures, among which case studies on physical models. They are generally limited to cantilevered walls or diaphragm walls with a single level of prop at the top (Conti, Madabhushi, & Viggiani, 2012), while actual excavations in urban environment often include multi-level propped walls. In the latter case, it has been demonstrated (Pitilakis & Tsinidis, 2014) that the earth pressure calculated for rigid walls is only an upper limit of the dynamic earth pressure, while stress concentra-tion at the slab levels cannot be captured, without a proper dynamic soil-structure interaction analysis. Dynamic anal-yses on multi-propped diaphragm walls are generally lim-ited to a couple of propping levels (e.g. Tropeano & Soccodato, 2014), i.e. at the wall head and at the bottom of the excavation, and show a strong dependency of the seismic behavior on the simulation of the construction stages as well as on the characters of the input motions (Soccodato & Tropeano, 2015).
As far as tunnels are concerned, it is generally assumed that their seismic behavior in soft ground is governed by the surrounding ground, while the inertial load contribu-tion of the underground structure itself is negligible (Hashash, Hook, Schmidt, & Yao, 2001). Hence changes of internal forces in the lining due to seismic shaking are generally calculated from the transient response of the ground. The tunnel lining structure undergoes deformation both in the transverse section (Hashash, Park, & Yao, 2005) and in longitudinal direction (Kawashima, 1999; St. John & Zahrah, 1987). The variation of internal forces induced in the tunnel lining during earthquakes can be cal-culated following several approaches that model in differ-ent ways the soil-structure interaction (Hashash et al., 2001; Pitilakis & Tsinidis, 2014).
Although existing guidelines suggest pseudo-static or uncoupled dynamic analyses, usually adopted for a prelim-inary stage of design, it has been shown (Bilotta, Lanzano, Madabhushi, & Silvestri, 2014; Fabozzi & Bilotta, 2016) that full dynamic analyses must be performed of the soil-structure interaction to take into account the influence of
the pre-existing stress state around the tunnel and of per-manent ground deformation during shaking. Indeed, assessment of numerical predictions against centrifuge model tests proved that such advanced analyses can pro-vide satisfactory interpretation of non-linear soil-structure interaction during earthquakes (Bilotta et al., 2014).
For both types of underground structures, this paper wishes to analyze from the staged construction to a design earthquake a real case of a metro tunnel and a multi-level propped station embedded in the subsoil of the city of Napoli. The study is focused on the effects of ground shak-ing on the seismic increment of internal forces in the under-ground structures with respect to those acting in static conditions; the effects in terms of transient and permanent deformation induced on the surrounding subsoil and build-ings were not considered in this stage of the research.
The case study
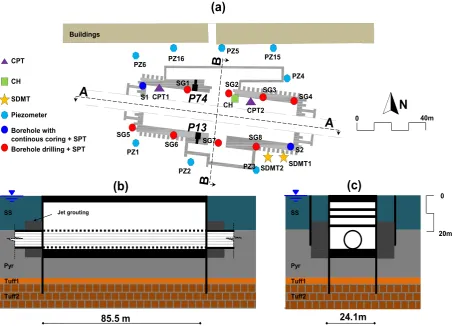
During last three decades, the metropolitan area of Napoli underwent an intense development of construction and expansion of two underground railways (Fig. 1a). Metro Line 1 connects the inner and hilly part of the city with the historical center and the Central railway station; Metro Line 6 starts from the western district of Fuorigrotta and terminates in the city center, close to the famous ‘Mas-chio Angioino’ castle in the Municipio square, where the two lines are inter-connected.
Uphill, most of the twin-tunnel stretches of Line 1 develop within the Neapolitan Yellow Tuff formation, dominating the subsoil of the urban area; on the other hand, close to the coastline both lines (i.e. the lower stretch of Line 1 and the western stretch of Line 6) are mainly excavated through marine, alluvial and volcanic soils over-lying the tuff, and often underwater (Fig. 1b and c).
San Pasquale station is one of the new large stations of Line 6, located a few tens of meters from the shoreline. It occupies an area of approximately 2000 m2, quite close to a series of residential buildings.Fig. 2shows the plan view (a) and the two main cross sections (b and c) of the station; in both sections the location of the tunnel with respect to the diaphragm walls of the station is illustrated.
In the plan inFig. 2a, two rectangular chambers located on the opposite short sides of the station are also sketched. They were built inside the diaphragm walls and the soil inside was treated with jet grouting, in order to allow a safe entrance of the tunneling boring machine (TBM) into the main shaft of the station after the preliminary demolition of the diaphragm panels.
The total time needed to reach the designed depth of the excavation and to build the underground structures was approximately 5 years and 10 months.
The underground excavation of the tunnel was carried out below the groundwater table, using an earth pressure balance (EPB) tunneling boring machine. The lining has an external excavation diameter of 8.150 m, with an inter-nal and exterinter-nal radius of 3.625 m and 3.925 m, respec-tively, for a total thickness of 0.3 m. The annular void between the extrados and the external excavation diameter is backfilled with a two-component grout layer 0.15 m thick.
The tunnel lining system is made of pre-cast reinforced concrete segments. Each ring is 1.7 m wide, assembled in nine precast C35/45 concrete elements: eight segments with trapezoidal shape, corresponding to a central angle of 41.5°, plus the keystone. The segments are jointed in both
longitudinal and circumferential directions with unbolted flat joints.
Geotechnical characterization and subsoil model
The geotechnical investigations carried out during the different stages of design and construction of the tunnel and the station aimed at characterizing the bedrock mor-phology, the groundwater level and the geotechnical prop-erties of the shallow deposits relevant for soil-structure interaction (L’amante et al., 2012). The investigation spots around the station are reported in Fig. 2a. In detail, two boreholes with continuous coring (S1 and S2), respectively 42 m and 49 m deep, were located at two opposite corners of the station shaft, while the borehole drillings, SG1-SG4 and SG5-SG8, 28–40 m deep, were evenly distributed along the Northern and Southern sides, respectively.
The layering obtained from the boreholes is drawn in Fig. 2b and c together with the simplified sections of the station and the tunnel. Like in most of the seaside areas of Napoli, the subsoil is characterized by alternating layers of volcanic and seashore deposits, lying above a sub-horizontal tufaceous bedrock. Starting from the ground surface, below a negligible thickness of man-made ground cover, about 17 m of seashore sands (SS) lie upon 27 m of volcanic products, divided into 24 m of pyroclastic silty sand (Pyr) and 3 m of the fractured facies of Neapolitan Yellow Tuff (Tuff1). The top of the bedrock (Tuff2) was intercepted at the depth of approximately 44 m.
Tuff2
continous coring + SPT Borehole drilling + SPT CPT
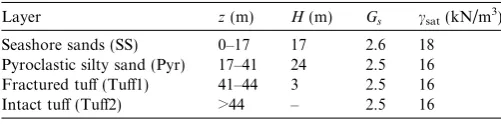
The different nature of the marine and volcanic materi-als is reflected by their specific gravity, Gs, and saturated unit weight, csat, measured on undisturbed samples, reported in Table 1. The mechanical parameters adopted for each layer in the numerical analyses will be later shown in section ‘Static analyses’.
The installation of a significant number of piezometers (PZ inFig. 2a) revealed neither appreciable variations with the location nor marked oscillations with time of the groundwater level, which remained stable within 1 m below the ground level before, during and after the excavations.
Standard penetration tests (SPT) carried out in all the boreholes (Fig. 3b), as well as two cone penetration tests (CPT) along the northern side (Fig. 3c), reached depths down to 35 m in the pyroclastic soil formation. In-depth measurements of shear wave velocity, VS, were undertaken down to 45 m in the tuff bedrock by a cross-hole test (CH) carried out along the northern side (circles inFig. 3d). Two seismic dilatometer tests (SDMT), located along the oppo-site side of the excavation area, yielded comparable mea-surements of VS, although limited to 25 m depth (triangles inFig. 3d).
The profiles of the number of blow counts, NSPT, and cone tip resistance, qc, reported inFig. 3b and c, show sim-ilar irregular variations of penetration resistance without any particular trend with depth. Notwithstanding the apparent soil heterogeneity, a good agreement can be observed between the results of the two CPT tests: on the average, the cone penetration resistance increases in the first 10 m of the marine sands. Thereafter, in the pyroclas-tic layers its variability is related mostly to the change of grading than to the increasing confining pressure with depth (Fig. 3c). The individual NSPT profiles (Fig. 3b) are consistent with this picture, although with lower resolution. This evidence, which is recurrent in the cohesionless vol-canic deposits in Napoli, may be related to the breakage of soil particles under compression, leading to underesti-mation of shear strength if based on the penetration resis-tance (Rippa & Vinale, 1983).
The values of shear wave velocity, VS, measured by Cross Hole and Seismic Dilatometer, are plotted inFig. 3d. As above anticipated, a quite good agreement can be noted among the different profiles, even if in the first 25 m the VS values from the SDMTs are, on the average, slightly higher than those obtained by the CH test. The little difference may be referred to opposite disturbance effects due to the different test procedures: in fact, with SDMT, the soil is
lat-erally displaced (and compressed) by the dilatometer, while in the CH test the soil can undergo a stress release follow-ing the drillfollow-ing. All in all, this latter test was considered as more reliable and conservative. The values of shear wave velocity are nearly constant and equal to approximately 200 m/s in the marine sand layer, thereafter they gradually increase up to 400 m/s in the topmost 5 m of the pyroclastic layer. The VS profile resulting from the CH tests keeps almost constant down to the top of the Tuff1, reaching val-ues of 700 m/s, and rapidly, once again, increases to 1250 m/s in the underlying bedrock (Tuff2). The mean VS profile, reported in Fig. 3d with thick solid line, was adopted in the dynamic analyses.
To complete the subsoil model assumed in the dynamic analyses,Fig. 4reports the curves describing the variation of the equivalent shear stiffness, G, normalized with respect to the small-strain value, G0, and of the damping ratio, D, with the shear strain amplitude,c. For the pyroclastic layer (Pyr), the curves were determined by performing Resonant Column – Torsional Shear (RCTS) tests on undisturbed block samples taken from the excavation front (Licata, 2015). For the SS and Tuff1 formations, the curves were inferred from previous laboratory tests performed on sam-ples of the same lithotypes taken in other sites (Vinale, 1988).
Static analyses
In order to calculate the internal forces acting in the walls supporting the excavation for the station and in the tunnel lining, plane strain finite element analyses were car-ried out using the Plaxis FE code (Brinkgreve, Kumarwamy, & Swolfs, 2015). As shown in the following, different domain extension and discretization were used to solve the soil-structure interaction problem for the station and for the tunnel. However, the same constitutive models, and relevant mechanical parameters, were used for the four layers described in Fig. 2b and c and listed in Table 1.
Table 2 summarizes the main geotechnical parameters adopted for the different soil layers.
Both marine sand (SS) and pyroclastic silty sand (Pyr) were modeled using Hardening Soil small strain (HSss), an elastic–plastic model with isotropic hardening, available in Plaxis model library (Benz, 2007). The friction angle,u0, and most stiffness parameters were estimated on the basis of the static penetration resistance, as suggested by differ-ent authors (e.g. De Beer, 1965; Jamiolkowski et al., 1988; Mayne, 2007). In particular, the reference axial stiff-ness for unloading/reloading, Eur
ref, was assumed as equal to twice the reference Young’s modulus, E50
ref, corresponding to the reference confining pressure, pref; the latter modulus, in turn, was set as equal to 6 times the mean value of qc(as suggested bySchanz & Bonnier, 1999). As usually adopted in practice, the reference constrained modulus, Eoedref, was set equal to E50ref, while the reference small strain shear mod-ulus, G0ref, was obtained by the shear wave velocity corre-Table 1
Layering and mean physical properties of the subsoil.
Layer z(m) H(m) Gs csat(kN/m3)
Seashore sands (SS) 0–17 17 2.6 18
Pyroclastic silty sand (Pyr) 17–41 24 2.5 16
Fractured tuff (Tuff1) 41–44 3 2.5 16
sponding to a mean lithostatic effective stress equal to pref. The HSss model can take into account the stiffness decay with strain level from the early stages of loading, by intro-ducing the shear strain levelc0.7at which the secant shear
modulus, G, is reduced about to 70% of its initial ‘small-strain’ value, G0.
For the underlying Neapolitan Yellow tuff, a linear elas-tic - perfectly plaselas-tic model obeying to the Mohr-Coulomb strength criterion was used, with the stiffness, E, and the strength parameters, c0andu0, defined on the basis of pre-vious experimental investigation by Evangelista and Pellegrino (1990).
For all materials, the elastic Poisson’s ratio, m, was set equal to 0.3; the initial stress state was calculated by assum-ing lithostatic conditions, with k0= 1 sinu0.
Numerical modeling of the excavation of the station
On the basis of the monitoring data, with a strong sim-plification effort, the construction process of the station could be subdivided into three main stages:
– Stage I: execution of archeological excavations and dewatering tests. The excavation proceeded slowly due to the possibility to find archeological remains. A
dewa-(a) (b) (c)
(d)
0 500 1000 1500
CH SDMT1 SDMT2 Vs-ave
0 20 40
CPT1 CPT2
SS
Pyr
Tuff1
z (m)
q
c(MPa)
V
s(m/s)
Tuff2
N
SPT-50 -40 -30 -20 -10 0
0 20 40 60
S1 S2 SG1 SG2 SG3 SG4 SG5 SG6 SG7 SG8
Fig. 3. Soil layering (a), profiles of SPT blowcounts (b), CPT tip resistance (c) and shear wave velocity (d).
0 2 4 6 8 10 12 14 16 18 20
0 0.2 0.4 0.6 0.8 1
0.0001 0.001 0.01 0.1 1
D (
%
)
G/G
0
γ
γ
(%)
Tuff1 SS Pyr
Fig. 4. Variation with shear strain of normalized stiffness and damping ratio for SS, Pyr and Tuff1.
Table 2
Soil parameters for FE analyses.
Soil Model csat(kN/m3) m(–) u0(°) c0(kPa) E(MPa) E50ref(MPa) Eoedref (MPa) Eurref(MPa) c0.7(%) G0ref(MPa) pref(kPa)
SS HSss 18 0.3 37 0 – 40 40 80 0.013 88 115
Pyr HSss 16 0.3 37 0 – 47 47 95 0.026 182 170
Tuff1 MC 16 0.3 27 200 2400 – – – – – –
tering test, which was judged as a preliminary manda-tory activity at the design stage, was carried out satisfac-torily; it allowed for the determination of the number of the pumping wells and of the total hydraulic capacity of the pumping system, in order to guarantee the dewater-ing throughout the whole area;
– Stage II: reaching of the design depth. The excavation was carried out by a relatively quick and straightfor-ward procedure, fully using the installed dewatering wells;
– Stage III: shutdown of the pumping wells. The internal structural box of the station was completely realized, including the protection of the waterproof membrane; later on, the closing of the pumping wells allowed the groundwater level to recover the nearly hydrostatic ini-tial conditions.
The transversal cross section B-B, sketched in Fig. 2c, was chosen to predict the behavior of the staged excavation and the seismic response. Fig. 5 shows the geometrical model adopted for the 2D analyses, where plane strain con-ditions were assumed. The size of the calculation domain was set as 250 m90 m, in order to minimize the edge effects. The mesh was made of 3277 triangular elements with 15 nodes each. The average element size was 2.62 m. It must be noted that the model is not symmetrical (differ-ently from the sketch in Fig. 2c), being the depths of the grouted layer and of the tuff formation different on the opposite sides.
The diaphragm walls, due to the huge section dimen-sions, were modeled as soil standard triangular elements, rather than using the standard options available for struc-tural elements, such as plates. Linear elastic behavior was assumed for such elements; in detail, for the T section, two different values of the Young’s modulus were adopted, i.e. 30 MPa for the portion of full concrete and 13 MPa for the rib obtained by homogenizing soil with concrete.
The slabs were modeled with node-to-node anchors with unit spacing, by adopting an axial stiffness EA equivalent to that of the actual plates (Table 3). The bending behavior
of the slabs was not considered, due to their extremely low bending stiffness, compared to that of the T-shaped dia-phragm walls.
The jet grouting treatment was also modeled with soil-like elements, as an elastic perfectly plastic material with Mohr-Coulomb strength, assuming stiffness and strength parameters suggested in the literature (Croce et al., 2004) as summarized inTable 4.
At the soil-diaphragm interface, a limiting shaft friction was imposed, by considering a null adhesion and a friction angle equal to 2/3 of that of the surrounding soil.
The static calculations consisted of 24 steps, in order to reproduce as realistically as possible the true construction sequence (Autuori, 2016).
The final results are summarized in Fig. 6; note that, being the construction and the subsoil not symmetric, the profiles of kinematic and static variables on the two oppo-site sides, facing the sea and the buildings, are not expected to be the same.
The plots in Fig. 6a show the comparison of the hori-zontal displacements predicted (solid line) at the end of the excavation with those measured (dots) at the locations of the T-shaped panels P13 (sea side) and P74 (building side), respectively. The comparison of the results with the monitoring data confirms that the deformation behavior of the diaphragm walls is greatly influenced by the embed-ment in the tuff bedrock and by the top slab, which act as rigid constraints to the base and the top, respectively. The presence of the three intermediate slabs does not affect sig-nificantly the deformed shape of the T diaphragm walls, due to the relatively low axial stiffness of the props.
The numerical simulation of such a complex construc-tion process included: excavaconstruc-tions in several steps, soil grouting, installation of four temporary prop levels (mod-eled as node-to-node anchors, activated after the excava-tion immediately below the elevaexcava-tion of the installaexcava-tion), and groundwater lowering of nearly 25 m. It can be appre-ciated that the above procedure was capable to predict a fairly close agreement with the observed horizontal dis-placements of the diaphragm walls, with the difference
90 m
never exceeding 20%. A comparable satisfying agreement was obtained also for vertical displacements at the ground surface (seeAutuori, 2016).
In Fig. 6b the bending moments accumulated in the large T-shaped panels are plotted against depth. The max-imum value of the bending moment occurs on the building side at the depth of about 26 m (practically corresponding to the maximum excavation depth) and reaches nearly 9.9 MN m/m. On the sea side, the maximum value occurs at the same depth, but it is significantly lower, reaching about 8.3 MN m/m.
Numerical modeling of the excavation of the tunnel
The segmental section of the tunnel (Fig. 7a), the geom-etry of which was already described in section ‘The case study’, was modeled as a continuous concrete ring (Fig. 7b) in the numerical analyses, adopting an equivalent inertia of the lining section,Ieq, defined as proposed byWood (1975),
by the following formula:
Ieq ¼Ijþ
4
n
2
I ð1Þ
where n is the number of joints, Ij the inertia of a single
joint,Ithat of the continuous lining.
A linear elastic behavior was assumed for both concrete and grout, with the relevant parameters summarized in Table 5.
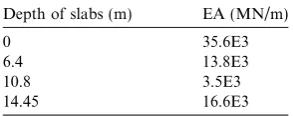
The FE mesh of the subsoil and the tunnel developed in Plaxis 2D is shown in Fig. 8. The lateral boundary condi-tions during static analysis consisted of fixed displacements in the horizontal direction at the vertical sides of the model and fixed displacements in both directions at the bottom. Displacements along the upper surface were set free.
An interface between the grout and the soil was intro-duced, by using interface elements having reduced strength and stiffness parameters compared to the surrounding soil. A reduction factor of 0.7 was adopted.
The mechanical properties of each soil layer have been previously shown inTable 2. In this numerical model, only a single layer of tuff (Tuff1) was introduced, while the underlying intact tuff was assumed as a rigid bedrock.
In order to reproduce the state of stress around the tun-nel cavity, taking into account the 3D arching effect that occurs within the soil and the deformations before lining installation, the initial lithostatic stress, r0, was propor-tionally reduced around the cavity to:
r¼ ð1 kÞr0 ð2Þ
Table 3
Axial stiffness of slabs.
Depth of slabs (m) EA (MN/m)
0 35.6E3
6.4 13.8E3
10.8 3.5E3
14.45 16.6E3
Table 4
Material parameters for the jet grouting.
Material c(kN/m3) k(m/s) u(°) rc(MPa) rt(MPa) c0(MPa) E
where the stress relaxation coefficientkwas assumed equal to 0.3, according toPanet (1982).
The excavation was then simulated through three phases (Fabozzi, Bilotta, & Russo, 2016):
Phase 1. Generation of the initial lithostatic stress field. Phase 2. Stress relaxation.
Phase 3. Lining installation and grouting, in drained conditions.
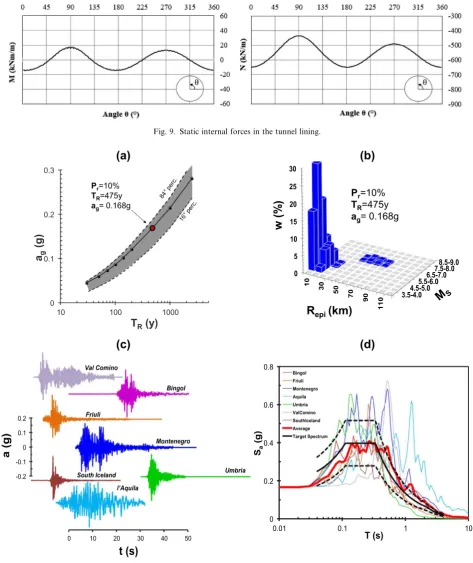
Fig. 9shows the results of calculations in terms of bend-ing momentMand normal forceNinduced in the tunnel lining by such a simplified 2D excavation process. Starting from this static state of stress, pseudo-static and full dynamic analyses were performed, as detailed in sections ‘Pseudo-static analyses’ and ‘Full dynamic analysis of the tunnel’.
Free-field seismic response analyses
According to the probabilistic seismic hazard approach (PSHA), adopted by the Italian Building code (NTC,
2008), the reference value of the peak ground acceleration, ag, for a given design limit state, is related to the probabil-ity of exceedance, Pr, of the earthquake along the reference life cycle of the building or infrastructure, VR. For the ‘Riv-iera di Chiaia’ site, the median hazard curve shown in Fig. 10a provides a value of ag= 0.168 g, by assuming a ‘life safety limit state’ (i.e. Pr= 10%), and VR= 50y, which correspond to a return period, TR, of the design earth-quake as high as 475y.
Fig. 10b reports the corresponding de-aggregation his-togram, providing the relative contribution, w, to the selected hazard value as a function of the magnitude, MS, and site-source distance, Repi. The plot reflects the major influence of near-field seismic sources with relatively low potential magnitudes, located in the volcanic areas sur-rounding the city, compared to the minor dependence of the hazard curve of peak acceleration from far-field high-magnitude sources, pertaining to the Apennine chain fault systems.
The selection of natural seismic input motions used in the dynamic analyses was performed using REXEL code (Iervolino, Galasso, & Cosenza, 2009). Seven seismic
sig-Fig. 7. (a) Actual vs. (b) simplified geometry of the segmental tunnel lining.
Table 5
Tunnel lining parameters.
Material E(MPa) m c(kN/m3) I(m4/m) t
i(m) Ieq(m4/m) teq(m)
Concrete 33,500 0.2 25 0.00225 0.30 0.00101 0.23
Grout 26,000 0.2 15 0.00028 0.15 – –
nals recorded on rock outcrop were selected in the ranges of 4.5 < Mw< 7 and 0 < Repi< 100 km, encompassing the whole de-aggregation histogram (seeFig. 10b). The aver-age spectrum of the records resulted compatible with the class ‘A’ target spectrum, as specified for this site by the seismic hazard map, in accordance with the NTC (2008). Finally, the signals were scaled to the design amplitude of ag= 0.168 g.
Fig. 10c and d respectively show the selected time histo-ries and the corresponding elastic response spectra, these latter plotted together with the average and the target spectra.
Table 6reports the main features of the selected signals, all recorded at European seismic stations, which were sub-jected to a band-pass filtering in the range of 0.1–25 Hz prior to the seismic response analyses.
Fig. 9. Static internal forces in the tunnel lining.
(a)
(b)
0 0.1 0.2 0.3
10 100 1000
ag
(g
)
T
R(y)
Pr=10%
TR=475y
ag= 0.168g
3.5-4.04.5-5.0 5.5-6.06.5-7.0
7.5-8.08.5-9.0 0
5 10 15 20 25 30
10
30
50 70
90
110
Pr=10%
TR=475y
ag= 0.168g
w
(%
)
R
epi(km)
(c)
(d)
0 10 20 30 40 50
-0.2 -0.1 0 0.1 0.2
Val Comino
Bingol
Friuli
Montenegro
Umbria
l’Aquila South Iceland
t (s)
a (g)
0 0.2 0.4 0.6 0.8
0.01 0.1 1 10
Sa
(g)
T (s)
Bingol Friuli Montenegro Aquila Umbria ValComino SouthIceland Average Target Spectrum
Given the flatness of the area and the relatively homogeneity of the subsoil, characterized by horizontal soil layering (see Fig. 2), any topographic effect was excluded and the stratigraphic amplification of the free-field motion was evaluated by means of one-dimensional seismic response analyses. The analyses were carried out using the EERA code (Bardet, Ichii, & Lin, 2000), operating in total stresses and in the frequency domain by a linear equivalent approach. The acceleration time his-tories of the selected records were applied as reference input motions at the outcropping bedrock, with a time step Dt = 0.01 s.
The dependency on shear strain amplitude of the equiv-alent parameters (shear stiffness and damping ratio) of the materials SS, Pyr and Tuff1 was assumed as described by the curves shown in Fig. 4; the seismic bedrock (Tuff2) was assumed as a half-space with a linear visco-elastic behavior.
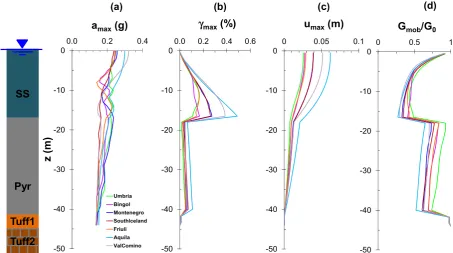
Fig. 11 shows the results obtained for the seven input motions in terms of vertical profiles of maximum acceleration, amax, maximum shear strain,cmax, maximum horizontal displacement relative to the bedrock, umax, and mobilized value of normalized shear stiffness, Gmob/G0.
It is clear that, even though some amplification of acceleration occurs across the Pyr formation, the highest shear deformations develop within the more deformable SS surface layer. Moreover, a different trend is observed in terms of maximum accelerations and strains among the different earthquakes. As a matter of fact, the largest accelerations are related to Montenegro earthquake (dark blue line) as far as the Pyr layer is considered, while l’Aquila earthquake (light blue line) induces the highest horizontal displacements and, consequently, the largest strains throughout the whole soil layering.
In order to explain these observations,Fig. 12illustrates a comparison between Montenegro and l’Aquila records in terms of:
– frequency spectra, F(f), obtained by Fast Fourier Trans-form of the input accelerograms (bedrock), of the accel-erations computed at the top of Pyr layer (z= 17 m) and at surface (z= 0);
– amplification functions, A(f), computed at the top of Pyr layer and at surface, both relative to the bedrock.
By inspection ofFig. 12a and b it is clear that the fre-quency content of Montenegro input motion is spread out on the higher frequencies, up to about 10 Hz, while L’Aquila record is characterized by a lower frequency con-tent, approximately in the range of 0.1–5 Hz, with a dom-inant frequency of 0.8 Hz. At the depth ofz= 17 m, the 1st and the 2nd modes of the Pyr layer tend to amplify l’Aquila (Fig. 12b) slightly more than Montenegro (Fig. 12a), but in both cases the frequency content is not substantially mod-ified by amplification phenomena. At this depth, because of the higher frequency content, Montenegro induces a value of amax larger than that caused by l’Aquila (seeFig. 11a). Conversely, due to the low frequency content, the latter motion tends to produce larger displacements and, thus, larger strains (seeFig. 11b and c).
Moving to the surface (z= 0,Fig. 12c and d), the ampli-fication phenomena are clearly ascribed to the deformabil-ity of the SS layer, the fundamental frequency of which was checked to range between 1.7 and 2.5 Hz, depending on the strain level mobilized by the selected input motion. As a result, the signal characterized by the lowest frequency con-tent, i.e. l’Aquila earthquake, was that most significantly amplified by the uppermost layer.
This latter input motion was therefore viewed as the most conservative loading condition for predicting the seis-mic performance of both the station and the tunnel, with the analyses which will be described in the following sections.
Pseudo-static analyses
In order to simulate the seismic performance of both the station and the tunnel, although in an approximate way, a simplified decoupled approach was first followed. With such a kind of approach, the effect of an earthquake is sim-ulated with an equivalent seismic load, statically applied to the structure as a distribution of inertia forces or displace-ments (e.g.Argyroudis & Pitilakis, 2012; Do, Dias, Oreste, & Maigre, 2015). The results of the free-field seismic response analyses described in the previous section were therefore used as pseudo-static loading of the same subsoil-structure models adopted for the static analyses reported in section ‘Static analyses’.
For both the station and the tunnel, the profile of peak horizontal displacements corresponding to the free-field Table 6
Main features of the selected seismic signals.
Earthquake ID Earthquake name Date Mw Fault mechanism Station ID Repi(km) WaveformID
2309 Bingol 01/05/2003 6.3 Strike-slip ST539 14.0 7142
34 Friuli 06/05/1976 6.5 Thrust ST20 23.0 55
93 Montenegro 15/04/1979 6.9 Thrust ST64 21.0 198
291 Umbria Marche 06/10/1997 5.5 Normal ST236 5.0 651
2142 South Iceland 21/06/2000 6.4 Strike-slip ST2558 5.0 6349
71 Val Comino 11/05/1984 5.5 Normal ATQ 17.4 276
soil response to l’Aquila earthquake (light blue line in Fig. 11c) was statically applied to the boundaries of the numerical model. The soils were modeled as linearly elastic, by adopting the profile of the equivalent shear modulus, Gmob, mobilized in the corresponding free-field analysis (light blue line in Fig. 11d). As well-known, the results of elastic analyses are independent of the initial stress state, which makes them not affected by the static conditions considered.
Pseudo-static analyses of the station
Fig. 13 compares the bending moments along the two peripheral diaphragm walls, as obtained from the static analysis (black lines), already reported inFig. 6b in section ‘Numerical modelling of the excavation of the station’, with the seismic increments obtained through the pseudo-static analysis (red lines); this latter was carried out by assuming, for simplicity, the lithostatic stress state as initial condition. The seismic action was simulated as horizontal displacements acting along the two opposite vertical boundaries of the same model shown in Fig. 5, with the verse of the displacements pointing towards the sea side, which represents the worst condition for the most flexible diaphragm, i.e. that located at the buildings side.
It can be noted that the seismic increments of the bend-ing moment are comparable to the static values from sur-face to 5 m depth, i.e. beneath the first slab; they keep low values moving from the surface down to the depth of the lowest slab (17 m), the maximum bending moment being attained at an intermediate depth between the lowest
slab and the very bottom of the excavation (i.e. about 27 m). In this depth range, they have an opposite sign with respect to those induced by the excavation, while the are increasing the static values along the foot of the diaphragm walls. This discordance can be explained recalling that the sign of the static moments does not change across the exca-vation bottom, since the slab was cast in place after they have occurred reaching the maximum excavation depth.
As a consequence, the static and the pseudo-static max-imum bending moments cannot be simply added for the structural assessment of the panels, because they occur at different depths. In fact, the maximum value of the addi-tional seismic moments is about 3 MNm/m on both build-ings and sea sides, and occurs at a depth of about 24 m, slightly above the excavation bottom (27 m), correspond-ing to the diaphragm section mostly stressed by the excava-tion, with static moments equal to 9.9 or 8.3 MN m/m on the buildings and sea side, respectively. In such a section, the additional pseudo-static bending moments are approx-imately equal to 2 MN m/m on both sides of the excava-tion; although smaller than the above mentioned maximum values, they are high enough to make this depth as that to be considered as the most critical in seismic con-ditions, with a resultant peak value of the bending moment equal to about 12 MN m/m on the buildings side.
It was not possible to run reliable dynamic analyses for the station, since the FEM mesh had been optimized, in terms of boundary distance and mean grid spacing, for reproducing the observed static deformation following the complex construction stages; the same model was there-fore not adequately suited for full dynamic analyses. Being
(a) (b) (c) (d)
aware of the inherent limitations, a pseudo-static analysis was thus performed, by using a horizontal seismic coeffi-cient, kh, uniformly applied on the whole domain as a mul-tiplier of the soil and structural weights. This simplified assumption was considered to be reasonable, by looking at the moderate variability of the profiles of amaxreported inFig. 11a and after checking the negligible effects of non-synchronous motion. Therefore, the coefficient kh was assumed as equal to the weighted average of the profile of amax, the weights being the thickness of the layers times the soil unit weight. For all the input accelerograms consid-ered, the value of khresulted constrained between 0.17 and 0.20, with the maximum value pertaining to l’Aquila input motion; this latter was considered - once again - the most conservative seismic loading.
The bending moments resulting from the alternative pseudo-static analyses with kh= 0.20 are plotted with blue lines inFig. 13; it can be observed that the seismic incre-ments computed with this ‘inertial’ pseudo-static approach result, at least in the most loaded sections, higher than those predicted by the ‘kinematic’ pseudo-static approach
above described. Note that, by using a seismic coefficient uniformly acting throughout the whole domain, the sign of the seismic increments along the excavation is the same of that predicted with the ‘kinematic’ approach, while the trends appear oriented towards the same verse along the foot of the walls. Nevertheless, the worst combination of static and seismic moments is still located at the bottom of the excavation and approaches 13 MNm/m on the build-ing side.
Pseudo-static analyses of the tunnel
Fig. 14shows the FEM mesh adopted for the pseudo-static analysis of the tunnel, with a schematic pattern of the boundary conditions. As suggested by Argyroudis and Pitilakis (2012), the distribution of displacements cor-responding to the input motion was applied at a distance of three diameters from the tunnel. The numerical mesh con-sists of 135,273 15-node triangular elements, with an aver-age size of 0.5 m. The lateral boundary conditions during pseudo-static analysis allow for free displacements along
0
the vertical direction; the bottom nodes of the domain are fixed, while those at surface are free to move in vertical direction, and constrained to a constant horizontal dis-placement equal to the maximum free-field value, as also assumed in previous literature studies (e.g. Do et al., 2015; Tsinidis, Pitilakis, & Anagnostopoulo, 2016).
Fig. 15 shows the contours of horizontal
displacements predicted with the above numerical model in free-field conditions (a) and with the presence of the structure (b). The first drawing confirms that the reduced size of the domain was enough to reproduce a homogeneous field of displacements, while the second contour shows the ‘shadowing’ effect induced by the presence of the tunnel on the deformation of the soil around.
The effect of the boundary distance from the structure was investigated in terms of increments of internal bend-ing moments, DM, and hoop forces, DN, induced in the transverse tunnel section. Fig. 16 shows the comparison for the cases of boundary distance, d, equal to three, two and one time the tunnel diameter, D. Differences are negligible if not null.
Full dynamic analysis of the tunnel
The above mentioned difficulty to use in dynamic condi-tions the same numerical model reproducing the history of excavation was much less in the case of the tunnel-subsoil system. A coupled approach was followed, being the soil-structure interaction inherently included in the
step-by--10 -8 -6 -4 -2 0 2 4 6 8 10 Bending moment (MNm/m)
0
10
20
30
40
50
z (m
)
-10 -8 -6 -4 -2 0 2 4 6 8 10 Bending moment (MNm/m)
Tuff2 Tuff1 Pyr SS
Building side
Static analysis
Pseudo - Static (umax)
Pseudo - Static (Kh)
Tuff2
Sea side
Positive displacements
Positive Inertial forces
Fig. 13. Comparison of the bending moments obtained from static analysis of the excavation of the station vs. the seismic increments resulting from the pseudo-static analysis using imposed displacements and inertia forces.
d=3D d=3D
ux ux
) b ( )
a (
step solution of the equations of motion in the time domain, this time accounting for the pre-failure non-linear behavior of soil through the ‘HSss’ constitutive model.
It is worth mentioning that the same FE mesh used for static analysis (seeFig. 8) was originally calibrated for the full dynamic analysis. As a matter of fact, the width of such numerical model was originally optimized by a series of sensitivity analyses, in order to reach a true free-field con-dition at the lateral borders and to minimize the influence of vertical boundaries, modeled with viscous dashpots as suggested by Lysmer and Kuhlemeyer (1969). Also, the mesh was discretized aiming at a reliable propagation of the maximum significant frequency of the input signal (Kuhlemeyer & Lysmer 1973), leading to an average size of 0.65 m.
The reference input motion of l’Aquila earthquake was applied at the rigid base of the model as a time history of acceleration. An additional small-strain viscous damping was introduced in the dynamic calculation by means of the well-known Rayleigh formulation, which considers a linear combination of the mass [M] and the stiffness [K] matrices as follows:
C¼aR½M þbR½K ð3Þ
The damping coefficients, aR and bR, were calculated
following to the ‘double frequency approach’, assuming as target values the first natural frequency of the deposit and the main frequency of the input motion.
The full dynamic analyses of the tunnel-subsoil system were carried out in drained conditions, since previous anal-yses of liquefaction potential byLicata (2015)showed that the soil layers surrounding the tunnel are unlike to suffer for neither liquefaction nor significant pore water pressure build-up under the seismic actions considered.
The non-linear soil constitutive model allowed for pre-dicting the evolution of the internal forces in the lining from the values following the excavation stages (see section ‘Numerical modelling of the excavation of the tunnel’) until the end of shaking.Fig. 17, indeed, shows the time history of the bending moment and the hoop force at the section h= 283°, where the ratio M/Nreaches its maximum value
over time. The residual bending moment is equal to 8.5 kN m/m, with a peak value of 54 kN m/m, while the residual normal force is equal to 630 kN/m, with a peak value of 692 kN/m.
Fig. 18shows the increments of internal forces around the whole lining resulting from the pseudo-static and full dynamic analyses; in this latter case, the values plotted are those predicted at the time of peak acceleration, for consistency with the assumptions made for applying the pseudo-static approach.
The comparison shows that, at least for this particular case, the pseudo-static analysis underestimates the incre-ment of forces with respect to the full dynamic analysis.
Literature shows that the magnitude of such a difference between the two approaches is strongly dependent on the soil-structure relative stiffness and the interface behavior,
) b ( )
a (
Fig. 15. Contours of horizontal displacements in free-field conditions (a) and with soil-tunnel interaction (b).
with the tendency to increase with the lining flexibility and for a condition closer to ‘‘no slip” interaction (Tsinidis et al., 2016). In the case of Metro Line 6 of Napoli, charac-terized by a rather flexible lining with a soil-structure inter-face closer to ‘‘no slip”rather than a ‘‘full slip”condition, the two approaches show a difference up to about 60% in the most loaded tunnel sections. This result is in agreement with previous studies (Bilotta et al., 2007; Argyroudis & Pitilakis, 2012; Tsinidis et al., 2016) showing, in almost all cases of flexible lining, an underestimation of the dynamic increment of the internal forces with the simplified pseudo-static approach, as a function of the interface behavior and lining flexibility.
Conclusive remarks
The assessment of the seismic safety of underground structures is becoming more and more important, espe-cially in densely populated areas, even with low to moder-ate seismicity. Notwithstanding the recent updmoder-ates in the use of numerical methods and the gathering of experience provided by experiments on physical models, significant doubts still arise in the engineering practice when account-ing for studies published in the literature or design guideli-nes, if any.
In this paper, a case study represented by a large open multi-propped excavation and a circular segmented tunnel in a densely urbanized area of the city center in Napoli has been used to investigate some of the mentioned aspects.
For instance, for the complexity of both excavation geometry and staged construction such as those character-izing San Pasquale station, a full dynamic analysis was con-sidered neither affordable nor reliable. The two conventional pseudo-static analyses, applying either dis-placements along the boundaries and, alternatively, inertial forces throughout the whole subsoil-structure domain, pro-vided rather different profiles of bending moments, the lar-ger values coming from the latter analysis.
The incremental bending moments calculated in the dia-phragm walls supporting the deep excavations were not negligible when compared to the rather large static values calculated during the excavation steps. For the ‘kinematic’ approach, the incremental bending moment in the most loaded section at the bottom of the excavation was a bit less than 20%, while that predicted at the same depth by the ‘inertial’ method approached 40% of the static value.
In the case of the tunnel, due to the relatively simpler geometry and staged excavation, the seismic increments of bending moments and axial hoop forces could be calcu-lated through both a simplified pseudo-static analysis and a full dynamic analysis, showing a satisfying agreement. The kinematic approach was followed, showing a poor sensitiv-ity to the extension of the FE domain, in this particular case. It is worth noting that a pronounced influence of the size of the model might be found in more ’complex’ subsoil conditions, or in cases where significant soil plasticization occurs in the equivalent pseudo-static analysis.
Fig. 17. Time histories of (a) bending moment,M, and (b) hoop force,N, at the section located ath= 283°in the lining.
By an engineering point of view, both approaches show that significant seismic increments of internal forces arise in the lining. In fact, the various analyses yielded incremental bending moments of the same order of magnitude and incremental axial thrusts about 20% of the corresponding maximum static values. It should be kept in mind that the segmental tunnel lining is a typical solution suited for reducing the bending moments due to its relatively low flex-ural stiffness, thus both the static and earthquake-induced bending moments are relatively small and not particularly demanding for the structural section.
As a final remark, the example of the San Pasquale sta-tion and tunnel highlights that seismic effects on under-ground structures should not be overlooked, even in low to moderate seismicity areas. Furthermore, the lessons learned from this pilot study on a real case history were enough stimulating for assessing the limitations of simpli-fied methods of pseudo-static analysis versus more advanced dynamic approaches. While the case of the sta-tion highlighted the difficulty of finding mesh optimizasta-tion criteria satisfying the needs of accuracy for both static and dynamic analyses of multi-propped excavations, that of the tunnel confirmed that, even with relatively simple lining geometries, the approximation of the pseudo-static analy-ses can result still too rough.
Conflict of interest
There is no conflict of interest.
Acknowledgements
This work was carried out as part of WP3 ‘Tunnels’ of the sub-project on ‘Earthquake Geotechnical Engineering’, in the framework of the research programme funded by Italian Civil Protection through the ReLUIS Consortium. Dr. Lorenza Evangelista is warmly acknowledged for the help provided in preparing the map inFig. 1.
References
Argyroudis, A., & Pitilakis, K. (2012). Seismic fragility curves of shallow tunnels in alluvional deposits.Soil Dynamics and Earthquake Engi-neering, 35, 1–12.
Autuori, S. (2016).La stazione San Pasquale della metropolitana di Napoli. Costruzione, monitoraggio ed analisi dei comportamenti osservatiPhD Thesis. University of Napoli ‘Federico II’.
Benz, T. (2007). Small-strain stiffness of soils and its numerical conse-quencesPhD thesis. University Stuttgart.
Bardet, J., Ichii, K., & Lin, C. (2000). EERA a computer program for equivalent-linear earthquake site response analyses of layered soil deposits. Univ. of Southern California Dep. of Civil Eng.
Bilotta, E., Lanzano, G., Madabhushi, S. P. G., & Silvestri, F. (2014). A round robin on tunnels under seismic actions.Acta Geotechnica, 9(4), 563–579.http://dx.doi.org/10.1007/s11440-014-0330-3.
Bilotta, E., Lanzano, G., Russo, G., Santucci de Magistris, F., & Silvestri, F. (2007). Methods for the seismic analysis of transverse section of circular tunnels in soft ground. InISSMGE-ERTC12 workshop at XIV ECSMGE ‘‘Geotechnical Aspects of EC8”. Patron Editore. Chapter 22. Brinkgreve, R. B. J., Kumarwamy, S., & Swolfs, W. M. (2015). Plaxis,
material models, Netherlands; 65–80.
Conti, R., Madabhushi, G. S. P., & Viggiani, G. M. B. (2012). On the behaviour of flexible retaining walls under seismic actions. Geotech-nique, 62, 1081–1094.
Croce, P., Flora, A., & Modoni, G. (2004). Jet grouting. Technology, design and controlPhD thesis. CRC Press (pp. 24–26)..
DM 14/1/2008. Norme Tecniche per le Costruzioni. S.O. n. 30 - Gazzetta Ufficiale della Repubblica Italiana, No. 20–4/2/2008.
De Beer, E. (1965). Bearing capacity and settlement of shallow founda-tions on sand. In Proceedings of the symposium on bearing capacity and settlement of foundations, Duke University (pp. 15–33).
Do, N. A., Dias, D., Oreste, P., & Maigre, I. D. (2015). 2D numerical investigation of segmental tunnel lining under seismic loading.Soil Dynamics and Earthquake Engineering, 72(2015), 66–76.
Evangelista, A., & Pellegrino, A. (1990). Caratteristiche geotecniche di alcune rocce tenere italiane. III ciclo di Conferenze di Meccanica e Ingegneria delle Rocce, MIR90, Torino.
Fabozzi, S., & Bilotta, E. (2016). Behaviour of a segmental tunnel lining under seismic actions.Procedia Engineering, 158, 230–235.
Fabozzi, S., Bilotta, E., & Russo, G. (2016). Numerical interpretation of monitoring data of an instrumented tunnel segmental ring.1st IMEKO TC-4 international workshop on metrology for geotechnics, Italy, Benevento, March 17–18.
Hashash, Y. M. A., Hook, J. J., Schmidt, B., & Yao, J. I.-C. (2001). Seismic design and analysis of underground structures.Tunnelling and Underground Space Technology, 16, 247–293.
Hashash, Y. M. A., Park, D., & Yao, J. I.-C. (2005). Ovaling de-formations of circular tunnels under seismic loading, an up-date on seismic design and analyses of underground structures.Tunnelling and Underground Space Technology, 20, 435–441.
Iervolino, I., Galasso, C., & Cosenza, E. (2009). REXEL: computer aided record selection for code-based seismic structural analysis.Bulletin of Earthquake Engineering, 8, 339–362.
Iida, H., Hiroto, T., Yoshida, N., & Iwafuji, M. (1996). Damage to Daikai subway station, Soils and Foundations, Japanese Geotechnical Soci-ety, Special issue on geotechnical aspects of the 17 January 1995 Hyogoken-Nambu.Earthquake, 283–300.
Jamiolkowski, M., Ghionna V.N., Lancellotta R., Pasqualini E. (1988). New application of penetration tests in design practice. InProceedings of the international symposium on penetration testing (ISOPT-1)(Vol. 1, pp. 263–296). Rotterdam (The Netherlands): Balkema.
Kawashima, K. (1999). Seismic design of underground structures in soft ground: a review. In Kusakabe, Fujita, Miyazaki (Eds.),Geotechnical aspects of underground construction in soft ground. Balkema, Rotter-dam, ISBN 90 5809 1 066.
Kuhlemeyer, R. L., & Lysmer, J. (1973). Finite element method accuracy for wave propagation problems. Journal of the Soil Mechanics and Foundation Division, 99(5), 421–427.
L’amante, D., Flora, A., Russo, G., & Viggiani, C. (2012). Displacements induced by the installation of diaphragm panels.Acta Geotechnica, 7(3) , 203–218.http://dx.doi.org/10.1007/s11440-012-0164-9.
Licata, V. (2015).A laboratory and field study on cyclic liquefaction of a pyroclastic soilPhD thesis in Geotechnical Engineering. University of Napoli FedericoII.
Lysmer, J., & Kuhlemeyer, R. L. (1969). Finite dynamic model for infinite media.Journal of Engineering Mechanics Division, ASCE, 859–877.
Mayne, P. W. (2007). Cone penetration testing (NCHRP synthesis). National Research Council, Washington, DC: Transportation Re-search Board.
Panet, M., & Guenot, A. (1982). Analysis of convergence behind a face of a tunnel. Tunnelling, 82. Institute of Mining and Metallurgy, 197–204. Pitilakis, K., Tsinidis, G. (2014). Performance and seismic design of underground structures, state-of-art. In M. Maugeri & C. Soccodato (Eds.),Earthquake geotechnical engineering design, Geotechnical Geo-logical and Earthquake Engineering(Vol. 28, pp. 279–340). Geneva, Switzerland: Springer http://dx.doi.org/10.1007/978-3-319-03182-8_ 11.
Rippa, F., & Vinale, F. (1983).Effetti del terremoto del 23 Novembre 1980 sul patrimonio edilizio di Napoli. Atti XV Convegno Italiano di Geotecnica, Spoleto: AGI, Roma.
Russo, G., Viggiani, G. M. B., & Viggiani, C. (2012). Geotechnical design and construction issues for Lines 1 and 6 of the Naples Underground. Geomechanics and Tunnelling, 5, 300–312. http://dx.doi.org/ 10.1002/geot.201200016.
Beyond 2000 in computational geotechnics(pp. 281–290). Rotterdam: Balkema.
Soccodato, F. M., Tropeano G. (2015). The role of ground motion characters on the dynamic performance of propped retaining struc-tures. InProceedings of the 6th international conference on earthquake geotechnical engineering, 1–4 November 2015. Christchurch, New Zealand (paper no. 645).
St. John, C. M., & Zahrah, T. F. (1987). Aseismic design of underground structures.Tunnelling and Underground Space Technol-ogy, 2(2), 165-19.
Tropeano, G., & Soccodato, F. M. (2014). Dynamic analyses of propped retaining structures. InProceedings of the 8th European conference on numerical methods in geotechnical engineering (NUMGE 2014)(Vol. 2, pp. 1193–1198).
Tsinidis, G., Pitilakis, K., & Anagnostopoulo, C. (2016). Circular tunnels in sand: dynamic response and efficiency of seismic analysis methods at extreme lining flexibilities.Bulletin of the Earthquake Engineering, 14, 2903–2929.http://dx.doi.org/10.1007/s10518-016-9928-1.
Vinale, F. (1988). Caratterizzazione del sottosuolo di un’area campione di Napoli ai fini di una microzonazione sismica. Rivista Italiana di Geotecnica, 2(1988), 77–100.
Wood, A. M. (1975). The circular tunnel in elastic ground.Geotechnique, 25(1), 115–127.