Full Terms & Conditions of access and use can be found at
http://www.tandfonline.com/action/journalInformation?journalCode=vjeb20
Download by: [Universitas Maritim Raja Ali Haji] Date: 11 January 2016, At: 20:46
Journal of Education for Business
ISSN: 0883-2323 (Print) 1940-3356 (Online) Journal homepage: http://www.tandfonline.com/loi/vjeb20
A Classroom Labor Market Game Illustrating
the Existence, and Implications of, Statistical
Discrimination
Kevin E. Henrickson
To cite this article: Kevin E. Henrickson (2014) A Classroom Labor Market Game Illustrating the Existence, and Implications of, Statistical Discrimination, Journal of Education for Business, 89:7, 352-360, DOI: 10.1080/08832323.2014.909769
To link to this article: http://dx.doi.org/10.1080/08832323.2014.909769
Published online: 29 Sep 2014.
Submit your article to this journal
Article views: 57
View related articles
A Classroom Labor Market Game Illustrating the
Existence, and Implications of, Statistical
Discrimination
Kevin E. Henrickson
Gonzaga University, Spokane, Washington, USA
Many undergraduate students report a lack of concern about facing labor market discrimination throughout their careers. However, there is ample evidence that discrimination based on race, gender, and age still persists within the labor market. The author outlines a classroom experiment demonstrating the existence of discrimination, even when the participants consider themselves above discriminating against others. The results can be used to facilitate discussions surrounding various labor market outcomes and the prevalence of discrimination within labor markets. As such, this experiment is appropriate for many business courses, including courses in economics, management, and ethics.
Keywords: classroom games, economic education, labor market discrimination, statistical discrimination
Traditional models of discrimination such as Becker (1971) focus on discrimination as a taste for which employers are willing to pay.1 This preference is typically assumed to come from employers, their customers or their employees and be based on personal prejudices toward one particular group based on race, gender, sexual orientation, etc. Yet, evidence from Eisner and Harvey (2009), Sipe, Johnson, and Fisher (2009a), and Kelan and Jones (2010) all points to younger generations not being very concerned about dis-crimination in the workplace, even in the face of ample evi-dence that they are likely to encounter discrimination throughout their careers, such as Neumark, Bank, and Van Nort (1996), Bertrand and Mullainathan (2004), Carlsson and Rooth (2007), Sipe et al. (2009b), and Kaas and Man-ger (2012), among others. To help explain this seeming par-adox, this article presents an easily administered classroom game/experiment, designed for undergraduate business stu-dents, that leads to statistical discrimination, as described and developed by Arrow (1972a, 1972b), Phelps (1972), Aigner and Cain (1977), Lundberg and Startz (1983), Lang (1986), Coate and Loury (1993), and Oettinger (1996).2
In a large survey of undergraduate business students, Sipe et al. (2009a) found evidence that the current
generation of undergraduate students generally underesti-mate the potential impact of discrimination on their future career prospects. Similarly, Kelan and Jones (2010) found that MBA students tend to view gender as a nonissue, while Eisner and Harvey (2009) found that members of Genera-tion Y are neutral as to whether discriminaGenera-tion represents a problem for women today, while also being optimistic that deliberate discrimination is on the decline. One potential explanation for this seeming disregard of the potential effects of discrimination on their careers is posited by Hira (2007), who argued that this generation has been raised in a more diverse atmosphere, having come to expect and antic-ipate equality. Others point toward a more gender-neutral workplace where discrimination is not discussed, stemming from gender fatigue within organizations (Kelan, 2009). Regardless of the cause, teaching about discrimination, its causes and its consequences is an important part of business education, yet potentially a topic that needs more motiva-tion in light of the previous evidence that students underes-timate its importance.
Statistical discrimination, sometimes referred to as expe-rience based discrimination, is originally attributable to Phelps (1972) and Arrow (1973). Previous models of dis-crimination, following Becker (1971), focused on discrimi-nation based on personal biases, while statistical discrimination focuses on market inefficiencies caused by incomplete information, and the role that group averages
Correspondence should be addressed to Kevin E. Henrickson, Gonzaga University, Department of Economics, 502 E. Boone Ave., Spokane, WA 99258, USA. E-mail: henrickson@jepson.gonzaga.edu
ISSN: 0883-2323 print / 1940-3356 online DOI: 10.1080/08832323.2014.909769
and/or stereotypes can play in conveying information.3As such, statistical discrimination developed as a way to model the incorporation of group characteristics, including race and gender, into decision making behavior. In this sense, statistical discrimination, while still a form of discrimina-tion, is not necessarily based on prejudices, hatred or spite, but rather is a tool used by uninformed parties to make deci-sions by attributing group stereotypes to applicants based on their observable characteristics.4
For example, in the automobile insurance market, the insurer does not know how good of a driver any individual is, so they use gender and age to help determine what rate to charge. In this respect, all individuals who fit into a cer-tain category are attributed with the insurer’s belief regard-ing the average drivregard-ing ability of that group, implyregard-ing that good drivers in a bad group are charged higher rates than optimal as they are considered poor drivers based on their grouping, while bad drivers with good characteristics would be given lower rates than optimal as they are credited with being better drivers based on their characteristics. Notice that as the insurer learns more about these drivers over time, these rates should converge on optimal rates as the impact of the driver’s characteristics are less important than their individual driving history. Indeed, within the literature there are several studies examining firm learning and the impacts of this learning on statistical discrimination (e.g., Altonji & Pierret, 2001; Farber & Gibbons, 1996; Hendricks, DeBrock, & Koenker, 2003; Pinkston, 2005; Lange, 2007).
One of the aforementioned potential explanations for the results found by Eisner and Harvey (2009), Sipe et al. (2009a), and Kelan and Jones (2010) is that the students surveyed believe that traditional sources of discrimination based on prejudices are becoming less and less prevalent over time (Hira, 2007). However, statistical discrimination, while not necessarily based on prejudiced views, is still dis-crimination, and is highly unlikely to disappear over time, as this practice can actually improve firm efficiency if the firm lacks complete information and their stereotypes con-form to actual group differences. As Arrow (1998) illus-trated, this makes statistical discrimination particularly problematic as it will not be driven out of the market by competitive forces, implying that these same students who do not believe discrimination will adversely impact their careers, may face statistical discrimination which will either help or hurt their careers depending on how firms view individuals with their characteristics.5 For example, Holzer, Raphael, and Stoll (2006) found that if employers do not conduct background checks on their prospective employees, they use race as a proxy for criminal histories. In particular, they found that employers statistically dis-criminate against African American men resulting in signif-icant disparities between Black and White men in terms of their employment and earnings. African American men with no criminal histories therefore face an increased likeli-hood of being attributed with a higher probability of being
a criminal, as they are assessed the employer’s view of the group, while White men with criminal histories are helped by this statistical discrimination as they are assigned a lower probability of being a criminal based on the group for which they belong.6
There are many models and empirical estimates of the prevalence and impact of discrimination within the labor market, as there are several field and classroom experi-ments demonstrating statistical discrimination.7 Many of these studies use field experiments outside of the classroom to test for statistical discrimination in a variety of settings including customer relations (e.g., List, 2004) and attitudes toward applicants based on the perceived ethnicity of their name (e.g., Bertrand & Mullainathan, 2004; Ewens, Tom-lin, & Wang, 2014). These studies typically seek to differ-entiate between taste-based discrimination stemming from prejudiced views, and statistical discrimination, something that Arrow (1998) argued is very difficult, finding strong support for statistical discrimination playing a key role in market outcomes. Still other studies use an experimental approach to derive results from the interaction of risk pref-erences and discrimination (Dickinson & Oaxaca, 2009) or the speed of employer learning when the employers have little prior experience with different groups from which to base their statistical discrimination (Feltovich & Papageor-giou, 2004). The common link between all of these studies is their focus on testing for statistical discrimination in experimental settings, and then identifying the factors that influence this type of discrimination. However, two previ-ous studies have focused on using experimental designs as an instructional tool, rather than as a research tool. Closer to the aims of this study, Anderson and Haupert (1999) out-lined an in-class experiment in which workers belong to one of two groups and are interviewed for jobs, while Fryer, Goeree, and Holt (2005) used a similar approach, but devel-oped the experiment electronically where students are ran-domly paired via a web application.
With this study, I contribute to this literature by provid-ing an adapted version of the experimental approach devel-oped by Anderson and Haupert (1999), and refined by Fryer et al. (2005). Specifically, I expand on the experimen-tal design created by Anderson and Haupert (1999) to incorporate fewer changes round by round, simplifying the experimental setup, but also incorporating a third category of worker.8 In addition, the experiment described here is geared toward the undergraduate business student, with a great deal of postexperiment discussion aimed at students with experience, or interests in, a variety of business disci-plines. The experiment is designed to be run in one class period of 50 min or longer, with class discussion following the experiment. In addition, the setup is flexible, based on the number of students present on the day in which it is run. By the end of the experiment, students will have a much greater understanding of statistical discrimination, and how this type of discrimination can occur even if there are no
STATISTICAL DISCRIMINATION IN A CLASSROOM GAME 353
prejudices against any particular group, helping to connect the results of Eisner and Harvey (2009), Sipe et al. (2009a), and Kelan and Jones (2010) with the myriad of evidence that discrimination persists within the labor market. This experi-ment has been used in a variety of undergraduate classes and can be modified to account for a wide variety of topics, including, but not limited to, business attitudes toward risk, wage determination, government programs, wage inequality, and unemployment rates across racial groups.
The remainder of this article is divided into three sec-tions. The next section details the setup and operation of the statistical discrimination experiment, with an example of the class handout and record sheet provided in the Appendix. The following section offers discussion items following the experiment and points out nuances of the experiment that are purposefully incorporated to stimulate different types of discussions depending on the participating group. Finally, the final section offers concluding comments and remarks.
STATISTICAL DISCRIMINATION EXPERIMENT SETUP
This experiment is designed to be run in a 50 min or longer class, and can be easily scaled up or down depending on the number of participants present the day it is run, although the setup described here is for use in a class of 40 students.9 The intended audience for this experiment is undergraduate business students who have prior experience with principles level economics; however, this experiment has been run with many different groups of participants, and there are no issues with participants who have little to no previous business/economics experience, other than requiring modi-fication of the postexperiment discussion described subse-quently. On the day of the experiment, all participants receive a copy of the experiment design and record sheet located in the Appendix. The students are asked to read this over individually, before the instructor verbally covers this information.10
Once students have finished reading the experiment directions from the Appendix, they are divided into two groups: workers and firms. For a class of 40 students, 30 of them would be assigned the role of workers, while 10 would be assigned the role of firms. Index cards are then distributed to each of the 30 workers, with the worker’s
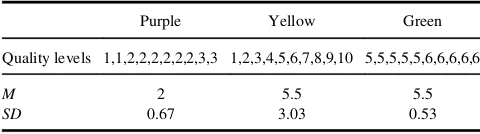
color type on one side of the card, and their productivity, which varies by experiment period/round on the other. Table 1 shows the distribution of worker productivity/qual-ity by color type, including the mean and standard deviation of worker quality for each group. Given that the objective is for firms to learn how to incorporate worker color into their decision making rather than learning that a particular worker is high or low productivity, the output levels shown in Table 1 cycle between the 10 workers of each color grouping over the 10 rounds such that each worker “represents” each productivity level for their color group by the end of the experiment.11
In addition to being able to inform potential employers of their color type, prospective employees also have the option of choosing whether to invest in education, a signal that they can share with potential employers. If they choose to invest in education, there is a $0.25 charge for that round to the worker that will be subtracted from their negotiated wage to determine their earnings for the period. Education does not carry over from one round to the next, and the cost of education does not vary by color group. However, inves-ting in education does double the worker’s productivity level, so firms know that if the worker has chosen to invest in education their native productivity level will be doubled.12
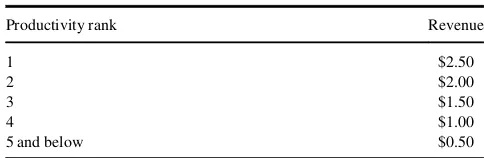
The students assigned to the role of employers do not have any information on the distribution of workers prior to the experiment, and do not have any prior information on the color groups to know how to incorporate this informa-tion into their decision making. This setup is the key to demonstrating statistical, or experience based, discrimina-tion as the employers will learn over the 10 rounds if worker color matters, and if so, how they should use this information. At the beginning of each round, employers are charged with hiring two workers from the pool of 30 poten-tial employees. To accomplish this, firms are able to “interview” workers, a task that consists of finding out their color grouping and whether they chose to invest in educa-tion.13The firms then negotiate a wage with the prospective employees, which, for simplicity, is limited to $0.25 incre-ments from $0.25 to $1.00. Once the wage is determined, the worker reveals the productivity for the round and records the earnings, which are equal to the negotiated wage minus any education costs that they incurred for the round. The firm then combines the productivity of their two hired workers and reports that to the instructor, who tracks the total productivity hired by each firm. Firm payoffs are then competitively determined based on the relative ductivity of firms, with the firm employing the most pro-ductive workers receiving $2.50 for the round, and the firm (s) employing the least productive workers receiving $0.50 for the round as shown in Table 2, with all other firms earn-ing an amount between these two levels.14 At the end of each round, both the firms and workers record their out-comes on the record sheet shown in the Appendix, with
TABLE 1
Distribution of Worker Productivity by Color Grouping
Purple Yellow Green
Quality levels 1,1,2,2,2,2,2,2,3,3 1,2,3,4,5,6,7,8,9,10 5,5,5,5,5,6,6,6,6,6
M 2 5.5 5.5
SD 0.67 3.03 0.53
firm profits for the round calculated as their revenue minus their negotiated wage costs.
As discussed in more detail in the following section, each component of this experiment is designed to generate classroom discussion around various elements of discrimi-nation. In particular, with workers being of three different color groups, and firms having no prior expectations/biases in regard to the productivity of these groups, the issue of how and why color is used by firms, along with its implica-tions for workers, and firm outcomes is well motivated by the experiment. This experiment has been run in a variety of settings and has generated consistent results and lively discussions whether the students participate for fun, or are actually monetarily compensated based on their earnings over the 10 periods.
AREAS FOR EXAMINATION FOLLOWING THE EXPERIMENT
Many undergraduate students think of discrimination as a thing of the past that will not impact their lives, yet through this experiment they demonstrate discriminatory behavior themselves. While this is not discrimination based on preju-dices that they hold, given that they have no prior experi-ence with green, yellow, and purple workers, it still is discrimination, and leads to many potential topics of dis-cussion, several of which are outlined subsequently. Many of these topics are best discussed immediately following the experiment, while others may be better suited to the fol-lowing class period so that students can reflect on their experiences and/or the instructor can summarize the data generated.
Unemployment, Discouraged Workers, and Government Assistance
The experimental setup described previously necessitates that some workers are unemployed each round, since there are more workers available than there are available posi-tions at firms. A natural way to start the postexperiment dis-cussion is to ask students to calculate the unemployment rate in each period. Often this requires either teaching stu-dents how to calculate an unemployment rate, or reminding
them how to do this, by taking the number of unemployed workers and dividing it by the total number of individuals who were seeking jobs. With the setup described previ-ously, this would imply a typical unemployment rate of 33.33%; however, it is not uncommon to have this rate move higher toward the end of the experiment because firms get more demanding in their wage negotiations once they learn how to use all of the available information in their hiring decisions.
With knowledge of the class-wide unemployment rate, a follow-up question is whether this unemployment rate is representative of each group’s unemployment rate. Without calculating this rate, the students immediately, having gone through this experience, know that some groups have much higher/lower unemployment rates in later rounds. Partici-pants are then asked to calculate the unemployment rate for each of the color groupings based on the data collected in round 1 and round 10. In round 1, the unemployment rate tends to be relatively equal across color groups, but by round 10 there are wide discrepancies in the unemployment rate across groups. Specifically, the purple color group tends to have much higher unemployment rates than either the green or yellow groups. This then prompts a discussion regarding why employers would hire more yellow and green workers if they do not have any prior prejudices against purple workers. The notion of statistical- and expe-rienced-based discrimination can be introduced at this point. Specifically, the instructor can ask yellow workers how they felt in the period that they were assigned produc-tivity levels one or two versus when they were assigned productivity levels 9 or 10. The typical responses to this line of questioning are consistent with statistical discrimi-nation, as these workers were treated as an average yellow worker, which hurt them when they were a high productiv-ity yellow worker, but helped them when they were a low productivity yellow worker.
Depending on the focus of the class in which the experi-ment is being conducted, this is also a good point to inter-ject discussion of how insurance companies use gender and age to determine car insurance rates. Another area of exam-ination following the calculation of unemployment rates is the ethical implications of statistical discrimination. While students seem quite comfortable describing discrimination in its most general form as unethical, they tend to be more introspective and cautious about making such claims after this experiment, as the 10 students assigned the role of firms were not being prejudiced or hateful in their discrimination. An easy extension to this experiment that can be incor-porated into the latter rounds is to offer government assis-tance to unemployed workers in the form of compensation, say $0.25, for any workers who do not get hired in a given round. This adaptation usually causes the average wages received to increase as workers have stronger negotiating positions. More interestingly, it often leads to discouraged workers who simply don’t bother trying to find
TABLE 2
Firm Payoffs Based on Total Productivity Rank
Productivity rank Revenue
1 $2.50
2 $2.00
3 $1.50
4 $1.00
5 and below $0.50
STATISTICAL DISCRIMINATION IN A CLASSROOM GAME 355
employment. Specifically, purple workers tend to not inter-view with firms, because they have low hopes of being employed, and know that they will receive some compensa-tion whether employed. This can then lead to discussion surrounding biases in the calculation of the unemployment rate and the incentive effects of government assistance.
Wage Determination/Attitudes Toward Risk
Another area for discussion following the experiment is the distribution of wages across color groupings. Using the results of the experiment, the instructor can calculate the average wage by color group for any period, but it is typi-cally most illustrative to calculate the average wages in period 1 and period 10. In period 1, average wages are rela-tively uniform across color groupings as the firms do not have enough experience with the different groupings to know how to incorporate the workers’ color into their deci-sion making. However, by period 10, all of the firms are using this additional information to help inform their hiring decisions. This change will result in differences in wages across color groupings, which can be used to generate actual measures of wage inequality such as a Gini coeffi-cient, or, alternatively, can be used qualitatively to discuss how statistical discrimination can lead to wage disparity across groups.
Once shown the actual distribution of worker productiv-ities across color groups, most students understand why purple workers are paid less than yellow and green workers. However, it is often less obvious that, because there are three color groupings, there may exist discrimination between the yellow and green workers. These two color groupings have the same average productivity, as shown in Table 1, but rarely end up with the same average wage as employers, facing competition from other employers, end up preferring one of these color groupings over the other. However, unlike the case of purple workers, the direction of this discrimination is largely influenced by the risk aver-sion of the participants assigned to the role of the 10 firms. Some of these individuals learn that if they want to come in first place for the round, they need to hire yellow workers as the highest ability yellow workers are of higher quality than the highest ability green workers. Other firms end up preferring green workers in order to minimize the risk of hiring extremely low productivity workers, since the lowest productivity green worker is much more productive than the lowest productivity yellow worker. This is a useful way to incorporate attitudes toward risk, a common topic in accounting, finance, and economics courses.
Firm Profits
Once students are comfortable understanding that firms are using color type to statistically discriminate, a natural ques-tion is why they do this if they do not dislike, or have
prejudices against, any of the color groupings. This experi-ment lends itself well to this discussion as the class can examine profits in early rounds with no statistical discrimi-nation and compare this with profits in later rounds with discrimination. The results show that those who incorporate color type into their decision making process do much bet-ter than those who are slower to figure out how to use this information. This can then be expanded into discussion of a variety of real-world situations in which statistical discrimi-nation may exist, including why it could be possible to see young women face this type of discrimination if firms assume that they may have interrupted careers due to family considerations.
This is also another area that the topic of business ethics can come into play. For example, health insurance is typi-cally more costly for those who fall into categories deter-mined to have a higher likelihood of illness. Health insurance companies would simply argue that insurance requires some to pay more than what they use to compen-sate for those who receive more in benefits than the premi-ums they paid. However, it is possible to ask if firms ethically should be able to use statistical discrimination to subsidize sicker patients, keeping in mind the need for the insurance companies to earn a profit.
Educational Attainment
A final avenue of examination following this experiment is examining the educational choices made across groups. In all cases, choosing to invest in education doubles worker productivity, making it a productive investment from soci-ety’s perspective given that the cost of this education is rel-atively low. However, purple workers typically learn that it is not worthwhile to invest in education since they antici-pate facing statistical discrimination. However, this also makes them less likely to be hired because they both belong to a group being statistically discriminated against, and also have chosen not to invest in education, which would have doubled their productivity. This dynamic can be used to dis-cuss how discrimination, in any form, can lead to such cycles of self-fulfilling prophecies whereby certain groups believe they will be discriminated against, and therefore do not invest in themselves, making them less likely to be employed in high paying jobs because they lack this train-ing, or as Arrow (1998) argued, when discrimination causes segregation of groups, in this case based on educational attainment, there will be little effort by firms to update their stereotypes.
This result tends to generate many comments and ques-tions from students as they are currently investing in educa-tion, which they believe will improve their productivity, and enhance their job prospects. As such, they tend to have strong prior assumptions regarding the value of education. In addition, as Eisner and Harvey (2009), Sipe et al. (2009a), and Kelan and Jones (2010) found, these students
also tend not to believe that they will face discrimination in their career, marking it worthwhile to ask if this experience has caused them to believe that discrimination may be more problematic than they had anticipated going into the experiment (it could be possible to even do a pre- and post-experiment survey), and if so, whether this calls into ques-tion their level of educaques-tional investment. Typically, one experiment will not sway anyone from believing that they will never be discriminated against to believing that they should not be investing in education; however, experienc-ing non–hate-based discrimination by their classmates often gives them enough perspective to understand why some may choose not to invest in education as a logical response to the risk of facing discrimination in their careers.
CONCLUSION
In this article I present a modified version of the experiment developed by Anderson and Haupert (1999) in which stu-dents are either assigned the role of a worker or a firm hir-ing workers. The setup is geared toward undergraduate business students, and is intended to generate employer learning overtime, which may eventually lead to statistical discrimination. The version of the experiment presented here differs from that of Anderson and Haupert by incorpo-rating three categories of workers, education, and also hav-ing other more nuanced differences which are geared toward participants in business classes. In addition, I spent a great deal of time explaining how the instructor can use this experiment in a wide variety of educational settings, tailoring the postexperiment discussion to the particular focus of the course. As such, I believe that this experiment offers an elegant way of teaching statistical discrimination and its potential labor market consequences to a wide vari-ety of undergraduate business disciplines.
The need to have students experience discrimination through an experiment such as this is particularly important in light of work by Eisner and Harvey (2009), Sipe et al. (2009a), and Kelan and Jones (2010), who all find evidence suggesting that current college students do not believe that discrimination will impact their work lives. Yet there is ample evidence that discrimination still persists in many labor markets and will negatively impact different catego-ries of workers during their careers. One explanation for this discrepancy in student expectations and labor market outcomes is the prevalence of statistical discrimination in the labor market. Under statistical discrimination, employ-ers assign categories of workemploy-ers with their perceptions of the average characteristics of this group based on their experience, making this type of discrimination potentially efficient, and yet not necessarily based on hate or prejudi-ces. If indeed an employer statistically discriminates with-out having any underlying prejudices, one would expect this type of discrimination to disappear over time if
employers gain new information about the potential work-ers they are evaluating. However, as shown by Pager and Karafin (2009), this also requires that employers update their beliefs as they gain more information, something that often doesn’t happen, with employers instead viewing devi-ations from their preconceptions as the exception, not the rule. Getting students to experience this type of tion can help illustrate how they can still face discrimina-tion in their careers without it requiring spiteful, prejudiced employers.
NOTES
1. For a detailed overview of the development of the discrimination literature, including empirical find-ings of discrimination, see Arrow (1998) or Altonji and Blank (1999).
2. Pager and Karafin (2009) show that employers often subtype exceptions to their preconceived stereo-types, which may also help to illustrate why stu-dents don’t view discrimination as a problem, since they view cases of discrimination as being the exception to the norm.
3. Note that this does not preclude prejudiced views, but also does not require them to explain labor mar-ket discrimination.
4. Note that if considering discrimination to be treating individuals differently, discrimination occurs every-where daily. For example, two workers who start working for a firm at the same time may be pro-moted at different rates because of differences in the quality of their work. This type of discrimina-tion, based on the merits of their work is not some-thing that one would typically worry about as an ethical issue. Instead it is typically discrimination based on arbitrary characteristics of the worker (e.g., race, gender, religion) that would be deemed impermissible forms of discrimination. As such, this experiment is designed to demonstrate the potential for discrimination in the absence of prejudiced employers, but does not delve into the many nuances of permissible versus impermissible discrimination as this is not the focus of this experiment.
5. It could be argued that over time unprejudiced employers will learn whether their stereotypes are correct, driving out even statistical discrimination; however, as shown by the aforementioned employer learning literature and Pager and Karafin (2009), this learning may not occur, and instead the employ-ers may view deviations from their preconceived stereotypes as exceptions rather than changing their hiring rules.
6. Note that such generalizations can sometimes lead to legislation which could help ease this impact for
STATISTICAL DISCRIMINATION IN A CLASSROOM GAME 357
individuals are do not fit the stereotype of their group, such as antiprofiling laws or affirmative action initiatives.
7. Riach and Rich (2002) provided a critical review of the use of field experiments/studies in testing for discrimination.
8. The experience with the electronic experiment described by Fryer et al. (2005) is that it is most appropriate for small classes, or in instances where the instructor would prefer that the experiment be conducted outside of class. When run with classes of more than 20 individuals, the electronic medium has proven to be difficult if students get even slightly off task, or if the class is not held in a com-puter lab setting, making the instructor more reliant on student laptops and internet access. In addition, the benefits of having the experiment conducted electronically, such as ease of matching students and the ease of tracking the data generated come at the cost of being able to illustrate fewer labor mar-ket outcomes through the experiment.
9. To scale the experiment for different class sizes, it would be necessary to add/eliminate worker types evenly from each of the three groups described later, focusing on adding/subtracting workers from the middle of the distribution to minimize the impact of changing the number of participants on the experi-mental outcomes. The number of students represent-ing firms can also be altered, but to appropriately demonstrate many of the concepts, there should always be excess workers such that some are unem-ployed in each period of the experiment.
10. Note that for shorter classes, it may be useful to dis-tribute the instructions the day prior to the actual experiment so that students can read it over before class, saving class time for the actual experiment. 11. So a worker in the yellow group in Table 1 may
have a productivity level of one in round 1, 5 in round 2, eight in round 3, and three in round 4, and so on, such that by the end of the 10 rounds he or she has had one round with each of the worker pro-ductivity levels between 1 and 10. For the other groups, the distribution of worker productivity implies that individuals will not necessarily have a different productivity level each round, but will have each of that color group’s productivity values by the end of the 10-period experiment.
12. With only two color groupings, this doubling of worker productivity through education could be thought of as biasing or even driving the statistical discrimination result. However, with three color groups whereby two of the groups have the same average productivity, this assumption that education doubles productivity should not influence the statis-tical discrimination of purple workers, but may
generate a second use of statistical discrimination when choosing between yellow and green workers as further explained below. Also, the experiment has also been run without education, with very simi-lar results to those described here.
13. Note that in Anderson and Haupert (1999), inter-viewing workers is costly, causing firms to weigh the potential benefits of interviewing another worker with the costs of interviewing that worker. The setup described here does not incorporate costly interviewing as the focus is more on having students see and experience statistical discrimination, some-thing better accomplished if firms learn how to incorporate worker categories faster.
14. Note that this approach to determining firm earnings each round also differs from the aforementioned experiments, and is used because it forces firms to directly compete with one another and more quickly figure out how to incorporate worker characteristics into their decision making.
REFERENCES
Aigner, D. J., & Cain, G. G. (1977). Statistical theories of discrimination in labor markets.Industrial & Labor Relations Review,30, 175–187. Altonji, J. G., & Blank, R. M. (1999). Race and gender in the labor market.
In O. Ashenfelter & D. Card (Eds.),Handbook of labor economics(Vol. 3, pp. 3143–3259). New York, NY: Elsevier Science.
Altonji, J. G., & Pierret, C. R. (2001). Employer learning and statistical discrimination.The Quarterly Journal of Economics,116, 313–350. Anderson, D. M., & Haupert, M. J. (1999). Employment and statistical
dis-crimination: A hands-on experiment.The Journal of Economics,25, 85– 102.
Arrow, K. J. (1972a). Models of job discrimination. In A. H. Pascal (Ed.),
Racial discrimination in economic life(pp. 83–102). Lexington, MA: D.C. Health.
Arrow, K. J. (1972b). Some mathematical models of race discrimination in the labor market. In A. H. Pascal (Ed.),Racial discrimination in eco-nomic life(pp. 187–204). Lexington, MA: D.C. Health.
Arrow, K. J. (1973). The theory of discrimination. In O. Ashenfelter & A. Rees (Eds.),Discrimination in labor markets(pp. 3–33). Princeton, NJ: Princeton University Press.
Arrow, K. J. (1998). What has economics to say about racial discrimina-tion?The Journal of Economic Perspectives,12, 91–100.
Becker, G. S. (1971).The economics of discrimination. Chicago, IL: Uni-versity of Chicago Press.
Bertrand, M., & Mullainathan, S. (2004). Are Emily and Greg more employable than Lakisha and Jamal? A field experiment on labor market discrimination.The American Economic Review,94, 991–1013. Carlsson, M., & Rooth, D.-O. (2007). Evidence of ethnic discrimination in
the Swedish labor market using experimental data.Labour Economics,
14, 716–729.
Coate, S., & Loury, G. C. (1993). Will affirmative-action policies eliminate negative stereotypes?The American Economic Review,83, 1220–1240. Dickinson, D. L., & Oaxaca, R. L. (2009). Statistical discrimination in
labor markets: An experimental analysis.Southern Economic Journal,
76, 16–31.
Eisner, S. P., & Harvey, M. E. O. (2009). C-change? Generation Y and the glass ceiling.S.A.M. Advanced Management Journal,71, 13–28.
Ewens, M., Tomlin, B., & Wang, L. C. (2014). Statistical discrimination or prejudice? A large sample field experiment.Review of Economics and Statistics,96, 119–134.
Farber, H. S., & Gibbons, R. (1996). Learning and wage dynamics.The Quarterly Journal of Economics,111, 1007–1047.
Feltovich, N., & Papageorgiou, C. (2004). An experimental study of statis-tical discrimination by employers.Southern Economic Journal, 837–849. Fryer, R. G., Goeree, J. K., & Holt, C. A. (2005). Experience-based dis-crimination: Classroom games.The Journal of Economic Education,36, 160–170.
Hendricks, W., DeBrock, L., & Koenker, R. (2003). Uncertainty, hiring and subsequent performance: The NFL draft.Journal of Labor Econom-ics,21, 857–886.
Hira, N. A. (2007, May 15). Attracting the twentysomething worker.
Fortune. Retrieved from http://archive.fortune.com/magazines/fortune/ fortune_archive/2007/05/28/100033934/index.htm
Holzer, H. J., Raphael, S., & Stoll, M. A. (2006). Perceived criminality, criminal background checks, and the racial hiring practices of employ-ers.Journal of Law and Economics,49, 451–480.
Kaas, L., & Manger, C. (2012). Ethnic discrimination in Germany’s labour market: A field experiment.German Economic Review,13, 1–20. Kelan, E. K. (2009). Gender fatigue: The ideological dilemma of gender
neutrality and discrimination in organizations. Canadian Journal of Administrative Sciences,26, 197–210.
Kelan, E. K., & Jones, R. D. (2010). Gender and the MBA.Academy of Management Learning & Education,9, 26–43.
Lang, K. (1986). A language theory of discrimination.The Quarterly Jour-nal of Economics,101, 363–382.
Lange, F. (2007). The speed of employer learning.Journal of Labor Eco-nomics,25, 1–35.
List, J. A. (2004). The nature and extent of discrimination in the market-place: Evidence from the field.The Quarterly Journal of Economics,
119, 49–89.
Lundberg, S. J., & Startz, R. (1983). Private discrimination and social intervention in competitive labor markets. The American Economic Review,73, 340–347.
Neumark, D., Bank, R. J., & Van Nort, K. D. (1996). Sex discrimination in restaurant hiring: An audit study.The Quarterly Journal of Economics,
111, 915–941.
Oettinger, G. S. (1996). Statistical discrimination and the early career evo-lution of the black-white wage gap.Journal of Labor Economics,14, 52–78.
Pager, D., & Karafin, D. (2009). Bayesian bigot? Statistical discrim-ination, stereotypes, and employer decision making. The Annals of the American Academy of Political and Social Science, 621, 70–93.
Phelps, E. S. (1972). The statistical theory of racism and sexism. The American Economic Review,62, 659–661.
Pinkston, J. C. (2005). A test of screening discrimination with employer learning.Industrial & Labor Relations Review,59, 267.
Riach, P. A., & Rich, J. (2002). Field experiments of discrimination in the market place.The Economic Journal,112(483), F480–F518. Sipe, S. R., Johnson, C. D., & Fisher, D. K. (2009a). University
students’ perceptions of gender discrimination in the workplace: Reality versus fiction.Journal of Education for Business,84, 339– 349.
Sipe, S. R., Johnson, C. D., & Fisher, D. K. (2009b). University students’ perceptions of sexual harassment in the workplace: A view through rose-colored lenses.Equal Opportunities International,
28, 336–350.
APPENDIX—Employment Experiment Instructions Setup:
In this experiment some of you will be assigned the role of a “worker,” while others will be assigned the role of a “firm.”
The experiment will consist of 10 rounds of play in which each employer/firm will attempt to hire 2 workers (note that there are too few firms for all of the workers, so some workers will be unemployed each round, and will subsequently receive a wage of $0.00 for the round).
Workers belong to one of three groups: Yellow, Green or Purple. Each group has the same number of workers, and worker productiv-ity may, or may not, vary by group (however, individual worker productivproductiv-ity will change from round to round, so even if you hire the same worker, they will not necessarily have the same productivity).
In each round, the firm will “interview” workers until they find the two that they want to hire. The interview process consists of the worker telling the employer their color group and whether they have chosen to get educated or not. In addition, the worker and firm have to agree on a wage (for simplicity, the available wages to be paid are $0.25, $0.50, $0.75 or $1.00).
Education costs $0.25 for each round (and does not vary with worker productivity), and doubles worker productivity. The worker’s payoff each round will be their negotiated wage minus any education costs.
The firm’s revenue each round will be based on competitive forces and found according to the total productivity of the two workers hired compared to that of other firms, and given by the following table:
If assigned the role of a worker. . . If assigned the role of an employer. . .
Round
Worker color
Hired (yes/no)
Negotiated
wage Productivity
Payoff (Wage – educ.
costs)
Negotiated wage costs
Worker colors
Total output
Payoff (Rev. – wages)
1 2 3 4 5 6 7 8 9 10 Total payoff
STATISTICAL DISCRIMINATION IN A CLASSROOM GAME 359
Productivity rank Revenue
1 $2.50
2 $2.00
3 $1.50
4 $1.00
5 and below $0.50
If multiple firms have the same productivity in the same round, they will split the earnings associated with their ranks. The firm’s total payoff is then their revenue given in the table above minus their wage costs.